Cognitive Collaboration Market by Component, Application Area, Deployment Mode, Organization Size (SMEs and Large Enterprises), Vertical and Region - Global Forecast to 2024


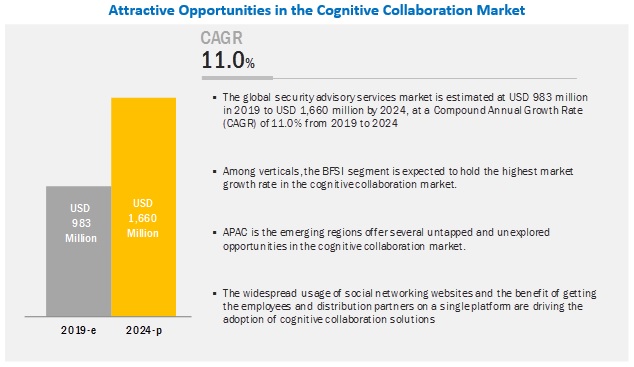
[149 Pages Report]The global cognitive collaboration market size is expected to grow from USD 983 million in 2019 to USD 1,660 million by 2024, at a Compound Annual Growth Rate (CAGR) of 11.0% during the forecast period. Easy integration with the already existing environment and increasing need for mobility and collaboration are the major factors driving the growth of the cognitive collaboration market.
Cloud segment to be the most significant contributor to the market growth during the forecast period
Cloud-based deployment has enabled businesses to operate without a server infrastructure or office location, thus enabling their employees to work remotely. The cloud-based implementation of cognitive collaboration solutions helps cut down the total cost of ownership and increase data storage capabilities for organizations. Organizations are finding cloud-deployed cognitive collaboration solutions attractive, as they are easy to deploy, offer agility for the organizations, and provide more scalability functions than on-premises solutions, at an affordable cost. This is one of the factors supporting the adoption of cloud-based cognitive collaboration solutions. Cloud-based deployment offers a usage-based service model, which provides organizations with the flexibility to pay cloud service vendors only when the services are used, as against the upfront CAPEX involved in on-premises deployment.
Education vertical to hold the highest market growth rate in the cognitive collaboration market in 2019
The educational institutions are witnessing the need to facilitate communication and collaboration among students, researchers, teachers, professors, and others to make learning easy from any remote area. New collaboration tools are transforming the way the education sector delivers training, manages a budget, and give tuitions. Enterprise collaboration solutions are expected to witness an increase in demand from the education sector, owing to the industry�s growing need for streamlined business processes. Enterprise collaboration solutions offer various benefits, such as improved teamwork, individual productivity, and accelerated decision-making.
Social media assistance to grow with the highest CAGR during the forecast period
Customer support and personal assistantship is one such area where the use of cognitive collaboration is high. Most businesses leverage cognitive collaboration social media assistance to know more about a participant through their social media pages such as LinkedIn and Facebook. Moreover, increasing the use of social media by its users has made it easy for cognitive collaboration solution providers to analyze and provide efficient customer support services. Optimization during conversations with the customers and new information learned by observing the human colleague are automatically fed into the social media system to make the cognitive collaboration solution smarter over time.
Key Market Players
The major vendors in the cognitive collaboration market are are Cisco (US), Microsoft (US), Slack Technologies (US), Softweb Solutions (US), CognitiveScale (US), LOOP AI Labs (US), Intec Systems Limited (UK), Bluescape (US), Collaboration.Ai (US), Resemble Systems (UAE), Chanty (Switzerland), Ku Zoom.ai (Canada), iotum (Canada), and Konolabs (US).
Scope of Report
|
Report Metrics |
Details |
|
Market size available for years |
2017�2024 |
|
Base year considered |
2018 |
|
Forecast period |
2019�2024 |
|
Forecast units |
Value (USD) |
|
Segments covered |
BFSI, IT and Telecom, Energy and Utilities, Education, Retail and healthcare |
|
Geographies covered |
North America, Europe, APAC, Latin America and MEA |
|
Companies covered |
Cisco (US), Microsoft (US), Slack Technologies (US), Softweb Solutions (US), CognitiveScale (US), LOOP AI Labs (US), Intec Systems Limited (UK), Bluescape (US), Collaboration.Ai (US), Resemble Systems (UAE), Chanty (Switzerland), Ku Zoom.ai (Canada), iotum (Canada), and Konolabs (US). |
This research report categorizes the cognitive collaboration market to forecast revenues and analyze trends in each of the following submarkets:
Based on the Component, the cognitive collaboration market has been segmented as follows:
- Solutions
- Services
Based on the Application area, the market has been segmented as follows:
- Data Analytics
- Facial Recognition
- Social Media Assistance
Based on the Deployment model, the cognitive collaboration market has been segmented as follows:
- Cloud
- On-Premises
Based on Organization size, the market has been segmented as follows:
- SMEs
- Large Enterprises
Based on the Vertical, the cognitive collaboration market has been segmented as follows:
- IT and Telecom
- Energy and Utilities
- BFSI
- Education
- Healthcare
- Retail
- Others
Based on Regions, the market has been segmented as follows:
- North America
- US
- Canada
- Europe
- UK
- France
- Germany
- Rest of Europe
- APAC
- China
- ANZ
- Rest of APAC
- MEA
- Middle East
- Africa
- Latin America
- Mexico
- Brazil
- Rest of Latin America
Recent Developments:
- In September 2019, Microsoft announced that it's offering, PowerPoint would be enabled with an AI-powered presentation coach, which would help the user by sharing feedbacks for the next presentation.
- In June 2018, Slack Technologies partners with Automatic Data Processing (ADP), an American provider of human resources management software and services. The partnership enables the combination of payroll expertise with Slack features, such as safety, privacy, and efficiency. Slack further plans to add other elements to the integrated platform, including employee searches, talent tools, and team collaboration.
- In January 2018, CognitiveScale launched Cortex 5, an AI and blockchain technology-based cloud software. This would help enterprises improve the implementation process and return on investment with regards to AI systems. Cortex 5 is available in both Amazon Web Services (AWS) and Microsoft Azure cloud environments.
Key Questions Addressed by the Report:
- What are the opportunities in the cognitive collaboration market?
- What is the competitive landscape in the market?
- What are the critical use cases existing in the market?
- What are the key trends and dynamics existing in the market?
Frequently Asked Questions (FAQ):
What does Cognitive Collaboration mean?
The cognitive collaboration leverages Artificial Intelligence (AI) to augment in-person and distributed collaboration experiences. It describes a fundamental shift in how people work together and leverage technology to foster human relationships, build better customer experiences, and ultimately achieve team goals faster.
What are the top trends in Cognitive Collaboration market?
Trends that are impacting Cognitive Collaboration market includes:
- Easy integration with the already existing environment
- Increasing need for mobility and collaboration
Who are the prominent players in the Cognitive Collaboration market?
Cisco, Microsoft, Slack Technologies, and Softweb Solutions, Bluescape, and Collaboration.Ai, Zoom.ai, CognitiveScale, Loop AI, iotum, Resemble Systems, Chanty and Konolabs, Intec Systems Limited
What are the major Cognitive Collaboration application areas?
- Data Analytics
- Facial Recognition
- Social Media Assistantship
What is the Cognitive Collaboration market size?
The global cognitive collaboration market size is expected to grow from USD 983 million in 2019 to USD 1,660 million by 2024, at a Compound Annual Growth Rate (CAGR) of 11.0% during the forecast period. Easy integration with the already existing environment and increasing need for mobility and collaboration are the major factors driving the growth of the cognitive collaboration market.
What are the major Cognitive Collaboration verticals?
IT and Telecom, Energy and Utilities, BFSI, Education, Healthcare and Retail .
To speak to our analyst for a discussion on the above findings, click Speak to Analyst
 Exclusive indicates content/data unique to MarketsandMarkets and not available with any competitors.
Table of Contents
1 Introduction (Page No. - 18)
1.1 Objectives of the Study
1.2 Market Definition
1.2.1 Inclusions and Exclusions
1.3 Market Scope
1.3.1 Market Segmentation
1.3.2 Regions Covered
1.4 Years Considered for the Study
1.5 Currency Considered
1.6 Stakeholders
2 Research Methodology (Page No. - 21)
2.1 Research Data
2.1.1 Breakup of Primary Participants� Profiles
2.1.2 Key Industry Insights
2.2 Market Breakup and Data Triangulation
2.3 Market Size Estimation
2.4 Market Forecast
2.5 Competitive Leadership Mapping Research Methodology
2.5.1 Vendor Inclusion Criteria
2.6 Assumptions for the Study
2.7 Limitations of the Study
3 Executive Summary (Page No. - 30)
4 Premium Insights (Page No. - 33)
4.1 Attractive Opportunities in the Cognitive Collaboration Market
4.2 Cognitive Collaboration Market, By Component, 2019
4.3 Market By Solution (2019 Vs. 2024)
4.4 Market By Organization Size (2019 Vs. 2024)
4.5 Market By Vertical (2019 Vs. 2024)
5 Market Overview and Industry Trends (Page No. - 36)
5.1 Introduction
5.2 Market Dynamics
5.2.1 Drivers
5.2.1.1 Easy Integration With the Already Existing Environment
5.2.1.2 Increasing Need for Mobility and Collaboration
5.2.2 Restraints
5.2.2.1 Difficulty in Countering Ediscovery and Legal Risks
5.2.3 Opportunities
5.2.3.1 Growing Integration of AI in Business Processes
5.2.3.2 Emerging Potential Markets
5.2.4 Challenges
5.2.4.1 Difficulties in Aligning Team Collaboration Software With Business Goals
5.3 Use Cases
5.3.1 Accenture Adopting Microsoft Teams to Enhance Team Collaboration
5.3.2 Insurers Adopting Engage AI to Improve Operations at Call Centers
6 Cognitive Collaboration Market, By Component (Page No. - 40)
6.1 Introduction
6.2 Cognitive Collaboration: Increase in the Adoption of Enterprise Collaboration Solutions Would Drive the Growth of Cognitive Collaboration Market
6.3 Solutions
6.3.1 Enterprise Video
6.3.1.1 Increasing Need to Deploy Business-Specific Videos Driving the Adoption of Enterprise Video Solutions
6.3.2 Unified Messaging and Synchronization
6.3.2.1 Growing Demand for Messaging Platform to Drive the Adoption of Unified Messaging and Synchronization Solutions
6.3.3 Project Management
6.3.3.1 Increasing Need to Simplify Numerous Project Activities and Need to Communicate With Team Driving the Adoption of Project Management Solutions
6.3.4 Enterprise Social Network
6.3.4.1 Demand for Organizations to Utilize Social Workflow Capabilities Driving the Traction of Enterprise Social Network Solutions
6.3.5 Others
6.4 Services
6.4.1 Professional Services
6.4.1.1 Need to Understand Organizations� Need for Collaboration and Efficiently Deploy Cognitive Collaboration Solutions Driving the Demand for Professional Services
6.4.2 Managed Services
6.4.2.1 Increase in the Adoption Rate of Enterprise Collaboration Solutions to Boost the Demand for Managed Services
7 Cognitive Collaboration Market, By Application Area (Page No. - 55)
7.1 Introduction
7.2 Data Analytics
7.2.1 Increasing Need to Analyze Data and Provide Insights Driving the Adoption of Cognitive Collaboration Solutions in Data Analytics Application Area
7.3 Facial Recognition
7.3.1 Increasing Need to Monitor Emotion and Attendance of the Participants in a Meeting Driving the Adoption of Cognitive Collaboration Solutions in Facial Recognition Application Area
7.4 Social Media Assistance
7.4.1 Growing use of Social Media to Provide Efficient Customer Support Services Driving the Adoption of Cognitive Collaboration Solutions in Social Media Assistance Application Area
8 Cognitive Collaboration Market, By Deployment Mode (Page No. - 60)
8.1 Introduction
8.2 Cloud
8.2.1 Need to Cut Down Total Cost of Ownership and Increase Data Storage Capabilities Driving the Adoption of Cloud-Based Cognitive Collaboration Solutions
8.3 On-Premises
8.3.1 Need to Hold Total Control Over Security of Sensitive Enterprise Data Driving the Adoption of On-Premises Cognitive Collaboration Solutions
9 Cognitive Collaboration Market, By Organization Size (Page No. - 63)
9.1 Introduction
9.2 Small and Medium-Sized Enterprises
9.2.1 Growing Byod and Mobile Workforce Trend to Boost the Adoption of Cognitive Collaboration Solutions Among Small and Medium-Sized Enterprises
9.3 Large Enterprises
9.3.1 Need to Enhance Employee Productivity Driving the Adoption of Cognitive Collaboration Solutions Among Large Enterprises
10 Cognitive Collaboration Market, By Vertical (Page No. - 66)
10.1 Introduction
10.2 IT and Telecom
10.2.1 Increasing use of Enterprise Video Solutions to Fuel the Adoption of Cognitive Collaboration Solutions in the IT and Telecom Vertical
10.3 Energy and Utilities
10.3.1 Need to Share Real-Time Information Across Various Locations Driving the Adoption of Cognitive Collaboration Solutions in the Energy and Utilities Vertical
10.4 Banking, Financial Services, and Insurance
10.4.1 Increasing Need to Collaborate With Both Internal Employees and External Clients to Boost the Adoption of Cognitive Collaboration Solutions in the BFSI Vertical
10.5 Education
10.5.1 Growing Demand for Elearning and Virtual Teaching Across Various Regions to Fuel the Adoption of Cognitive Collaboration Solutions in the Education Vertical
10.6 Healthcare
10.6.1 Rising Need to Enhance Clinical Collaboration and Medical Education Driving the Adoption of Cognitive Collaboration Solutions in the Healthcare Vertical
10.7 Retail
10.7.1 Growing Need to Offer Custom-Based Services to Customers Driving the Adoption of Cognitive Collaboration Solutions in the Retail Vertical
10.8 Others
11 Cognitive Collaboration Market, By Region (Page No. - 82)
11.1 Introduction
11.2 North America
11.2.1 United States
11.2.1.1 Rapid Growth of Technologies and Infrastructures to Boost the Adoption of AI-Based Collaboration Solutions Among the Enterprises in the US
11.2.2 Canada
11.2.2.1 Growing Technological Advancements to Boost the Adoption of AI Solutions Among the Industries in Canada
11.3 Europe
11.3.1 United Kingdom
11.3.1.1 Rising Adoption of Big Data and Analytics to Drive the Growth of Cognitive Collaboration Market in the UK
11.3.2 France
11.3.2.1 Initiatives From Government and Global Players to Create a Potential Market for AI-Based Collaboration Solutions in France
11.3.3 Germany
11.3.3.1 Numerous Expansion and Startup Opportunities to Boost the Growth of Cognitive Collaboration Market in Germany
11.3.4 Rest of Europe
11.4 Asia Pacific
11.4.1 China
11.4.1.1 Increasing Technological Development to Boost the Adoption of Cognitive Collaboration Solutions Among Enterprises in China
11.4.2 Australia and New Zealand
11.4.2.1 Already Existing Awareness and Financially Stable Enterprises to Boost the Adoption of Cognitive Collaboration Solutions in ANZ
11.4.3 Japan
11.4.3.1 Increasing Need for Cognitive Collaboration Solutions to Drive the Market Growth in Japan
11.4.4 Rest of Asia Pacific
11.5 Middle East and Africa
11.5.1 Middle East
11.5.1.1 Changing Customer Expectations and Increase in Investment From Global Companies to Enhance the Adoption of Cognitive Collaboration Solutions in the Middle East
11.5.2 Africa
11.5.2.1 Lack of Technological Skills and Poor Data Quality to Slow Down the Growth of Cognitive Collaboration Market in South Africa
11.6 Latin America
11.6.1 Mexico
11.6.1.1 Mexico to Witness Moderate Growth in the Cognitive Collaboration Market Due to the Slow Adoption Rate of AI- and ML-Based Solutions
11.6.2 Brazil
11.6.2.1 Growing Developments in AI, ML, and Nlp to Provide Opportunities for Vendors in the Cognitive Collaboration Market in Brazil
11.6.3 Rest of Latin America
12 Competitive Landscape (Page No. - 109)
12.1 Introduction
12.2 Competitive Leadership Mapping
12.2.1 Visionary Leaders
12.2.2 Dynamic Differentiators
12.2.3 Innovators
12.2.4 Emerging Companies
12.3 Ranking of Key Players
12.4 Competitive Scenario
12.4.1 New Product Launches and Product Enhancements
12.4.2 Partnerships and Collaborations
12.4.3 Mergers and Acquisitions
13 Company Profiles (Page No. - 117)
13.1 Introduction
(Business Overview, Products & Solutons, Key Insights, Recent Developments, SWOT Analysis, MnM View)*
13.2 Cisco
13.3 Microsoft
13.4 Slack Technologies
13.5 Softweb Solutions
13.6 Cognitivescale
13.7 LOOP AI Labs
13.8 Intec Systems Limited
13.9 Bluescape
13.10 Collaboration.Ai
13.11 Resemble Systems
13.12 Chanty
13.13 Zoom.ai
13.14 Iotum
13.15 Konolabs
*Details on Business Overview, Products & Soltions, Key Insights, Recent Developments, SWOT Analysis, MnM View Might Not be Captured in Case of Unlisted Companies.
14 Appendix (Page No. - 141)
14.1 Discussion Guide
14.2 Knowledge Store: Marketsandmarkets� Subscription Portal
14.3 Available Customizations
14.4 Related Reports
14.5 Author Details
List of Tables (108 Tables)
Table 1 Factor Analysis
Table 2 Evaluation Criteria
Table 3 Cognitive Collaboration Market Size and Growth, 2017�2024 (USD Million)
Table 4 Market Size, By Component, 2017�2024 (USD Million)
Table 5 Solutions: Cognitive Collaboration Market Size, By Type, 2017�2024 (USD Million)
Table 6 Enterprise Video Market Size, By Deployment Mode, 2017�2024 (USD Million)
Table 7 Enterprise Video Market Size, By Organization Size, 2017�2024 (USD Million)
Table 8 Enterprise Video Market Size, By Application Area, 2017�2024 (USD Million)
Table 9 Enterprise Video Market Size, By Region, 2017�2024 (USD Million)
Table 10 Unified Messaging and Synchronization Market Size, By Deployment Mode, 2017�2024 (USD Million)
Table 11 Unified Messaging and Synchronization Market Size, By Organization Size, 2017�2024 (USD Million)
Table 12 Unified Messaging and Synchronization Market Size, By Application Area, 2017�2024 (USD Million)
Table 13 Unified Messaging and Synchronization Market Size, By Region, 2017�2024 (USD Million)
Table 14 Project Management Market Size, By Deployment Mode, 2017�2024 (USD Million)
Table 15 Project Management Market Size, By Organization Size, 2017�2024 (USD Million)
Table 16 Project Management Market Size, By Application Area, 2017�2024 (USD Million)
Table 17 Project Management Market Size, By Region, 2017�2024 (USD Million)
Table 18 Enterprise Social Network Market Size, By Deployment Mode, 2017�2024 (USD Million)
Table 19 Enterprise Social Network Market Size, By Organization Size, 2017�2024 (USD Million)
Table 20 Enterprise Social Network Market Size, By Application Area, 2017�2024 (USD Million)
Table 21 Enterprise Social Network Market Size, By Region, 2017�2024 (USD Million)
Table 22 Other Solutions Market Size, By Deployment Mode, 2017�2024 (USD Million)
Table 23 Other Solutions Market Size, By Organization Size, 2017�2024 (USD Million)
Table 24 Other Solutions Market Size, By Application Area, 2017�2024 (USD Million)
Table 25 Other Solutions Market Size, By Region, 2017�2024 (USD Million)
Table 26 Services: Cognitive Collaboration Market Size, By Type, 2017�2024 (USD Million)
Table 27 Professional Services Market Size, By Organization Size, 2017�2024 (USD Million)
Table 28 Managed Services Market Size, By Organization Size, 2017�2024 (USD Million)
Table 29 Cognitive Collaboration Market Size, By Application Area, 2017�2024 (USD Million)
Table 30 Data Analytics: Market Size, By Region, 2017�2024 (USD Million)
Table 31 Facial Recognition: Market Size, By Region, 2017�2024 (USD Million)
Table 32 Social Media Assistance: Market Size, By Region, 2017�2024 (USD Million)
Table 33 Market Size, By Deployment Mode, 2017�2024 (USD Million)
Table 34 Market Size, By Organization Size, 2017�2024 (USD Million)
Table 35 Market Size, By Vertical, 2017�2024 (USD Million)
Table 36 IT and Telecom: Cognitive Collaboration Market Size, By Deployment Mode, 2017�2024 (USD Million)
Table 37 IT and Telecom: Market Size, By Organization Size, 2017�2024 (USD Million)
Table 38 IT and Telecom: Market Size, By Application Area, 2017�2024 (USD Million)
Table 39 IT and Telecom: Market Size, By Region, 2017�2024 (USD Million)
Table 40 Energy and Utilities: Market Size, By Deployment Mode, 2017�2024 (USD Million)
Table 41 Energy and Utilities: Market Size, By Organization Size, 2017�2024 (USD Million)
Table 42 Energy and Utilities: Market Size, By Application Area, 2017�2024 (USD Million)
Table 43 Energy and Utilities: Market Size, By Region, 2017�2024 (USD Million)
Table 44 Banking, Financial Services, and Insurance: Cognitive Collaboration Market Size, By Deployment Mode, 2017�2024 (USD Million)
Table 45 Banking, Financial Services, and Insurance: Market Size, By Organization Size, 2017�2024 (USD Million)
Table 46 Banking, Financial Services, and Insurance: Market Size, By Application Area, 2017�2024 (USD Million)
Table 47 Banking, Financial Services, and Insurance: Market Size, By Region, 2017�2024 (USD Million)
Table 48 Education: Market Size, By Deployment Mode, 2017�2024 (USD Million)
Table 49 Education: Market Size, By Organization Size, 2017�2024 (USD Million)
Table 50 Education: Market Size, By Application Area, 2017�2024 (USD Million)
Table 51 Education: Market Size, By Region, 2017�2024 (USD Million)
Table 52 Healthcare: Cognitive Collaboration Market Size, By Deployment Mode, 2017�2024 (USD Million)
Table 53 Healthcare: Market Size, By Organization Size, 2017�2024 (USD Million)
Table 54 Healthcare: Market Size, By Application Area, 2017�2024 (USD Million)
Table 55 Healthcare: Market Size, By Region, 2017�2024 (USD Million)
Table 56 Retail: Market Size, By Deployment Mode, 2017�2024 (USD Million)
Table 57 Retail: Market Size, By Organization Size, 2017�2024 (USD Million)
Table 58 Retail: Market Size, By Application Area, 2017�2024 (USD Million)
Table 59 Retail: Market Size, By Region, 2017�2024 (USD Million)
Table 60 Other Verticals: Cognitive Collaboration Market Size, By Deployment Mode, 2017�2024 (USD Million)
Table 61 Other Verticals: Market Size, By Organization Size, 2017�2024 (USD Million)
Table 62 Other Verticals: Market Size, By Application Area, 2017�2024 (USD Million)
Table 63 Other Verticals: Market Size, By Region, 2017�2024 (USD Million)
Table 64 Market Size, By Region, 2017�2024 (USD Million)
Table 65 North America: Cognitive Collaboration Market Size, By Country, 2017�2024 (USD Million)
Table 66 North America: Market Size, By Component, 2017�2024 (USD Million)
Table 67 North America: Market Size, By Solution, 2017�2024 (USD Million)
Table 68 North America: Market Size, By Service, 2017�2024 (USD Million)
Table 69 North America: Market Size, By Application Area, 2017�2024 (USD Million)
Table 70 North America: Market Size, By Deployment Mode, 2017�2024 (USD Million)
Table 71 North America: Market Size, By Organization Size, 2017�2024 (USD Million)
Table 72 North America: Market Size, By Vertical, 2017�2024 (USD Million)
Table 73 Europe: Cognitive Collaboration Market Size, By Country, 2017�2024 (USD Million)
Table 74 Europe: Market Size, By Component, 2017�2024 (USD Million)
Table 75 Europe: Market Size, By Solution, 2017�2024 (USD Million)
Table 76 Europe: Market Size, By Service, 2017�2024 (USD Million)
Table 77 Europe: Market Size, By Application Area, 2017�2024 (USD Million)
Table 78 Europe: Market Size, By Deployment Mode, 2017�2024 (USD Million)
Table 79 Europe: Market Size, By Organization Size, 2017�2024 (USD Million)
Table 80 Europe: Market Size, By Vertical, 2017�2024 (USD Million)
Table 81 Asia Pacific: Cognitive Collaboration Market Size, By Country, 2017�2024 (USD Million)
Table 82 Asia Pacific: Market Size, By Component, 2017�2024 (USD Million)
Table 83 Asia Pacific: Market Size, By Solution, 2017�2024 (USD Million)
Table 84 Asia Pacific: Market Size, By Service, 2017�2024 (USD Million)
Table 85 Asia Pacific: Market Size, By Application Area, 2017�2024 (USD Million)
Table 86 Asia Pacific: Market Size, By Deployment Mode, 2017�2024 (USD Million)
Table 87 Asia Pacific: Market Size, By Organization Size, 2017�2024 (USD Million)
Table 88 Asia Pacific: Market Size, By Vertical, 2017�2024 (USD Million)
Table 89 Middle East and Africa: Cognitive Collaboration Market Size, By Country, 2017�2024 (USD Million)
Table 90 Middle East and Africa: Market Size, By Component, 2017�2024 (USD Million)
Table 91 Middle East and Africa: Market Size, By Solution, 2017�2024 (USD Million)
Table 92 Middle East and Africa: Market Size, By Service, 2017�2024 (USD Million)
Table 93 Middle East and Africa: Market Size, By Application Area, 2017�2024 (USD Million)
Table 94 Middle East and Africa: Market Size, By Deployment Mode, 2017�2024 (USD Million)
Table 95 Middle East and Africa: Market Size, By Organization Size, 2017�2024 (USD Million)
Table 96 Middle East and Africa: Market Size, By Vertical, 2017�2024 (USD Million)
Table 97 Latin America: Cognitive Collaboration Market Size, By Country, 2017�2024 (USD Million)
Table 98 Latin America: Market Size, By Component, 2017�2024 (USD Million)
Table 99 Latin America: Market Size, By Solution, 2017�2024 (USD Million)
Table 100 Latin America: Market Size, By Service, 2017�2024 (USD Million)
Table 101 Latin America: Market Size, By Application Area, 2017�2024 (USD Million)
Table 102 Latin America: Market Size, By Deployment Mode, 2017�2024 (USD Million)
Table 103 Latin America: Market Size, By Organization Size, 2017�2024 (USD Million)
Table 104 Latin America: Cognitive Collaboration Market Size, By Vertical, 2017�2024 (USD Million)
Table 105 Evaluation Criteria
Table 106 New Product Launches and Product Enhancements, 2018�2019
Table 107 Partnerships and Collaborations, 2018�2019
Table 108 Mergers and Acquisitions, 2019
List of Figures (29 Figures)
Figure 1 Global Cognitive Collaboration Market: Research Design
Figure 2 Research Methodology
Figure 3 Market Size Estimation Methodology: Bottom-Up and Top-Down Approaches
Figure 4 Services Segment to Grow at a Higher CAGR During the Forecast Period
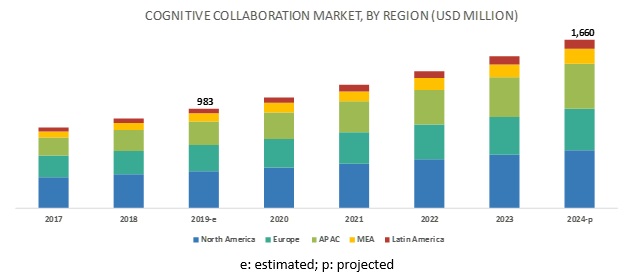
Figure 5 North America to Hold the Highest Market Share in 2019
Figure 6 Highest-Growing Segments of the Cognitive Collaboration Market During the Forecast Period
Figure 7 Growing use of AI Technologies With Other Digital Solutions to Drive the Growth of Cognitive Collaboration Market
Figure 8 Solutions Segment to Hold a Higher Market Share in 2019
Figure 9 Project Management Segment to Hold the Highest Market Share During the Forecast Period
Figure 10 Large Enterprises Segment to Hold a Higher Market Share During the Forecast Period
Figure 11 IT and Telecom Vertical to Hold the Highest Market Share During the Forecast Period
Figure 12 Drivers, Restraints, Opportunities, and Challenges: Cognitive Collaboration Market
Figure 13 Global Market Size of the Enterprise Collaboration Market
Figure 14 Services Segment to Grow at a Higher CAGR During the Forecast Period
Figure 15 Project Management Segment to Grow at the Highest CAGR During the Forecast Period
Figure 16 Managed Services Segment to Grow at a Higher CAGR During the Forecast Period
Figure 17 Social Media Assistantship Segment to Grow at the Highest CAGR During the Forecast Period
Figure 18 Cloud Deployment Mode to Grow at a Higher CAGR During the Forecast Period
Figure 19 Small and Medium-Sized Enterprises Segment to Grow at a Higher CAGR During the Forecast Period
Figure 20 IT and Telecom Vertical to Have the Largest Market Size During the Forecast Period
Figure 21 North America to Exhibit the Largest Market Size During the Forecast Period
Figure 22 North America Market Snapshot
Figure 23 Asia Pacific Market Snapshot
Figure 24 Cognitive Collaboration Market (Global), Competitive Leadership Mapping, 2018
Figure 25 Ranking of Key Players in the Market, 2018
Figure 26 Key Developments By the Leading Players in the Cognitive Collaboration Market During 2017�2019
Figure 27 Cisco: Company Snapshot
Figure 28 Microsoft: Company Snapshot
Figure 29 Slack Technologies: Company Snapshot
The study involved four major activities in estimating the current market size for the cognitive collaboration market. Exhaustive secondary research was done to collect information on the market. The next step was to validate these findings, assumptions, and sizing with industry experts across the value chain using primary research. Both top-down and bottom-up approaches were employed to estimate the total market size. After that, the market breakdown and data triangulation procedures were used to estimate the market size of the segments and sub-segments of the cognitive collaboration market.
Secondary research
In the secondary research process, various secondary sources, such as D&B Hoovers, Bloomberg BusinessWeek, and Factiva, have been referred to, to identify and collect information for this study. These secondary sources included annual reports, press releases and investor presentations of companies, whitepapers, certified publications and articles by recognized authors, gold standard and silver standard websites, regulatory bodies, trade directories, and databases.
Primary research
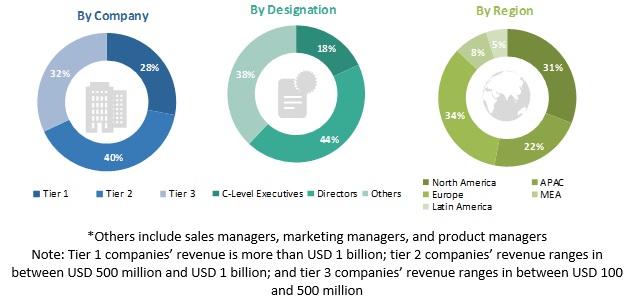
The cognitive collaboration market comprises several stakeholders, such as cognitive collaboration vendors, system integrators, resellers and distributors, research organizations, enterprise users, and startup companies. The demand-side of the market consists of enterprises across different industries, including BFSI, IT and telecom, energy and utilities, education retail and healthcare. The supply-side includes cognitive collaboration providers, offering cognitive collaboration solutions. Various primary sources from both the supply and demand sides of the market were interviewed to obtain qualitative and quantitative information. Following is the breakdown of the primary respondents:
To know about the assumptions considered for the study, download the pdf brochure
Market Size Estimation
Both top-down and bottom-up approaches were used to estimate and validate the total size of the cognitive collaboration market. These methods were also used extensively to determine the size of various subsegments in the market. The research methodology used to estimate the market size includes the following:
- The key players in the industry and markets have been identified through extensive secondary research.
- The industry�s supply chain and market size, in terms of value, have been determined through primary and secondary research processes.
- All percentage shares, splits, and breakdowns have been determined using secondary sources and verified through primary sources.
Data Triangulation
After arriving at the overall market size using the market size estimation processes as explained above, the market was split into several segments and subsegments. To complete the overall market engineering process and arrive at the exact statistics of each market segment and subsegment, the data triangulation, and market breakdown procedures were employed, wherever applicable. The data was triangulated by studying various factors and trends from both the demand and supply sides.
Report objectives
- To define, describe, and forecast the cognitive collaboration market service type, organization size, vertical, and region
- To provide detailed information about the major factors (drivers, restraints, opportunities, and industry-specific challenges) influencing the growth of the market
- To analyze the market with respect to individual growth trends, prospects, and contributions to the market
- To forecast the market size of 5 main regions, namely, North America, Europe, Asia Pacific (APAC), Middle East and Africa (MEA), and Latin America
- To analyze opportunities in the market for stakeholders by identifying the high-growth segments of the market
- To profile the key players in the market and comprehensively analyze their core competencies in each subsegment
- To analyze the competitive developments, such as agreements, partnerships, acquisitions, and product/solution launches, in the cognitive collaboration market
Available Customizations
With the given market data, MarketsandMarkets offers customizations as per the company�s specific needs. The following customization options are available for the report:
Product Analysis
- Product matrix gives a detailed comparison of the product portfolio of each company
Geographic Analysis
- Further breakup of the European market into the Spain, Sweden, Switzerland and Rest of Europe
- Further breakup of the APAC market into Singapore, Malaysia, and Rest of APAC
- Further breakup of the Latin American market into Uruguay, Colombia, and Rest of Latin America
Company Information
- Detailed analysis and profiling of additional market players


Growth opportunities and latent adjacency in Cognitive Collaboration Market