Food Allergen Testing Market by Source (Peanuts & Soy, Wheat, Milk, Eggs, Tree Nuts, Seafood), Technology (PCR-Based, Immunoassay-Based (Elisa)), Food Tested (Bakery & Confectionery, Infant Food), and Region - Global Forecast to 2022


The food allergen testing market, in terms of value, is projected to reach USD 760.7 million by 2022, at a CAGR of 6.8% from 2016. The market growth is driven by various factors such as stringent labeling mandates and demand for advisory labeling, growth in incidences of allergic disorders among consumers, globalization of food trade, and increase in food recall for undeclared allergen products.
The years considered for the study are as follows:
|
Report Metric |
Details |
|
Base year considered |
2015 |
|
Forecast Period |
2016 - 2022 |
The objectives of the food allergen testing market report
- To define, segment, and project the global market for food allergen testing
- To understand the structure of the market by identifying its various subsegments
- To provide detailed information about the key factors influencing the growth of the market (drivers, restraints, opportunities, and industry-specific challenges, and burning issues)
- To project the market size, in terms of value (USD million) and volume (million tests), of the segments, namely, source, food tested, technology, and region
- To project the size of the market and its submarkets, in terms of value, with respect to four regions (along with their respective key countries): North America, Europe, Asia-Pacific, and the Rest of the World (RoW)
- To strategically analyze micromarkets with respect to individual growth trends, future prospects, and their contribution to the total market
- To analyze the opportunities in the market for stakeholders and provide a competitive landscape of market trends
- To profile key players and comprehensively analyze their market share and core competencies
- To track and analyze competitive developments such as new product/service launches, expansions & investments, acquisitions, agreements, collaborations, partnerships, and new technology launches in the food allergen testing market
- To provide a detailed competitive landscape of this market, along with an analysis of the business and corporate strategies adopted by key players
Research Methodology:
- In the market engineering process, both “top-down” and “bottom-up” approaches were extensively used, along with several data triangulation methods, to carry out estimations and projections for the overall market and its subsegments, as listed in this report.
- Extensive qualitative and quantitative analysis was conducted on the complete process to list key information/insights throughout the report.
- Major regions were identified, along with countries contributing the maximum share.
- Secondary research was carried out to determine the number of undeclared allergen recall cases and incidences in regions such as North America, Europe, Asia-Pacific, and RoW; trends for food testing industry, and their contribution.
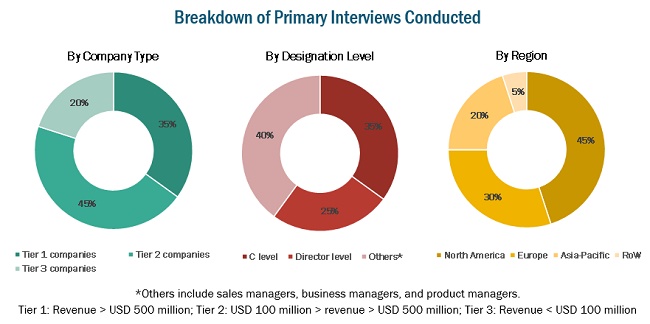
- The market research is carried out through secondary sources such as Codex Alimentarius Commission (CODEX), Centers for Disease Control and Prevention (CDC), The European Federation of National Associations of Measurement, Testing, and Analytical Laboratories (EUROLAB), and Food and Agriculture Organization (FAO), while their market share in respective regions have been determined through both, primary and secondary research. The research methodology includes the study of annual and financial reports of top market players, as well as interviews with industry experts (such as CEOs, VPs, directors, and marketing executives) for key insights (both, quantitative and qualitative) for the food allergen testing market.
"To know about assumptions considered for this research report, download the pdf brochure."
Target Audience:
The stakeholders for the report are as follows:
- Manufacturers, importers & exporters, traders, distributors, and suppliers of equipment, reagents, chemicals, and other related consumables
- Food allergen testing solutions providers
- Food allergen testing laboratories
- Food processors
- Food manufacturers
- Government and research organizations
- Trade associations and industry bodies
-
Regulatory bodies
- Food and Agriculture Organization (FAO)
- Food Safety Council (FSC)
- World Allergen Organization (WAO)
- Food Allergen and Allergen Risk Management (FAAM)
- Food Allergy Research & Education (FARE)
- The European Federation of National Associations of Measurement, Testing, Analytical Laboratories (EUROLAB)
- Raw material suppliers
Scope of the Report:
This research report categorizes the food allergen testing market based on source, food tested, technology, and region.
Based on source, the market has been segmented as follows:
- Peanut & soy
- Wheat
- Milk
- Egg
- Tree nuts
- Seafood
- Others (sulfites and other cereals)
Based on technology, the market has been segmented as follows:
- Polymerase chain reaction (PCR)
- Immunoassay-based /ELISA (Enzyme-linked immunosorbent assay)
- Others (LC-MC/MS, test kits, and other chromatographic equipment)
Based on food tested, the market has been segmented as follows:
- Bakery & confectionery
- Infant food
- Processed foods
- Dairy products & alternatives
- Seafood and meat products
- Others (savory items, sauce, and food additives)
Based on region, the market has been segmented as follows:
- North America
- Europe
- Asia-Pacific
- RoW (Brazil, Argentina, and South Africa)
Available Customizations for Food Allergen Testing Market
With the given market data, MarketsandMarkets offers customizations according to client-specific scientific needs.
The following customization options are available for the report:
Product Analysis
-
Product matrix, which gives a detailed comparison of the product portfolio of each company
Segmental Analysis
- Further breakdown of allergen sources in food tested
- Further breakdown of others segments in source and food tested
-
Further breakdown of countries in Rest of the World
Company Information
-
Detailed analysis and profiling of additional market players (up to five)
Allergic patients completely rely on the labeling of ingredients before purchasing the product, to gain information that will help them avoid any allergens. The Food Allergen Labelling and Consumer Protect Act (FALCPA) has mandated the declaration of eight major allergens on the food labels. Such labeling mandates are fueling the growth of this market.
Undeclared allergens in packaged foods cause serious health hazards for allergic consumers. The data on food recalls collected by various food safety organizations for undeclared allergens encourage the need for allergen testing in the food products before and after they are packed.
The market, based on type, has been segmented into peanut & soy, wheat, milk, egg, tree nuts, seafood, and others (which include sulfites and other cereals). The peanut & soy segment is estimated to dominate the mycotoxin market in 2016. Peanut allergy is common among all age groups. After peanut, soy is considered a major source of allergen, especially among children and infants.
The market, based on technology, is segmented into polymerase chain reaction (PCR)-based, immunoassay-based/ELISA (enzyme-linked immunosorbent assay) and others include LC-MC/MS, test kits, and other chromatographic technologies. The immunoassay-based/ELISA-based technology is projected to grow at the highest CAGR among all technologies from 2016 to 2022. The ELISA technique is based on the protein's characteristic of binding to specific enzyme-labeled antibodies. The simplicity of this method aids in its implementation and is beneficial for allergen testing in manufacturing plants at different stages of the value chain.
The food allergen testing market, based on food tested, is categorized into bakery & confectionery, infant food, processed food, dairy products & its alternatives, seafood & meat products, and others (which include savory items, sauce, and other additives). The processed food segment is projected to be the largest and the fastest-growing market in the market. These foods contain multiple allergens, out of which some are directly added (inheritably present in the raw material) while some are a result of cross-contamination. Snacks with spices are the most complicated to test for allergens, as they comprise multiple ingredients. This factor is fueling the market growth for allergen testing in processed food.
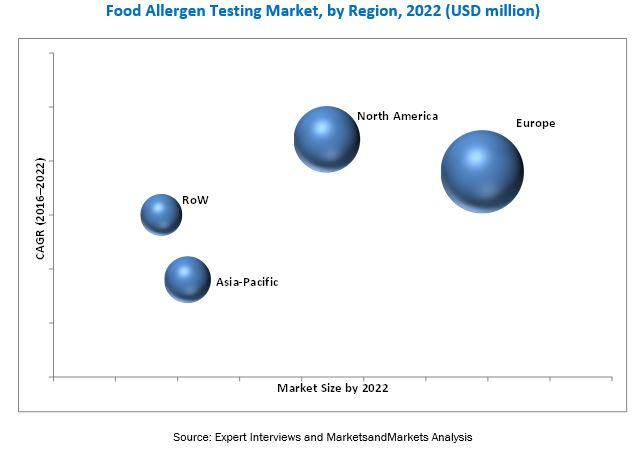
The food allergen testing market is estimated to be dominated by the European region in 2016. European countries have recorded many issues related to food allergens; as a result, stringent policies that have been established to achieve complete food safety. Though concerns regarding food allergens have been increasing, consumers are uninformed about such outbreaks. Public awareness has been gradually increasing in countries such as Germany, the U.K., France, and Italy. Peanut accounted for a majority of the allergies in the European region.
Manufacturers in a few regions lack the necessary awareness regarding food safety regulations; due to this, they do not perform in-house testing or outsource it to laboratories. This restrains the development of the allergen testing market.
New service/product launches, expansions & investments, acquisitions, agreements, collaborations, partnerships, and new technology launches are the key strategies adopted by the players to ensure their growth in the market. Companies such as SGS (Switzerland), Intertek (UK), TÜV SÜD (Germany), Eurofins E (Luxembourg), and ALS Limited (Australia) have acquired leading market positions through their broad service portfolios that are specific to various allergen segments. The companies are also focused on innovations and geographical diversification. In December 2015, SGS entered into a partnership with Biopremier (Portugal), a specialist in molecular biology and DNA sequencing. This partnership delivered new-generation sequencing (NGS) to the food supply chain, which helped in verifying food authenticity by reducing food frauds.
To speak to our analyst for a discussion on the above findings, please fill up the required details by clicking on the Speak to Analyst tab.
 Exclusive indicates content/data unique to MarketsandMarkets and not available with any competitors.
Table of Contents
1 Introduction (Page No. - 18)
1.1 Objectives of the Study
1.2 Market Definition
1.3 Study Scope
1.4 Periodization Considered for the Study
1.5 Currency Considered
1.6 Stakeholders
1.7 Limitations
2 Research Methodology (Page No. - 23)
2.1 Research Data
2.1.1 Secondary Data
2.1.1.1 Key Data From Secondary Sources
2.1.2 Primary Data
2.1.2.1 Key Data From Primary Sources
2.1.2.2 Breakdown of Primaries
2.1.2.3 Key Industry Insights
2.2 Market Size Estimation
2.3 Market Breakdown & Data Triangulation
2.4 Research Assumptions
3 Executive Summary (Page No. - 32)
4 Premium Insights (Page No. - 36) - Food Allergen Testing (FAT) Market
4.1 Opportunities in the Food Allergen Testing Market
4.2 FAT Market: Major Countries
4.3 FAT Market, By Source
4.4 FAT Market, By Technology
4.5 FAT Market, By Source & Region
4.6 FAT Market, By Food Tested & Region
5 Market Overview (Page No. - 41)
5.1 Introduction
5.2 Market Segmentation
5.2.1 Source
5.2.2 Technology
5.2.3 Food Tested
5.2.4 Region
5.3 Market Dynamics
5.3.1 Drivers
5.3.1.1 Labeling-Compliance to Drive Allergen Testing
5.3.1.1.1 Advisory Labeling
5.3.1.2 Growing Allergic Reactions Among Consumers
5.3.1.3 Consumer Complaints (Food Recalls)
5.3.1.4 Implementation of Stringent Food SAfety Regulations
5.3.1.4.1 HACCP & GMP Implemented the Most for Allergen Management
5.3.1.5 International Trade of Food Materials
5.3.2 Restraints
5.3.2.1 Lack of Food Control Infrastructure & Resources in Developing Countries
5.3.2.2 Lack of Awareness About Labeling Regulations
5.3.3 Opportunities
5.3.3.1 Technological Advancements in the Testing Industry
5.3.3.1.1 Multi-Allergen Screening System
5.3.4 Challenges
5.3.4.1 Technical Difficulties During Sampling, Testing, and Protein Identification
5.3.4.2 Lack of Standardization in Allergen Testing Practices
6 Food Allergen Testing Market, By Source (Page No. - 56)
6.1 Introduction
6.2 Peanut & Soy
6.3 Wheat
6.3.1 Gluten
6.4 Milk
6.5 Egg
6.6 Tree Nuts
6.7 Seafood
6.8 Others
7 Food Allergen Testing Market, By Technology (Page No. - 82)
7.1 Introduction
7.2 PCR (Polymerase Chain Reaction)-Based
7.3 Immunoassay Based/Elisa (Enzyme Linked Immunosorbent Assay)
7.4 Other Tests/Techniques
8 Food Allergen Testing Market, By Food Tested (Page No. - 88)
8.1 Introduction
8.2 Bakery & Confectionery
8.3 Infant Food
8.4 Processed Food
8.5 Dairy Products & Alternatives
8.6 Seafood & Meat Products
8.7 Other Foods
9 Food Allergen Testing Market, By Region (Page No. - 102)
9.1 Introduction
9.2 North America
9.2.1 U.S.
9.2.2 Canada
9.2.3 Mexico
9.3 Europe
9.3.1 Germany
9.3.2 France
9.3.3 U.K.
9.3.4 Italy
9.3.5 Poland
9.3.6 Rest of Europe
9.4 Asia-Pacific
9.4.1 China
9.4.2 Japan
9.4.3 India
9.4.4 Australia & New Zealand
9.4.5 Rest of Asia Pacific
9.5 Rest of the World (RoW)
9.5.1 Brazil
9.5.2 Argentina
9.5.3 South Africa
9.5.4 Others in RoW
10 Regulations for the Food Allergen Testing Market (Page No. - 135)
10.1 Introduction
10.2 International Bodies for Food Safety Standards and Regulations
10.2.1 Codex Alimentarius Commission (CAC)
10.3 Global Food Safety Initiative (GFSI)
10.4 North America
10.4.1 U.S. Food and Drug Administration (FDA)
10.4.1.1 Food Allergen Labeling and Consumer Protection Act
10.4.1.2 U.S. Department of Agriculture's Food Safety and Inspection Service (Fsis)
10.4.2 Canada
10.4.2.1 Health Canada Food Allergens Labeling
10.4.3 Mexico
10.5 Europe
10.5.1 European Union Regulations
10.5.2 European Food Information Council - Food Allergen Labeling
10.5.3 Germany
10.5.4 U.K.
10.6 Asia-Pacific
10.6.1 China
10.6.2 India
10.6.2.1 Food Safety Standards Amendment Regulations, 2012
10.6.2.2 Food Safety Standards Amendment Regulations, 2011
10.6.2.3 Food Safety and Standards Act, 2006
10.6.3 Australia & Nea Zealand
10.6.3.1 Food Standards Australia & New Zealand
10.6.4 Japan
10.7 RoW
10.7.1 Brazil
11 Competitive Landscape (Page No. - 144)
11.1 Overview
11.2 Key Market Strategies
11.3 Competitive Situations & Trends
11.3.1 Expansions & Investments
11.3.2 Acquisitions
11.3.3 Agreements, Collaborations, Partnerships, and New Technology Launches
11.3.4 New Service/Product Launches
12 Company Profiles (Page No. - 152)
(Business Overview, Service, Products Offered, Key Insights, Recent Developments, SWOT Analysis, MnM View)*
12.1 Introduction
12.2 SGS S.A.
12.3 Intertek Group PLC
12.4 TUV SUD PSB Pte. Ltd.
12.5 ALS Limited
12.6 Eurofins Scientific Se
12.7 Merieux Nutrisciences Corporation
12.8 Asurequality Ltd.
12.9 Microbac Laboratories, Inc.
12.10 Romer Labs Diagnostic GmbH
12.11 Symbio Laboratories
*Details on Business Overview, Products Offered, Services, Key Insights, Recent Developments, SWOT Analysis, MnM View Might Not Be Captured in Case of Unlisted Companies.
13 Appendix (Page No. - 182)
13.1 Discussion Guide
13.2 Knowledge Store: Marketsandmarkets’ Subscription Portal
13.3 More Company Developments
13.3.1 Acquisitions
13.3.2 Expansions & Investments
13.3.3 Agreements, Collaborations, Partnerships, and New Technology Launches
13.3.4 New Service/Products Launches
13.4 Introducing RT: Real Time Market Intelligence
13.5 Available Customizations
13.6 Related Reports
13.7 Author Details
List of Tables (125 Tables) - Food Allergen Testing (FAT) Market
Table 1 Causes of Food-Induced Anaphylaxis in Children, By Country
Table 2 Allergen Recalls, 2010–2015
Table 3 Recent Allergen Recalls in U.S. in 2015
Table 4 Food Allergen Testing Market Size, By Source, 2014–2022 (USD Million)
Table 5 Unexpected Sources of Peanut & Soy Allergy
Table 6 Peanut & Soy: Food Allergen Testing Market Size, By Region, 2014–2022 (USD Million)
Table 7 Peanut & Soy: North American FAT Market, By Country, 2014–2022 (USD Million)
Table 8 Peanut & Soy: European FAT Market, By Country, 2014–2022 (USD Million)
Table 9 Peanut &Soy: Asia-Pacific FAT Market, By Country, 2014–2022 (USD Million)
Table 10 Peanut & Soy: RoW FAT Market, By Country, 2014–2022 (USD Million)
Table 11 Unexpected Sources of Wheat Allergy
Table 12 Wheat: Market Size for Food Allergen Testing, By Region, 2014–2022 (USD Million)
Table 13 Wheat: North American FAT Market, By Country, 2014–2022 (USD Million)
Table 14 Wheat: European FAT Market, By Country, 2014–2022 (USD Million)
Table 15 Wheat: Asia-Pacific FAT Market, By Country, 2014–2022 (USD Million)
Table 16 Wheat: RoW FAT Market, By Country, 2014–2022 (USD Million)
Table 17 Unexpected Sources of Milk Allergy
Table 18 Milk: Food Allergen Testing Market Size, By Region, 2014–2022 (USD Million)
Table 19 Milk: North American FAT Market, By Country, 2014–2022 (USD Million)
Table 20 Milk: European FAT Market, By Country, 2014–2022 (USD Million)
Table 21 Milk: Asia-Pacific FAT Market, By Country, 2014–2022 (USD Million)
Table 22 Milk: RoW FAT Market, By Country, 2014–2022 (USD Million)
Table 23 Unexpected Sources of Egg Allergy
Table 24 Egg: Market Size for Food Allergen Testing, By Region, 2014–2022 (USD Million)
Table 25 Egg: North American FAT Market, By Country, 2014–2022 (USD Million)
Table 26 Egg: European FAT Market, By Country, 2014–2022 (USD Million)
Table 27 Egg: Asia-Pacific FAT Market, By Country, 2014–2022 (USD Million)
Table 28 Egg: RoW FAT Market, By Country, 2014–2022 (USD Million)
Table 29 Unexpected Sources of Tree Nuts
Table 30 Tree Nuts: Food Allergen Testing Market Size, By Region, 2014–2022 (USD Million)
Table 31 Tree Nuts: North American FAT Market, By Country, 2014–2022 (USD Million)
Table 32 Tree Nuts: European FAT Market, By Country, 2014–2022 (USD Million)
Table 33 Tree Nuts: Asia-Pacific FAT Market, By Country, 2014–2022 (USD Million)
Table 34 Tree Nuts: RoW FAT Market, By Country, 2014–2022 (USD Million)
Table 35 Unexpected Sources of Seafood Allergy
Table 36 Seafood: Market Size for Food Allergen Testing, By Region, 2014–2022 (USD Million)
Table 37 Seafood: North American FAT Market, By Country, 2014–2022 (USD Million)
Table 38 Seafood: European FAT Market, By Country, 2014–2022 (USD Million)
Table 39 Seafood: Asia-Pacific FAT Market, By Country, 2014–2022 (USD Million)
Table 40 Seafood: RoW FAT Market, By Country, 2014–2022 (USD Million)
Table 41 Unexpected Sources of Other Allergens
Table 42 Others: Food Allergen Testing Market Size, By Region, 2014–2022 (USD Million)
Table 43 Others: North American FAT Market, By Country, 2014–2022 (USD Million)
Table 44 Others: European FAT Market, By Country, 2014–2022 (USD Million)
Table 45 Others: Asia-Pacific FAT Market, By Country, 2014–2022 (USD Million)
Table 46 Others: RoW FAT Market, By Country, 2014–2022 (USD Million)
Table 47 FAT Market Size, By Technology, 2014-2022 (USD Million)
Table 48 PCR-Based Food Allergen Testing Market Size, By Region, 2014-2022 (USD Million)
Table 49 Immunoassay (Elisa)-Based FAT Market Size, By Region, 2014-2022 (USD Million)
Table 50 Other Tests in Food Allergen Testing Market Size, By Region, 2014-2022 (USD Million)
Table 51 Market Size for Food Allergen Testing, By Food Tested, 2014–2022 (USD Million)
Table 52 Bakery & Confectionery: Major Allergens & Adverse Reactions
Table 53 Bakery & Confectionery Market Size, By Region, 2014–2022 (USD Million)
Table 54 Infant Food: Major Allergens & Adverse Reactions
Table 55 Infant Food Market Size, By Region, 2014–2022 (USD Million)
Table 56 Processed Food: Major Allergens & Adverse Reactions
Table 57 Processed Food Market Size, By Region, 2014–2022 (USD Million)
Table 58 Dairy Products & Alternatives: Major Allergens & Adverse Reactions
Table 59 Dairy Product & Alternatives Market Size, By Region, 2014–2022 (USD Million)
Table 60 Seafood & Meat Products: Major Allergens & Adverse Reactions
Table 61 Seafood & Meat Product Market Size, By Region, 2014–2022 (USD Million)
Table 62 Other Foods Market Size, By Region, 2014–2022 (USD Million)
Table 63 Food Allergen Testing Market, By Region, 2014–2022 (USD Million)
Table 64 North America: Food Allergen Testing Market, By Country, 2014–2022 (USD Million)
Table 65 North America: FAT Market, By Source, 2014–2022 (USD Million)
Table 66 North America: Food Allergen Testing, By Food Tested, 2014–2022 (USD Million)
Table 67 North America: Food Allergen Testing, By Technology, 2014–2022 (USD Million)
Table 68 U.S.: Food Allergen Testing Market, By Source, 2014–2022 (USD Million)
Table 69 Canada: FAT Market, By Source, 2014–2022 (USD Million)
Table 70 Mexico: FAT Market, By Source, 2014–2022 (USD Million)
Table 71 Europe: Market Size for Food Allergen Testing, By Country, 2014–2022 (USD Million)
Table 72 Europe: FAT Market Size, By Source, 2014–2022 (USD Million)
Table 73 Europe: FAT Market Size, By Food Tested, 2014–2022 (USD Million)
Table 74 Europe: FAT Market Size, By Technology, 2014–2022 (USD Million)
Table 75 Germany: FAT Market Size, By Source, 2014–2022 (USD Million)
Table 76 France: FAT Market Size, By Source, 2014–2022 (USD Million)
Table 77 U.K.: FAT Market Size, By Source, 2014–2022 (USD Million)
Table 78 Italy: FAT Market, By Source, 2014–2022 (USD Million)
Table 79 Poland: FAT Market, By Source, 2014–2022 (USD Million)
Table 80 Rest of Europe: Food Allergen Testing Market, By Type, 2014–2022 (USD Million)
Table 81 Asia-Pacific: Market Size for Food Allergen Testing, By Country, 2014-2022 (USD Million)
Table 82 Asia-Pacific: FAT Market Size, By Source, 2014-2022 (USD Million)
Table 83 Asia-Pacific Food Allergen Testing, By Food Tested, 2014-2022 (USD Million)
Table 84 Asia-Pacific Food Allergen Testing, By Technology, 2014-2022 (USD Million)
Table 85 China: FAT Market Size, By Source, 2014-2022 (USD Million)
Table 86 Japan: FAT Market Size, By Source, 2014 - 2022 (USD Million)
Table 87 India: FAT Market Size, By Source, 2014 - 2022 (USD Million)
Table 88 Australia & New Zealand: Food Allergen Testing Market Size, By Source, 2014-2022 (USD Million)
Table 89 Rest of Asia-Pacific: FAT Market Size, By Source, 2014-2022 (USD Million)
Table 90 RoW: Food Allergen Testing Market, By Country, 2014–2022 (USD Million)
Table 91 RoW: FAT Market, By Source, 2014–2022 (USD Million)
Table 92 RoW: FAT Market, By Food Tested, 2014–2022 (USD Million)
Table 93 RoW: FAT Market, By Technology, 2014–2022 (USD Million)
Table 94 Brazil: FAT Market, By Source, 2014–2022 (USD Million)
Table 95 Argentina: FAT Market, By Source, 2014–2022 (USD Million)
Table 96 South Africa: FAT Market, By Source, 2014–2022 (USD Million)
Table 97 Others in RoW: Food Allergen Testing Market, By Source, 2014–2022 (USD Million)
Table 98 Expansions & Investments, 2011–2016
Table 99 Acquisitions, 2011–2016
Table 100 Agreements, Collaborations, Partnerships, and New Technology Launches, 2011–2016
Table 101 New Services/Product Launches, 2011–2016
Table 102 SGS S.A. : Services Offered
Table 103 SGS S.A. : Recent Developments
Table 104 Intertek Group PLC: Services Offered
Table 105 Intertek Group PLC. : Recent Developments
Table 106 TUV SUD PSB Pte. Ltd. : Services Offered
Table 107 TUV SUD PSB Pte. Ltd.: Recent Developments
Table 108 ALS Limited: Services Offered
Table 109 ALS Limited: Recent Developments
Table 110 Eurofins Scientific: Services Offered
Table 111 Eurofins Scientific: Recent Developments
Table 112 Merieux Nutrisciences Corporation : Services Offered
Table 113 Merieux Nutrisciences Corporation : Recent Developments
Table 114 Asurequality Limited: Services Offered
Table 115 Asurequality Limited: Recent Developments
Table 116 Microbac Laboratories, Inc.: Services Offered
Table 117 Microbac Laboratories, Inc.: Recent Developments
Table 118 Romer Labs Diagnostic GmbH: Services Offered
Table 119 Romer Labs Diagnostic GmbH: Recent Developments
Table 120 Symbio Laboratories : Services Offered
Table 121 Symbio Laboratories : Recent Developments
Table 122 Acquisitions, 2011–2016
Table 123 Expansions & Investments, 2011–2016
Table 124 Agreements, Collaborations, Partnerships, and New Technology Launches, 2011–2016
Table 125 New Service/Product Launches, 2010–2016
List of Figures (53 figures)
Figure 1 Market Segmentation
Figure 2 FAT Market: Research Design
Figure 3 Market Size Estimation Methodology: Bottom-Up Approach
Figure 4 Market Size Estimation Methodology: Top-Down Approach
Figure 5 Data Triangulation
Figure 6 Food Allergen Testing Market Size, 2016 vs 2022 (USD Million)
Figure 7 FAT Market Snapshot, By Type, 2016 vs 2022
Figure 8 FAT Market Size, By Technology, 2016–2022
Figure 9 FAT Market Size, By Food Tested, 2016–2022 (USD Million)
Figure 10 Food Allergen Testing Market Share (Value), By Region, 2015
Figure 11 Growing Allergic Reactions Among Consumers Drive the Growth of the Market
Figure 12 U.S. is Projected to Be the Fastest-Growing Market During the Forecast Period
Figure 13 Peanut & Soy Segment is Projected to Dominate the European Food Allergen Testing Market Through 2022
Figure 14 Immunoassay-Based Technology is Projected to Dominate the Food Allergen Testing Market By 2022
Figure 15 Peanut & Soy Segment Accounted for Largest Market, 2015
Figure 16 Processed Food Segment is Projected to Be Largest Market, 2016–2022
Figure 17 Key Areas of Consideration for Allergen Management in A Supply Chain
Figure 18 Market, By Source
Figure 19 FAT Market, By Technology
Figure 20 FAT Market, By Food Tested
Figure 21 FAT Market Snapshot, By Region
Figure 22 Market Dynamics
Figure 23 Proper Labeling to Minimize Allergen Cross-Contact & Unintentional Contamination
Figure 24 ‘May Contain’ in Advisory Labeling Was Preferred the Most By Consumers
Figure 25 Food Allergy Prevalence in 2013 Among Children of All Ages (0-18 Years)
Figure 26 HACCP & GMP are the Most Productive Systems for Allergen Management
Figure 27 Market Size for Food Allergen Testing, By Source, 2016 vs 2022 (USD Million)
Figure 28 Peanut & Soy: Food Allergen Testing Market Size, By Region, 2016 vs 2022 (USD Million)
Figure 29 Advancements in Immunoassay (Elisa) Technology Drives the Food Allergen Testing Market Growth
Figure 30 Continuously Changing Stringent Food Allergen Labeling Regulations are Driving the European Food Allergen Testing Market Growth
Figure 31 FAT Market, By Food Tested
Figure 32 FAT Market Size, By Food Tested, 2016–2022 (USD Million)
Figure 33 Processed Food Allergen Testing Market Size, By Region, 2016–2022 (USD Million)
Figure 34 The U.S. Held the Largest Share in the Global Market, 2015
Figure 35 North American Market Snapshot
Figure 36 European Market Snapshot: U.K. to Command the Largest Share in the Food Allergen Testing Market
Figure 37 Food Avoided Due to Allergies Among Populations of Age Above 2 Years
Figure 38 Acquisitions and Expansions & Investments: Leading Approach of Key Companies
Figure 39 Market Developments, By Growth Strategy, 2011–2016
Figure 40 FAT Market Growth Strategies, By Company, 2011–2016
Figure 41 Geographic Revenue Mix of Top Five Market Players
Figure 42 SGS SA: Company Snapshot
Figure 43 SGS S.A.: SWOT Analysis
Figure 44 Intertek Group PLC: Company Snapshot
Figure 45 Intertek Group PLC: SWOT Analysis
Figure 46 TUV SUD PSB Pte. Ltd. : Company Snapshot
Figure 47 TUV SUD PSB Pte. Ltd.: SWOT Analysis
Figure 48 ALS Limited: Company Snapshot
Figure 49 ALS Limited: SWOT Analysis
Figure 50 Eurofins Scientific Se: Company Snapshot
Figure 51 Eurofins Scientific Se: SWOT Analysis
Figure 52 Merieux Nutrisciences Corporation : SWOT Analysis
Figure 53 Asurequality Limited: Company Snapshot


Growth opportunities and latent adjacency in Food Allergen Testing Market