Intelligent Virtual Assistant Market by Product (Chatbots, IVA smart speakers), User Interface (Text-based, Text-to-speech based, Automatic Speech Recognition), Industry (Consumer Electronics, BFSI, Retail), and Geography - Global Forecast to 2023


[141 Pages Report] The intelligent virtual assistants market (IVA) valued USD 1.36 billion in 2016 and is expected to be USD 17.72 billion by 2023 at a CAGR of 38.82% between 2017 and 2023. The report aims at estimating the market size and future growth potential of the IVA market based on product, user interface, type, industry and geographic analysis. The report also aims at providing detailed information regarding the major factors influencing the growth of the IVA market (drivers, restraints, opportunities, and industry-specific challenges) and strategically analyzes micro-markets with respect to the individual growth trends, future prospects, and contributions to the total market. The base year considered for the study is 2016 and the market is forecasted from 2017 to 2023.
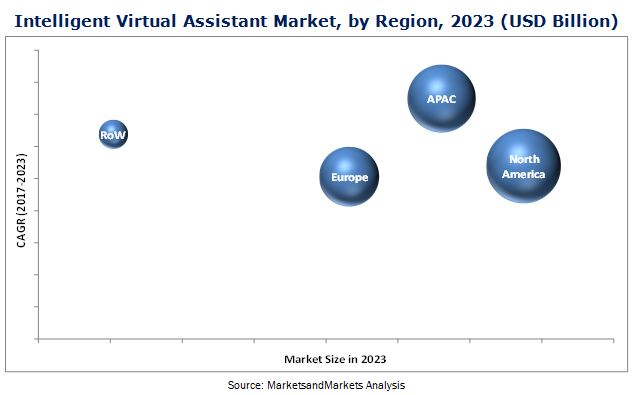
The global intelligent virtual assistants (IVA) market is expected to grow from USD 2.48 billion in 2017 to USD 17.72 billion by 2023 at a CAGR of 38.82% between 2017 and 2023. The market is expected to be driven by the demand of automation in providing the customers uninterrupted customer support services. Similarly, the demand of IVA smart speakers is mainly due to its adoption in smart home systems such as wireless connected thermostats, music players, air-conditioners and others.
Consumer electronics, BFSI, healthcare, education, retail, government, utilities, travel and hospitality and others are key application areas of IVA. The consumer electronics sector was the largest application area followed by BFSI in 2016. Consumer Electronics is expected to provide the highest growth potential for IVA during the forecast period attributed to the potential demand of IVAs in home automation systems.
IVA smart speakers are expected to grow at the highest CAGR between 2017 and 2023. This growth is mainly because of the increasing adoption of home automation systems especially in North America and Europe. Chatbots hold the highest share in this market due to its early commercialization.
The Automatic speech Recognition held the largest share in this market and are expected to grow at a very high rate between 2017 and 2023 due to its deployment in smart speakers. As of July 2017, smart speakers only take the input through ASR. These smart speakers are expected to witness high growth in North America and Europe because of the increase in the usage of smart home devices.
The conversational AI based IVAs accounted for the highest share in 2016. This is mainly because AI based IVAs have the ability to learn by itself with the help of deep learning, NLP, and neural networks. Rule-based IVAs can answer basic and limited types of queries.
The intelligent virtual assistants market in North America has accounted for the highest share in this market due to high technological adoption of IVAs in industries such as consumer electronics, BFSI, healthcare, education, retail, government, utilities, travel and hospitality and others. APAC is expected to grow at the highest rate than other regions over 2017 to 2023 due to the presence of emerging economies in this region such as China, and India. These economies are adopting chatbots for providing uninterrupted customer support services in order to serve its large population.
Source: MarketsandMarkets Analysis
The report analyzes the drivers which includes the demand of automation in customer services and the adoption of speaker based virtual assistants in smart home appliances. Some of the major players in this market are Alphabet (US), Amazon (US), Apple (US), Nuance Communications (US), IBM (US), Microsoft (US), Samsung Electronics (South Korea), Inbenta Technologies (US), Baidu (China), Blackberry (US).
 Exclusive indicates content/data unique to MarketsandMarkets and not available with any competitors.
Table of Contents
1 Introduction (Page No. - 12)
1.1 Objectives of the Study
1.2 Definition
1.3 Markets Covered
1.3.1 Market Segmentation
1.3.2 Years Considered for the Study
1.4 Currency
1.5 Limitations
1.6 Stakeholders
2 Research Methodology (Page No. - 15)
2.1 Research Data
2.1.1 Secondary Data
2.1.1.1 List of Major Secondary Sources
2.1.1.2 Secondary Sources
2.1.2 Primary Data
2.1.2.1 Primary Interviews With Experts
2.1.2.2 Breakdown of Primaries
2.1.2.3 Primary Sources
2.2 Secondary and Primary Research
2.2.1.1 Key Industry Insights
2.3 Market Size Estimation
2.3.1 Bottom-Up Approach
2.3.2 Top-Down Approach
2.4 Market Breakdown and Data Triangulation
2.5 Research Assumptions
3 Executive Summary (Page No. - 25)
4 Premium Insights (Page No. - 29)
4.1 Attractive Opportunities in the Intelligent Virtual Assistants Market
4.2 North America: Intelligent Virtual Assistant Market, By Industry and Country
4.3 Intelligent Virtual Assistants Market, By Type
4.4 Intelligent Virtual Assistants Market, By Product
4.5 Intelligent Virtual Assistants Market, By Geography
5 Market Overview (Page No. - 32)
5.1 Introduction
5.2 Evolution of the Market: Intelligent Virtual Assistant Market
5.3 Market Dynamics
5.3.1 Drivers
5.3.1.1 Demand for Automation in Customer Service
5.3.1.2 Integration of Speaker-Based Virtual Assistants and Smart Home Appliances is Driving the Market of Smart Speakers
5.3.1.3 Increasing Adoption of Chatbots Because of the Availability of Low-Cost Software Modules for Chatbot Design
5.3.2 Restraints
5.3.2.1 Lack of Accuracy in Chatbot
5.3.2.2 System Integration Complexities Add to the Cost of Smart Speakers
5.3.3 Opportunities
5.3.3.1 Gesture Recognition Technology Will Add Value to Intelligent Virtual Assistants Market
5.3.3.2 Multi-Language Support in IVAs Will Increase Its Intelligent Virtual Assistant Market Penetration.
5.3.4 Challenges
5.3.4.1 Lack of Awareness in Developing Countries
5.3.4.2 Limited Market Reach of IVA Smart Speakers in Developing Countries.
6 Industry Trends (Page No. - 37)
6.1 Introduction
6.2 Value Chain Analysis
6.3 Startup Scenario
7 Intelligent Virtual Assistant Market, By Product (Page No. - 39)
7.1 Introduction
7.2 Chatbot
7.2.1 Chatbot Market By Deployment
7.2.1.1 Stand-Alone
7.2.1.2 Web-Based
7.2.2 Chatbot Market By Offering
7.2.2.1 Software
7.2.2.2 Services
7.3 Intelligent Virtual Assistants Market : Smart Speakers
8 Intelligent Virtual Assistant Market, By User Interface (Page No. - 51)
8.1 Introduction
8.2 Text Based
8.3 Text-To-Speech-Based
8.4 Automatic Speech Recognition (ASR)
8.5 Others
9 Intelligent Virtual Assistant Market, By Type (Page No. - 58)
9.1 Introduction
9.2 Rule-Based
9.3 Conversational Ai-Based
10 Intelligent Virtual Assistant Market, By Industry (Page No. - 62)
10.1 Introduction
10.2 Consumer Electronics
10.3 BFSI
10.4 Healthcare
10.5 Education
10.6 Retail
10.7 Government
10.8 Utilities
10.9 Travel & Hospitality
10.10 Others
11 Geographic Analysis (Page No. - 73)
11.1 Introduction
11.2 North America
11.2.1 US
11.2.2 Canada
11.2.3 Mexico
11.3 Europe
11.3.1 Germany
11.3.2 France
11.3.3 UK
11.3.4 Rest of Europe
11.4 Asia Pacific
11.4.1 Japan
11.4.2 China
11.4.3 Australia
11.4.4 India
11.4.5 Rest of APAC
11.5 RoW
11.5.1 Middle East and Africa
11.5.2 South America
12 Competitive Landscape (Page No. - 95)
12.1 Overview
12.2 Market Ranking Analysis, 2016
12.3 Competitive Scenario and Trends
12.3.1 Product Launches
12.3.2 Acquisitions
12.3.3 Partnerships/Collaborations/Agreements
13 Company Profiles (Page No. - 101)
(Business Overview, Strength of Product Portfolio, Business Strategy Excellence, Recent Developments, Key Relationships)*
13.1 Microsoft
13.2 Nuance Communications
13.3 Samsung Electronics
13.4 Alphabet
13.5 Apple
13.6 Amazon
13.7 International Business Machines (IBM)
13.8 Baidu
13.9 Blackberry
13.10 Inbenta Technologies
13.11 Innovators
13.11.1 Facebook
13.11.2 Cognitive Code
13.11.3 Artificial Solutions
13.11.4 Unified Computer Intelligence
13.11.5 Mycroft Ai
*Details on Business Overview, Strength of Product Portfolio, Business Strategy Excellence, Recent Developments, Key Relationships Might Not Be Captured in Case of Unlisted Companies.
14 Appendix (Page No. - 131)
14.1 Insights From Industry Experts
14.2 Discussion Guide
14.3 Knowledge Store: Marketsandmarkets’ Subscription Portal
14.4 Introducing RT: Real-Time Market Intelligence
14.5 Available Customizations
14.6 Related Reports
14.7 Author Details
List of Tables (68 Tables)
Table 1 Currency Table
Table 2 Start-Up Companies and Investors Scenario
Table 3 Intelligent Virtual Assistants Market, By Product, 2014–2023 (USD Million)
Table 4 Intelligent Virtual Assistant Market, By Deployment, 2014–2023 (USD Million)
Table 5 Chatbot Market, By Offering, 2014–2023 (USD Million)
Table 6 Chatbot Market in North America, By Offering, 2014–2023 (USD Million)
Table 7 Chatbots Market in Europe, By Offering, 2014–2023 (USD Million)
Table 8 Intelligent Virtual Assistant Market in APAC, By Offering, 2014–2023 (USD Million)
Table 9 Chatbots Market in RoW, By Offering, 2014–2023 (USD Million)
Table 10 Chatbot Market in North America By Type, 2014–2023 (USD Million)
Table 11 Chatbots Market in Europe By Type, 2014–2023 (USD Million)
Table 12 Chatbots Market in APAC By Type, 2014–2023 (USD Million)
Table 13 Chatbots Market in RoW, By Type, 2014–2023 (USD Million)
Table 14 Stand-Alone Chatbot Market, By Geography, 2014–2023 (USD Million)
Table 15 Web-Based Chatbot Market, By Geography, 2014–2023 (USD Million)
Table 16 Chatbots Software Market, By Geography, 2014–2023 (USD Million)
Table 17 Chatbot Services Market, By Geography, 2014–2023 (USD Million)
Table 18 Intelligent Virtual Assistants Market of Smart Speakers Market, By Geography, 2014–2023 (USD Million)
Table 19 IVA Smart Speakers Market By Type 2014–2023 (USD Million)
Table 20 IVA Market By User Interface, 2014–2023 (USD Million)
Table 21 IVA Smart Speakers Market By User Interface, 2014–2023 (USD Million)
Table 22 Chatbot Market By User Interface, 2014–2023 (USD Million)
Table 23 IVA Market for Text-Based User Interface By Region, 2014–2023 (USD Million)
Table 24 Intelligent Virtual Assistant Market for Text-To-Speech Based User Interface By Region, 2014–2023 (USD Million)
Table 25 Automatic Speech Recognition Based Intelligent Virtual Assistant Market, By Region, 2014–2023 (USD Million)
Table 26 Intelligent Virtual Assistant Market for Other Types of User Interface By Region, 2014–2023 (USD Million),
Table 27 Intelligent Virtual Assistants Market By Type, 2014–2023 (USD Million)
Table 28 Rule-Based IVA Market, By Region, 2014–2023 (USD Million)
Table 29 Conversational Ai-Based Market, By Region, 2014–2023 (USD Million)
Table 30 IVA Market, By Industry, 2014–2023 (USD Million)
Table 31 IVA Market for Consumer Electronics, By Region, 2014–2023 (USD Million)
Table 32 IVA Market of Smart Speakers, 2014–2023 (Million Units)
Table 33 IVA Market for BFSI, By Region, 2014–2023 (USD Million)
Table 34 IVA Market for Healthcare, By Region, 2014–2023 (USD Million)
Table 35 IVA Market for Education, By Region, 2014–2023 (USD Million)
Table 36 IVA Market for Retail, By Region, 2014–2023 (USD Million)
Table 37 IVA Market for Government, By Region, 2014–2023 (USD Million)
Table 38 Intelligent Virtual Assistants Market for Utilities, By Region, 2014–2023 (USD Million)
Table 39 Intelligent Virtual Assistant Market for Travel and Hospitality, By Region, 2014–2023 (USD Million)
Table 40 IVA Market for Other Industries, By Region, 2014–2023 (USD Million)
Table 41 IVA Market Size, By Region, 2014–2023 (USD Million)
Table 42 Chatbots Market, By Region, 2014–2023 (USD Million)
Table 43 IVA Smart Speaker Market By Region, 2014–2023 (USD Million)
Table 44 Intelligent Virtual Assistant Market for Smart Speakers By Region, 2014–2023 (Million Units)
Table 45 North America IVA Market Size, By Country, 2014–2023 (USD Million)
Table 46 Intelligent Virtual Assistants Market in North America, By Industry, 2014–2023 (USD Million)
Table 47 Chatbots Market in North America, By User Interface, 2014–2023 (USD Million)
Table 48 Chatbot Market in North America, By Deployment, 2014–2023 (USD Million)
Table 49 Chatbot Market in North America, By Offering, 2014–2023 (USD Million)
Table 50 Intelligent Virtual Assistant Market in Europe, By Country, 2014–2023 (USD Million)
Table 51 Intelligent Virtual Assistant Market in Europe, By Industry, 2014–2023 (USD Million)
Table 52 Chatbot Market in Europe, By User Interface, 2014–2023 (USD Million)
Table 53 Chatbot Market in Europe, By Deployment, 2014–2023 (USD Million)
Table 54 Chatbot Market in Europe, By Offering, 2014–2023 (USD Million)
Table 55 Intelligent Virtual Assistants Market in Asia Pacific, By Country, 2014–2023 (USD Million)
Table 56 Intelligent Virtual Assistant Market in Asia Pacific, By Industry, 2014–2023 (USD Million)
Table 57 Chatbot Market in Asia Pacific, By User Interface, 2014–2023 (USD Million)
Table 58 Chatbot Market in Asia Pacific, By Deployment, 2014–2023 (USD Million)
Table 59 Chatbot Market in Asia Pacific, By Offering, 2014–2023 (USD Million)
Table 60 IVA Market in RoW, By Region, 2014–2023 (USD Million)
Table 61 Intelligent Virtual Assistant Market in RoW, By Industry, 2014–2023 (USD Million)
Table 62 RoW Chatbot Market, By User Interface, 2014–2023 (USD Million)
Table 63 RoW Chatbot Market, By Deployment, 2014–2023 (USD Million)
Table 64 RoW Chatbot Market, By Offering 2014–2023 (USD Million)
Table 65 Ranking of the Key Players in the Intelligent Virtual Assistants Market 2016.
Table 66 Product Launches, 2015–2017
Table 67 Acquisitions, 2015–2017
Table 68 Partnerships/Collaborations/Agreements, 2014
List of Figures (54 Figures)
Figure 1 Intelligent Virtual Assistant Market: Research Design
Figure 2 Bottom-Up Approach
Figure 3 Top-Down Approach
Figure 4 Data Triangulation
Figure 5 Intelligent Virtual Assistants Market, 2014-2023
Figure 6 Intelligent Virtual Assistant Market for Smart Speakers is Expected to Grow at A Higher Rate Between 2014–2023
Figure 7 Automatic Speech Recognition Expected to Account for the Largest Share During the Forecast Period
Figure 8 Conversational Ai-Based IVA Accounted for A Higher Market Size in 2016
Figure 9 Consumer Electronics Accounted for the Largest Share of the Overall Intelligent Virtual Assistants Market in 2016
Figure 10 Intelligent Virtual Assistant Market , By Geography, 2016
Figure 11 Usage of IVA in Enterprises for Customer Support Services Propels the Growth of the Intelligent Virtual Assistant Market
Figure 12 Consumer Electronics Sector Held the Largest Share of the North American Intelligent Virtual Assistant Marketin 2016
Figure 13 Conversational Ai-Based IVA Held the Largest Share of the Intelligent Virtual Assistant Market in 2016
Figure 14 Chatbot Accounted for Larger Market Share in the Year 2016
Figure 15 The Intelligent Virtual Assistants Market in China is Expected to Grow at the Highest CAGR Between 2017 and 2023
Figure 16 Evolution of Intelligent Virtual Assistants
Figure 17 Growing Demand for Automation in Industries & Enterprises is Driving the IVA Market
Figure 18 Value Chain Analysis of Intelligent Virtual Assistant Market
Figure 19 Intelligent Virtual Assistant Market, By Product
Figure 20 Software-Based IVA is Expected to Dominate the Overall IVA Market By 2023
Figure 21 Software-Based Chatbot Market in APAC is Expected to Dominate Till 2023
Figure 22 Intelligent Virtual Assistants Market of Conversational Ai-Based IVA Will Have A Higher Share in APAC During the Forecast Period
Figure 23 North America is Expected to Continue Its Dominance in the Web Based Chatbots Market During the Forecast Period
Figure 24 APAC IVA Smart Speaker Market is Expected to Grow at A Highest CAGR Between 2017 and 2023
Figure 25 Intelligent Virtual Assistant Market, By User Interface
Figure 26 Text-Based Chatbots are Expected to Continue Its Dominance in the Chatbot Market During the Forecast Period
Figure 27 Automatic Speech Recognition Based Intelligent Virtual Assistants Market, 2014–2023
Figure 28 Intelligent Virtual Assistant Market, By Type
Figure 29 Conversational Ai-Based Market, By Geography, 2014–2023 (USD Million)
Figure 30 Intelligent Virtual Assistant Market, By Industry
Figure 31 IVA Smart Speakers Market, 2014–2023 (Million Units)
Figure 32 Intelligent Virtual Assistants Market for BFSI, By Geography, 2014–2023 (USD Million)
Figure 33 Intelligent Virtual Assistant Market for Government, By Geography, 2014–2023 (USD Million)
Figure 34 IVA Market in Travel and Hospitality, 2014–2023 (USD Million)
Figure 35 Regional Snapshot: Asia Pacific is the Emerging Region in the Intelligent Virtual Assistants Market
Figure 36 Snapshot: Presence of Key IVA Vendors is A Major Factor Contributing Toward the Growth of the Intelligent Virtual Assistant Market in North America
Figure 37 Software-Based IVA is Expected to Grow at A Higher Rate Between 2017 and 2023
Figure 38 Snapshot: Increasing Adoption of Chatbots in the Healthcare Sector is Driving the Growth of the Intelligent Virtual Assistants Market in Europe
Figure 39 Text-Based IVA Held the Highest Share of the European Market in By 2023
Figure 40 Snapshot: Technological Advancement is Contributing Toward the Growth of the Intelligent Virtual Assistant Market in APAC
Figure 41 Software-Based IVA is Expected to Hold A Higher Share of the Chatbot Market By 2023
Figure 42 South America is Expected to Hold A Major Share of the Intelligent Virtual Assistants Market in RoW By 2023
Figure 43 Companies Adopted Product Launch as the Key Growth Strategy Between 2014–2017
Figure 44 Market Evaluation Framework–Product Launches Fuelled Growth and Innovation Between 2014 and 2016
Figure 45 Battle for Market Share: Product Launch Was the Key Strategy
Figure 46 Microsoft: Company Snapshot
Figure 47 Nuance Communications: Company Snapshot
Figure 48 Samsung Electronics: Company Snapshot
Figure 49 Alphabet: Company Snapshot
Figure 50 Apple: Company Snapshot
Figure 51 Amazon: Company Snapshot
Figure 52 International Business Machines (IBM): Company Snapshot
Figure 53 Baidu: Company Snapshot
Figure 54 Blackberry: Company Snapshot
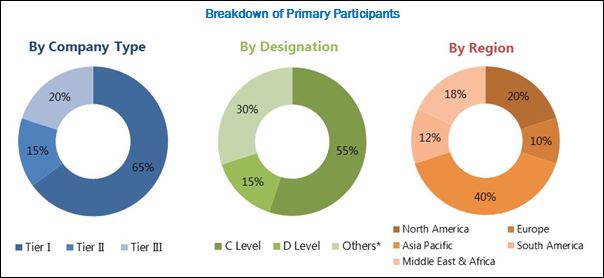
The research methodology used to estimate and forecast the intelligent virtual assistants market begins with capturing data on key vendor revenues through the secondary research that include annual reports, press releases, investor presentations, white papers, journals, certified publications, articles from recognized authors, gold standard and silver standard websites, organizations, directories, and databases, which include Factiva, Hoovers, and the Wall Street Journals among others. The vendor offerings are also taken into consideration to determine the market segmentation. The bottom-up procedure was employed to arrive at the overall market size of the global intelligent virtual assistants market from the revenue of the key players in the market. After arriving at the overall market size, the total market was split into several segments and sub-segments which were then verified through the primary research by conducting extensive interviews with people holding key positions such as CEOs, VPs, directors and executives. Market breakdown and data triangulation procedures were employed to complete the overall market engineering process and arrive at the exact statistics for all segments and sub-segments. The breakdown of primaries is depicted in the below figure:
To know about the assumptions considered for the study, download the pdf brochure
Target Audience of the Report:
The intended audience for this report includes:
- IVA module designers and manufacturers
- Research organizations and consulting companies
- Associations, forums, and alliances related to intelligent virtual assistant
- Investors
- Start-up companies
- Raw material suppliers
- Government and other regulatory bodies
- Market research and consulting firms
Scope of the Report
The research report segments the intelligent virtual assistants market into following submarkets:
- By Product:
Chatbots
- IVA smart speakers
By User Interface
Text Based
- Text-To-Speech
- Automatic Speech Recognition (ASR)
- Others
By Type
Rule based
- Conversational AI based
By Industry
Consumer Electronics
- BFSI
- Healthcare
- Education
- Retail
- Government
- Utilities
- Travel & Hospitality
- Others
By Geography
North America
- U.S.
- Canada
- Mexico
- Europe
- U.K.
- Germany
- France
- Rest of Europe
- APAC
- China
- Japan
- Australia
- India
- Rest of APAC
- Rest of the World
- Middle East and Africa
- South America
- Available customizations:
With the given market data, MarketsandMarkets offers customizations as per the company’s specific needs. The following customization options are available for the report:
- Market Analysis
- Further breakdown of the IVA system applications market, by geography
- Company Information
- Detailed analysis and profiling of additional market players (up to five)


Growth opportunities and latent adjacency in Intelligent Virtual Assistant Market