Education and Learning Analytics Market by Application (Performance Management, Curriculum Development and Intervention Management, and People Acquisition and Retention), Component, Deployment, End User, and Region - Global Forecast to 2024


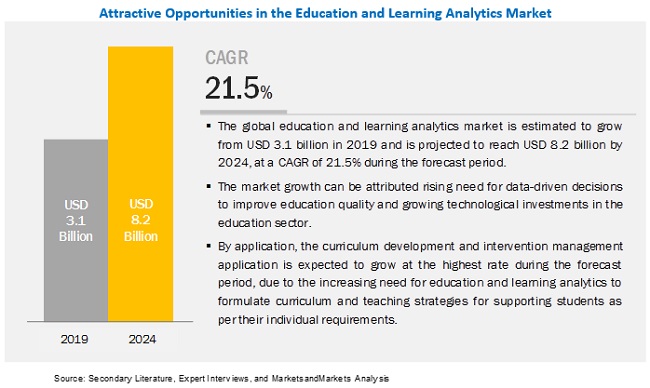
[176 Pages Report] The global Education and Learning Analytics Market size is estimated to reach USD 8.2 billion by 2024, at a Compound Annual Growth Rate (CAGR) of 21.5% during the forecast period. The market for education and learning analytics was valued USD 3.1 billion in 2019. The need for data-driven decisions to improve the quality of education is increasing with the growing volume of student�s data generated from different systems, such as Virtual Learning Environment (VLE), Learning Management System (LMS), student information system, or a variety of library systems.
The software segment to constitute a larger market size during the forecast period
The education and learning analytics market by component covers education and learning analytics software and associated services. The software segment outperforms the services segment and would see the maturation in the future due to the higher adoption of education and learning analytics software solutions. Hence, professional services, such as consulting, and support and maintenance services, are expected to gain traction in the next 5 years.
Performance management application segment to constitute the largest market size during the forecast period
Accessing and integrating disparate data across K-12, colleges, and universities is a tedious task. Education and learning analytics software enables educational institutes to access and integrate the data across multiple systems. This data analysis enables institutes to make data-informed decisions related to student performance. This, in turn, helps the educational institutes proactively intervene students� who are at risk, devise personalized content, and ultimately improve the success rate.
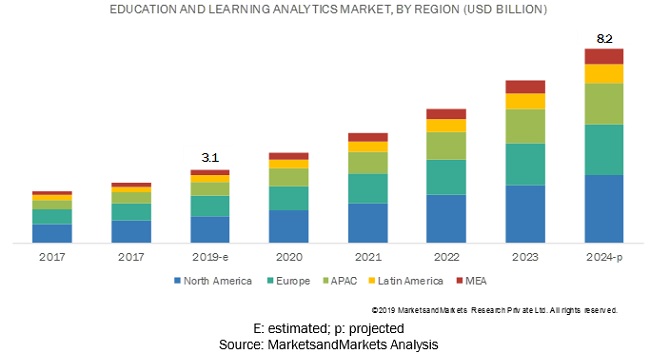
North America to account for the largest market size during the forecast period.
The global education and learning analytics market by region covers 5 major geographic regions, namely, North America, Asia Pacific (APAC), Europe, the Middle East and Africa (MEA), and Latin America. North America is estimated to account for the largest market size during the forecast period. Increased technological investment among education insitututes and presence of large number of analytics vendors in the regions are expected to drive the contribute to the growth of market in North American region.
The education and learning analytics market comprises major solution providers, such as IBM (US), TIBCO (US), Microsoft (US), Oracle (US), SAP (Germany), SAS Institute (US), Tableau Software (US), MicroStrategy (US), Alteryx (US), Qlik (US), SABA Software (US), Blackboard (US), Schoology (US), Latitude CG (US), Watershed Systems (US), Yellowfin (�Australia), BrightBytes (US), Certica Solutions (US), Civitas Learning (US), InetSoft (US), Zogo Technologies LLC (US), Ellucian (US), Hobsons (US), and D2L (Canada). The study includes an in-depth competitive analysis of these key players in the market with their company profiles, recent developments, and key market strategies.
Scope of the Report
|
Report Metric |
Details |
|
Market size available for years |
2017�2024 |
|
Base year considered |
2018 |
|
Forecast period |
2019�2024 |
|
Forecast units |
Billion (USD) |
|
Segments covered |
Application, Component, End User, Deployment Model, and Region |
|
Geographies covered |
North America, APAC, Europe, Latin America, and MEA |
|
Companies covered |
IBM (US), TIBCO (US), Microsoft (US), Oracle (US), SAP (Germany), SAS Institute (US), Tableau Software (US), MicroStrategy (US), Alteryx (US), Qlik (US), SABA Software (US), Blackboard (US), Schoology (US), Latitude CG (US), Watershed Systems (US), Yellowfin (�Australia), BrightBytes (US), Certica Solutions (US), Civitas Learning (US), InetSoft (US), Zogo Technologies LLC (US), Ellucian (US), Hobsons (US), and D2L (Canada) |
This research report categorizes the education and learning analytics market based on application, component, deployment model, end user, and region.
Based on Applications:
- People Acquisition and Retention
- Curriculum Development and Intervention Management
- Performance Management
- Budget and Finance Management
- Operations Management
- Others
Based on Components:
- Software
- Services
- Managed Services
- Professional Services
- Consulting
- Support and Maintenance
Based on Deployment Model
- On-premises
- Cloud
Based on end users:
- Academic
- K-12
- Higher Education
- Enterprise/corporate
- Small and Medium-sized Enterprises (SMEs)
- Large Enterprises
Based on Regions:
- North America
- United States (US)
- Canada
- Europe
- United Kingdom (UK)
- Germany
- France
- Italy
- Rest of Europe
- APAC
- China
- Japan
- Australia and New Zealand (ANZ)
- Singapore
- Rest of APAC
- Latin America
- Brazil
- Mexico
- Argentina
- Rest of Latin America
- MEA
- Middle East
- Africa
Recent Developments:
- In October 2019, Microstrategy announced a new technology partnership with DataRobot, a leader in enterprise Artificial Intelligence (AI), to make it easier for businesses to integrate AI into their web and mobile applications and core processes by using HyperIntelligence cards to generate AI-driven insights and recommendations.
- In October 2019, SAS Institute released an updated SAS Viya on the SAS platform offering the latest advanced analytics and AI techniques accessible to both data scientists and business users.
- In October 2018, Oracle announced the latest release of its Oracle Student Cloud suite of products, including Student Management, focused on support for traditional programs. It delivers a complete student lifecycle platform with new cloud enhancements that wraps financial planning and other services into one solution.
Key Questions Addressed by the Report:
- What are the opportunities in the education and learning analytics Market?
- What is the competitive landscape in the market?
- What are the emerging technologies impacting the overall market?
- What are the key uses cases existing in the market?
- What are the key trends and dynamics existing in the market?
To speak to our analyst for a discussion on the above findings, click Speak to Analyst
 Exclusive indicates content/data unique to MarketsandMarkets and not available with any competitors.
Table of Contents
1 Introduction (Page No. - 19)
1.1 Objectives of the Study
1.2 Market Definition
1.3 Market Scope
1.3.1 Market Segmentation
1.3.2 Regions Covered
1.3.3 Years Considered for the Study
1.4 Currency
1.5 Stakeholders
2 Research Methodology (Page No. - 22)
2.1 Research Data
2.1.1 Secondary Data
2.1.2 Primary Data
2.1.2.1 Breakup of Primary Profiles
2.1.2.2 Key Industry Insights
2.2 Market Breakup and Data Triangulation
2.3 Market Size Estimation
2.3.1 Top-Down Approach
2.3.2 Bottom-Up Approach
2.4 Market Forecast
2.5 Competitive Leadership Mapping Methodology
2.5.1 Vendor Inclusion Criteria
2.6 Assumptions for the Study
2.7 Limitations of the Study
3 Executive Summary (Page No. - 33)
4 Premium Insights (Page No. - 38)
4.1 Attractive Market Opportunities in the Market
4.2 Market: Top 3 Applications
4.3 Market: By Region
4.4 Education and Learning Analytics Market in North America, By Component and Deployment Mode
5 Market Overview and Industry Trends (Page No. - 40)
5.1 Introduction
5.2 Market Dynamics
5.2.1 Drivers
5.2.1.1 Rising Need for Data-Driven Decisions to Improve Education Quality
5.2.1.2 Growing Technological Investments Among Education Institutes
5.2.2 Restraints
5.2.2.1 Lack of Awareness and Skilled Resources to Manage Education Analytics Solutions
5.2.3 Opportunities
5.2.3.1 Cloud-Based Learning Analytics Solutions
5.2.3.2 Advent of Machine Learning and Artificial Intelligence
5.2.4 Challenges
5.2.4.1 Poor Institutional Infrastructure Raising Data Quality, Stewardship, and Standardization Issues
5.2.4.2 Lack of Understanding of the Learning Analytics Ecosystem By Executives
5.3 Industry Trends
5.4 Market: Use Cases
5.4.1 Use Case 1: Improving Student Success Rate Through Education Analytics
5.4.2 Use Case 2: Improving Student Retention Rate With Education Analytics
5.4.3 Use Case 3: Enhancing Student Retention and Graduation Rates
5.4.4 Use Case 4: Reducing Student Attrition Rate in Online Courses
5.4.5 Use Case 5: Engaging, Developing, and Retaining Talent to Secure the Workforce of Tomorrow
5.5 Regulations Pertaining to Education and Data Privacy
5.5.1 Right of Children to Free and Compulsory Education Act
5.5.2 Australian Education Act
5.5.3 Education Services for Overseas Students Act
5.5.4 Fundamental Law of Education
5.5.5 Compulsory Education Law of the People's Republic of China
5.5.6 South African Schools Act, No. 84 of 1996
5.5.7 The Education Act 2011
5.5.8 Every Student Succeeds Act
5.5.9 European Union General Data Protection Regulation
5.6 Education and Learning Analytics: Ecosystem
6 Education and Learning Analytics Market, By Component (Page No. - 50)
6.1 Introduction
6.2 Software
6.3 Services
6.3.1 Managed Services
6.3.1.1 Growing Need for Organizations to Focus on Their Core Business Processes to Drive the Market
6.3.2 Professional Services
6.3.2.1 Increase in Technicalities in the Deployment and Implementation of Education and Learning Analytics Solutions to Drive the Demand for Professional Services
6.3.2.2 Support and Maintenance
6.3.2.2.1 Growing Deployment of Education and Learning Analytics Software to Fuel the Demand for Support and Maintenance Services
6.3.2.3 Consulting
6.3.2.3.1 Lack of Skilled Resources in the Education Industry to Drive the Adoption of Consulting Services
7 Market, By Deployment Mode (Page No. - 58)
7.1 Introduction
7.2 On-Premises
7.2.1 Focus on Data Privacy and Security to Drive the Adoption of On-Premises Education and Learning Analytics Software
7.3 Cloud
7.3.1 Increasing Benefits Offered By Cloud-Based Education and Learning Analytics Software to Drive the Market Growth
8 Market, By End User (Page No. - 62)
8.1 Introduction
8.2 Academia
8.2.1 K-12
8.2.1.1 Ability of Education and Learning Analytics Software to Enable Enhanced Student Performance Assessment to Drive the Growth of the Market
8.2.2 Higher Education
8.2.2.1 Ability of Education and Learning Analytics Software to Enable Seamless Student Recruitment and Retention Activities to Drive the Adoption of These Software and Services
8.3 Corporate
8.3.1 Large Enterprises
8.3.1.1 Need to Store Large Volumes of Student Data Generated From Multiple Sources Drive the Adoption of Software and Services in Large Enterprises
8.3.2 Small and Medium-Sized Enterprises
8.3.2.1 Need to Extract Maximum Value Out of Student Data at Minimal Costs to Drive the Adoption of Education and Learning Analytics Software and Services
9 Education and Learning Analytics Market, By Application (Page No. - 70)
9.1 Introduction
9.2 People Acquisition and Retention
9.2.1 Rising Adoption of Data-Driven Approaches for Retention Strategies to Drive the Market Growth
9.3 Curriculum Development and Intervention Management
9.3.1 Need to Enhance Learning Processes By Allowing Teachers to Provide Feedback in Multiple Ways to Drive the Market Growth
9.4 Budget and Finance Management
9.4.1 Need to Identify New Avenues and Optimal Approaches for Students to Receive Funding and Grants to Drive the Adoption
9.5 Operations Management
9.5.1 Better Alignment of Employee Skills, Learning, and Development to Drive the Market
9.6 Performance Management
9.6.1 Need to Align Enterprise�s Operational Efficiency Requirements With Employee Performance to Drive the Adoption
9.7 Others
10 Market, By Region (Page No. - 78)
10.1 Introduction
10.2 North America
10.2.1 United States
10.2.1.1 Trend of Data Analytics Among Education Institutions to Make Strategic Decisions to Drive the Adoption of Software and Services
10.2.2 Canada
10.2.2.1 Growing Focus on the Development of Digital Learning Universities to Drive the Market
10.3 Europe
10.3.1 Germany
10.3.1.1 Government Focus on Technology and Analytics Integration Across Educational Organizations to Drive the Adoption of Education and Learning Analytics Software and Services
10.3.2 United Kingdom
10.3.2.1 Government Focus to Enhance Students� Learning Experience and Boost Their Performance to Drive the Growth of the Market
10.3.3 France
10.3.3.1 Government Initiatives to Integrate Digital Technologies in the Education Sector to Boost the Adoption of Education and Learning Analytics Software and Services
10.3.4 Italy
10.3.4.1 Rising Need for Smart Classrooms to Drive the Market Growth
10.3.5 Rest of Europe
10.4 Asia Pacific
10.4.1 Japan
10.4.1.1 Rapid Implementation of Artificial Intelligence and Machine Learning to Drive the Adoption of the Education and Learning Analytics Market
10.4.2 China
10.4.2.1 Need for Analyzing Student Data Across K-12 Schools to Boost the Adoption of Education and Learning Analytics
10.4.3 Singapore
10.4.3.1 Growing Volume of Data Across the Education Sector Led to an Increase in the Demand for Education and Learning Analytics Solutions
10.4.4 Australia and New Zealand
10.4.4.1 Growing Internet Penetration and Adoption of Mobile Devices to Drive the Growth of Education and Learning Analytics Solutions
10.4.5 Rest of APAC
10.5 Latin America
10.5.1 Brazil
10.5.1.1 Strong Presence of Leading Education and Learning Analytics Solution Providers to Bolster the Market Growth
10.5.2 Argentina
10.5.2.1 Need for Managing Rising Dropout Rates to Enhance the Adoption of Education and Learning Analytics Solutions
10.5.3 Mexico
10.5.3.1 Need for Reshaping the Technological Landscape in the Education Sector to Enhance the Growth of Education and Learning Analytics Solutions
10.5.4 Rest of Latin America
10.6 Middle East and Africa
10.6.1 Middle East
10.6.1.1 Favorable Government Policies for Technological Adoption in the Education Sector to Drive the Growth of Education and Learning Analytics Solutions
10.6.2 Africa
10.6.2.1 Need to Improve the Quality of Education and Learning Outcomes to Drive the Adoption of Education and Learning Analytics Solutions
11 Competitive Landscape (Page No. - 113)
11.1 Competitive Leadership Mapping
11.1.1 Visionary Leaders
11.1.2 Innovators
11.1.3 Dynamic Differentiators
11.1.4 Emerging Companies
12 Company Profiles (Page No. - 115)
12.1 Introduction
12.2 IBM
(Business Overview, Products and Services Offered, Recent Developments, SWOT Analysis, and MnM View)*
12.3 Microsoft
12.4 Oracle
12.5 SAS Institute
12.6 SAP
12.7 MicroStrategy
12.8 Blackboard
12.9 Tableau Software
12.10 Alteryx
12.11 TIBCO
12.12 Qlik
12.13 Yellowfin
12.14 SABA Software
12.15 Schoology (Powerschool)
12.16 Latitude CG
12.17 D2L
12.18 Watershed Systems
12.19 InetSoft
12.20 BrightBytes
12.21 Ellucian
12.22 Certica Solutions
12.23 Civitas Learning
12.24 Hobsons
12.25 Zogo Technologies
*Details on Business Overview, Products and Services Offered, Recent Developments, SWOT Analysis, and MnM View Might Not be Captured in Case of Unlisted Companies.
13 Appendix (Page No. - 169)
13.1 Key Insights of Industry Experts
13.2 Discussion Guide
13.3 Knowledge Store: Marketsandmarkets� Subscription Portal
13.4 Available Customizations
13.5 Related Reports
13.6 Author Details
List of Tables (102 Tables)
Table 1 United States Dollar Exchange Rate, 2015�2018
Table 2 Factor Analysis
Table 3 Evaluation Criteria
Table 4 Global Education and Learning Analytics Market Size and Growth Rate, 2017�2024 (USD Million, Y-O-Y %)
Table 5 Education and Learning Analytics Market Size, By Component, 2017�2024 (USD Million)
Table 6 Software: Market Size, By Region, 2017�2024 (USD Million)
Table 7 Services: Market Size, By Type, 2017�2024 (USD Million)
Table 8 Services: Market Size, By Region, 2017�2024 (USD Million)
Table 9 Managed Services: Market Size, By Region, 2017�2024 (USD Million)
Table 10 Professional Services: Market Size, By Type, 2017�2024 (USD Million)
Table 11 Professional Services: Market Size, By Region, 2017�2024 (USD Million)
Table 12 Support and Maintenance: Market Size, By Region, 2017�2024 (USD Million)
Table 13 Consulting: Market Size, By Region, 2017�2024 (USD Million)
Table 14 Education and Learning Analytics Market Size, By Deployment Mode, 2017�2024 (USD Million)
Table 15 On-Premises: Market Size, By Region, 2017�2024 (USD Million)
Table 16 Cloud: Market Size, By Region, 2017�2024 (USD Million)
Table 17 Education and Learning Analytics Market Size, By End User, 2017�2024 (USD Million)
Table 18 Academia: Market Size, By Type, 2017�2024 (USD Million)
Table 19 Academia: Market Size, By Region, 2017�2024 (USD Million)
Table 20 K-12: Market Size, By Region, 2017�2024 (USD Million)
Table 21 Higher Education: Market Size, By Region, 2017�2024 (USD Million)
Table 22 Corporate: Market Size, By Type, 2017�2024 (USD Million)
Table 23 Corporate: Market Size, By Region, 2017�2024 (USD Million)
Table 24 Large Enterprises: Market Size, By Region, 2017�2024 (USD Million)
Table 25 Small and Medium-Sized Enterprises: Market Size, By Region, 2017�2024 (USD Million)
Table 26 Education and Learning Analytics Market Size, By Application, 2017�2024 (USD Million)
Table 27 People Acquisition and Retention: Market Size, By Region, 2017�2024 (USD Million)
Table 28 Curriculum Development and Intervention Management: Market Size, By Region, 2017�2024 (USD Million)
Table 29 Budget and Finance Management: Market Size, By Region, 2017�2024 (USD Million)
Table 30 Operations Management: Market Size, By Region, 2017�2024 (USD Million)
Table 31 Performance Management: Market Size, By Region, 2017�2024 (USD Million)
Table 32 Others: Market Size, By Region, 2017�2024 (USD Million)
Table 33 Education and Learning Analytics Market Size, By Region, 2017�2024 (USD Million)
Table 34 North America: Market Size, By Component, 2017�2024 (USD Million)
Table 35 North America: Market Size, By Service, 2017�2024 (USD Million)
Table 36 North America: Education and Learning Analytics Market Size, By Professional Service, 2017�2024 (USD Million)
Table 37 North America: Market Size, By Application, 2017�2024 (USD Million)
Table 38 North America: Market Size, By Deployment Mode, 2017�2024 (USD Million)
Table 39 North America: Market Size, By End User, 2017�2024 (USD Million)
Table 40 North America: Market Size, By Academia, 2017�2024 (USD Million)
Table 41 North America: Market Size, By Corporate, 2017�2024 (USD Million)
Table 42 North America: Market Size, By Country, 2017�2024 (USD Million)
Table 43 United States: Education and Learning Analytics Market Size, By Component, 2017�2024 (USD Million)
Table 44 United States: Market Size, By Deployment Mode, 2017�2024 (USD Million)
Table 45 Canada: Market Size, By Component, 2017�2024 (USD Million)
Table 46 Canada: Education and Learning Analytics Market Size, By Deployment Mode, 2017�2024 (USD Million)
Table 47 Europe: Market Size, By Component, 2017�2024 (USD Million)
Table 48 Europe: Market Size, By Service, 2017�2024 (USD Million)
Table 49 Europe: Education and Learning Analytics Market Size, By Professional Service, 2017�2024 (USD Million)
Table 50 Europe: Market Size, By Application, 2017�2024 (USD Million)
Table 51 Europe: Market Size, By Deployment Mode, 2017�2024 (USD Million)
Table 52 Europe: Market Size, By End User, 2017�2024 (USD Million)
Table 53 Europe: Market Size, By Academia, 2017�2024 (USD Million)
Table 54 Europe: Market Size, By Corporate, 2017�2024 (USD Million)
Table 55 Europe: Market Size, By Country, 2017�2024 (USD Million)
Table 56 Germany: Education and Learning Analytics Market Size, By Component, 2017�2024 (USD Million)
Table 57 Germany: Market Size, By Deployment Mode, 2017�2024 (USD Million)
Table 58 United Kingdom: Market Size, By Component, 2017�2024 (USD Million)
Table 59 United Kingdom: Education and Learning Analytics Market Size, By Deployment Mode, 2017�2024 (USD Million)
Table 60 France: Market Size, By Component, 2017�2024 (USD Million)
Table 61 France: Education and Learning Analytics Market Size, By Deployment Mode, 2017�2024 (USD Million)
Table 62 Italy: Market Size, By Component, 2017�2024 (USD Million)
Table 63 Italy: Education and Learning Analytics Market Size, By Deployment Mode, 2017�2024 (USD Million)
Table 64 Asia Pacific: Market Size, By Component, 2017�2024 (USD Million)
Table 65 Asia Pacific: Market Size, By Service, 2017�2024 (USD Million)
Table 66 Asia Pacific: Education and Learning Analytics Market Size, By Professional Service, 2017�2024 (USD Million)
Table 67 Asia Pacific: Market Size, By Application, 2017�2024 (USD Million)
Table 68 Asia Pacific: Market Size, By Deployment Mode, 2017�2024 (USD Million)
Table 69 Asia Pacific: Market Size, By End User, 2017�2024 (USD Million)
Table 70 Asia Pacific: Market Size, By Academia, 2017�2024 (USD Million)
Table 71 Asia Pacific: Market Size, By Corporate, 2017�2024 (USD Million)
Table 72 Asia Pacific: Market Size, By Country, 2017�2024 (USD Million)
Table 73 Japan: Education and Learning Analytics Market Size, By Component, 2017�2024 (USD Million)
Table 74 Japan: Market Size, By Deployment Mode, 2017�2024 (USD Million)
Table 75 China: Market Size, By Component, 2017�2024 (USD Million)
Table 76 China: Education and Learning Analytics Market Size, By Deployment Mode, 2017�2024 (USD Million)
Table 77 Singapore: Market Size, By Component, 2017�2024 (USD Million)
Table 78 Singapore: Education and Learning Analytics Market Size, By Deployment Mode, 2017�2024 (USD Million)
Table 79 Australia and New Zealand: Market Size, By Component, 2017�2024 (USD Million)
Table 80 Australia and New Zealand: Education and Learning Analytics Market Size, By Deployment Mode, 2017�2024 (USD Million)
Table 81 Latin America: Market Size, By Component, 2017�2024 (USD Million)
Table 82 Latin America: Market Size, By Service, 2017�2024 (USD Million)
Table 83 Latin America: Education and Learning Analytics Market Size, By Professional Service, 2017�2024 (USD Million)
Table 84 Latin America: Market Size, By Application, 2017�2024 (USD Million)
Table 85 Latin America: Market Size, By Deployment Mode, 2017�2024 (USD Million)
Table 86 Latin America: Market Size, By End User, 2017�2024 (USD Million)
Table 87 Latin America: Market Size, By Academia, 2017�2024 (USD Million)
Table 88 Latin America: Market Size, By Corporate, 2017�2024 (USD Million)
Table 89 Latin America: Market Size, By Country, 2017�2024 (USD Million)
Table 90 Brazil: Education and Learning Analytics Market Size, By Component, 2017�2024 (USD Million)
Table 91 Brazil: Market Size, By Deployment Mode, 2017�2024 (USD Million)
Table 92 Middle East and Africa: Market Size, By Component, 2017�2024 (USD Million)
Table 93 Middle East and Africa: Market Size, By Service, 2017�2024 (USD Million)
Table 94 Middle East and Africa: Education and Learning Analytics Market Size, By Professional Service, 2017�2024 (USD Million)
Table 95 Middle East and Africa: Market Size, By Application, 2017�2024 (USD Million)
Table 96 Middle East and Africa: Market Size, By Deployment Mode, 2017�2024 (USD Million)
Table 97 Middle East and Africa: Market Size, By End User, 2017�2024 (USD Million)
Table 98 Middle East and Africa: Market Size, By Academia, 2017�2024 (USD Million)
Table 99 Middle East and Africa: Market Size, By Corporate, 2017�2024 (USD Million)
Table 100 Middle East and Africa: Market Size, By Subregion, 2017�2024 (USD Million)
Table 101 Middle East: Education and Learning Analytics Market Size, By Component, 2017�2024 (USD Million)
Table 102 Middle East: Market Size, By Deployment Mode, 2017�2024 (USD Million)
List of Figures (45 Figures)
Figure 1 Education and Learning Analytics Market: Research Design
Figure 2 Market Size Estimation Methodology, Approach 1 (Supply Side): Revenue of Products/Solutions/Services of the Market
Figure 3 Market Size Estimation Methodology, Approach 1 � Bottom-Up (Supply Side): Collective Revenue of All Products/Solutions/Services of the Market
Figure 4 Market Size Estimation Methodology, Approach 2 � Bottom-Up (Demand Side): Products/Solutions/Services Sold and Their Average Selling Price
Figure 5 Education and Learning Analytics Market: Top-Down and Bottom-Up Approaches
Figure 6 Market Snapshot, By Component
Figure 7 Market Snapshot, By Service
Figure 8 Market Snapshot, By Professional Service
Figure 9 Education and Learning Analytics Market Snapshot, By Deployment Mode
Figure 10 Market Snapshot, By Corporate End User
Figure 11 Market Snapshot, By Application
Figure 12 Market Snapshot, By Vertical
Figure 13 Market Snapshot, By Region
Figure 14 Growing Demand for Enhanced Visualization of the Data, Identification of Patterns, and Strengthening the System Capability to Process Education Related Data are the Key Factors Driving the Overall Growth of the Education and Learning Analytics Market
Figure 15 Curriculum Development and Intervention Management Segment to Grow at the Highest CAGR During the Forecast Period
Figure 16 North America to Hold the Highest Market Share in 2019
Figure 17 Performance Management Application and Academia End User in North America Accounted for the Highest Shares in the Market in 2019
Figure 18 Education and Learning Analytics Market: Drivers, Restraints, Opportunities, and Challenges
Figure 19 Education and Learning Analytics: Architecture
Figure 20 Software Segment to Account for a Larger Market Size During the Forecast Period
Figure 21 Managed Services Segment to Grow at a Higher CAGR During the Forecast Period
Figure 22 Support and Maintenance Segment to Grow at a Higher CAGR During the Forecast Period
Figure 23 On-Premises Segment to Grow at a Higher CAGR During the Forecast Period
Figure 24 Corporate Segment to Grow at a Higher CAGR During the Forecast Period
Figure 25 K-12 Segment to Grow at a Higher CAGR During the Forecast Period
Figure 26 Small and Medium-Sized Enterprises Segment to Grow at a Higher CAGR During the Forecast Period
Figure 27 Curriculum Development and Intervention Management Segment to Grow at the Highest CAGR During the Forecast Period
Figure 28 North America to Account for the Largest Market Size During the Forecast Period
Figure 29 North America: Market Snapshot
Figure 30 Education Spend Per Student Across the World, 2017
Figure 31 Asia Pacific: Market Snapshot
Figure 32 Education and Learning Analytics Market (Global) Competitive Leadership Mapping, 2019
Figure 33 IBM: Company Snapshot
Figure 34 IBM: SWOT Analysis
Figure 35 Microsoft: Company Snapshot
Figure 36 Microsoft: SWOT Analysis
Figure 37 Oracle: Company Snapshot
Figure 38 Oracle: SWOT Analysis
Figure 39 SAS: Company Snapshot
Figure 40 SAS Institute: SWOT Analysis
Figure 41 SAP: Company Snapshot
Figure 42 SAP: SWOT Analysis
Figure 43 MicroStrategy: Company Snapshot
Figure 44 Tableau Software: Company Snapshot
Figure 45 Alteryx: Company Snapshot
The study involved 4 major activities to estimate the current size of the education and learning analytics market. An exhaustive secondary research was done to collect information on the market, peer market, and the parent market. The next step was to validate these findings, assumptions, and sizing with the industry experts across value chain through primary research. Both top-down and bottom-up approaches were employed to estimate the complete market size. Thereafter, market breakup and data triangulation procedures were used to estimate the market size of the segments and subsegments.
Secondary Research
In the secondary research process, various secondary sources, such as Hoovers, Bloomberg BusinessWeek, and Dun & Bradstreet, have been referred for, to identify and collect information for this study. The secondary sources included annual reports; press releases and investor presentations of companies; white papers, certified publications, articles by recognized authors; gold standard and silver standard websites; education and learning technology Research and Development (R&D) organizations; regulatory bodies; and databases.
Primary Research
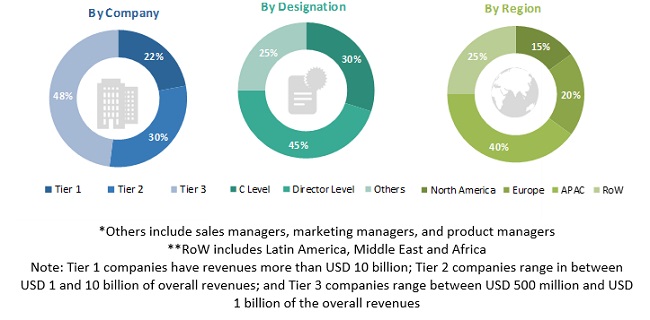
Various primary sources from both the supply and demand-sides of the education and learning analytics market ecosystem were interviewed to obtain qualitative and quantitative information for this study. The primary sources from the supply-side included industry experts, such as Chief Executive Officers (CEOs), Vice Presidents (VPs), marketing directors, technology and innovation directors, and related key executives from various vendors providing education and learning analytics software, associated service providers, and system integrators operating in the targeted regions. All possible parameters that affect the market covered in this research study have been accounted for, viewed in extensive detail, verified through primary research, and analyzed to get the final quantitative and qualitative data. Following is the breakup of the primary respondents:
To know about the assumptions considered for the study, download the pdf brochure
Market Size Estimation
For making market estimates and forecasting the education and learning analytics market, and the other dependent submarkets, the top-down and bottom-up approaches were used. The bottom-up procedure was used to arrive at the overall market size of the global education and learning analytics market using key companies� revenue and their offerings in the market. The research methodology used to estimate the market size includes the following:
- The key players in the market have been identified through extensive secondary research.
- The market size, in terms of value, has been determined through primary and secondary research processes.
- All percentage shares, splits, and breakups have been determined using secondary sources and verified through primary sources.
Data Triangulation
With data triangulation and validation through primary interviews, the exact value of the overall parent market was determined and confirmed using this study. The overall market size was then used in the top-down procedure to estimate the size of other individual markets via percentage splits of the market segmentation.
Report Objectives
- To define, describe, and forecast the education and learning analytics market based on applications, components, deployment models, end users, and regions
- To provide detailed information related to the major factors, such as drivers, restraints, opportunities, and challenges, influencing the growth of the market
- To analyze the market�s subsegments with respect to the individual growth trends, prospects, and contributions to the total market
- To analyze opportunities for stakeholders in the market and provide a competitive landscape of the market
- To forecast the revenue of the market�s segments with respect to 5 major regions, namely, North America, Europe, Asia Pacific (APAC), Middle East and Africa (MEA), and Latin America
- To profile the key players and comprehensively analyze their recent developments and positioning in the market
- To analyze the competitive developments, such as mergers and acquisitions, new product developments, and R&D activities in the market
Available Customizations
With the given market data, MarketsandMarkets offers customizations as per the company�s specific needs. The following customization options are available for the education and learning analytics market report:
Product Analysis
- Product matrix gives a detailed comparison of the product portfolio of each company
Company Information
- Detailed analysis and profiling of additional market players up to 5


Growth opportunities and latent adjacency in Education and Learning Analytics Market