
Machine Vision Market Size, Share & Trends, 2025 To 2030

Machine Vision Market by Component (Camera, Frame Grabbers, Optics, LED Lighting, Processors, AI-based Machine Vision Software), Type (PC based, Smart Camera-based), Deployment (General, Robotic Cell), Vision Type (1D, 2D, 3D) - Global Forecast to 2030


MACHINE VISION MARKET OVERVIEW
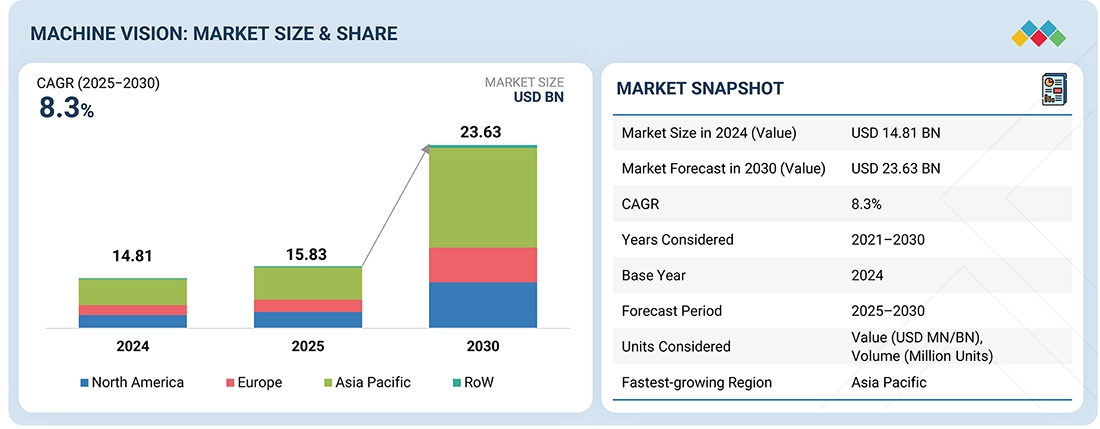
The global machine vision market is expected to grow from USD 15.83 billion in 2025 to USD 23.63 billion by 2030 at a CAGR of 8.3%. Advancements in automation and Industry 4.0, particularly in markets such as automotive, electronics, and pharmaceuticals, are driving the demand for machine vision systems industry to enhance quality control and operational optimization. The integration of AI and deep learning technologies significantly enhances the ability of these systems in terms of defect detection and predictive maintenance, particularly in high-growth industries such as electronics & semiconductors.
Market Size & Forecast
MACHINE VISION MARKET KEY TAKEAWAYS
-
BY COMPONENTThe machine vision market is segmented into cameras, optics, frame grabbers, processors, LED lighting, other hardware components, and software. The software segment, particularly AI-based machine vision software, is the fastest-growing component because it represents the intelligence layer that unlocks the true potential of the system. Advances in deep learning enable software to handle complex, unstructured inspection tasks with greater accuracy and flexibility than traditional rule-based systems, thereby increasing the value derived from fixed hardware components.
-
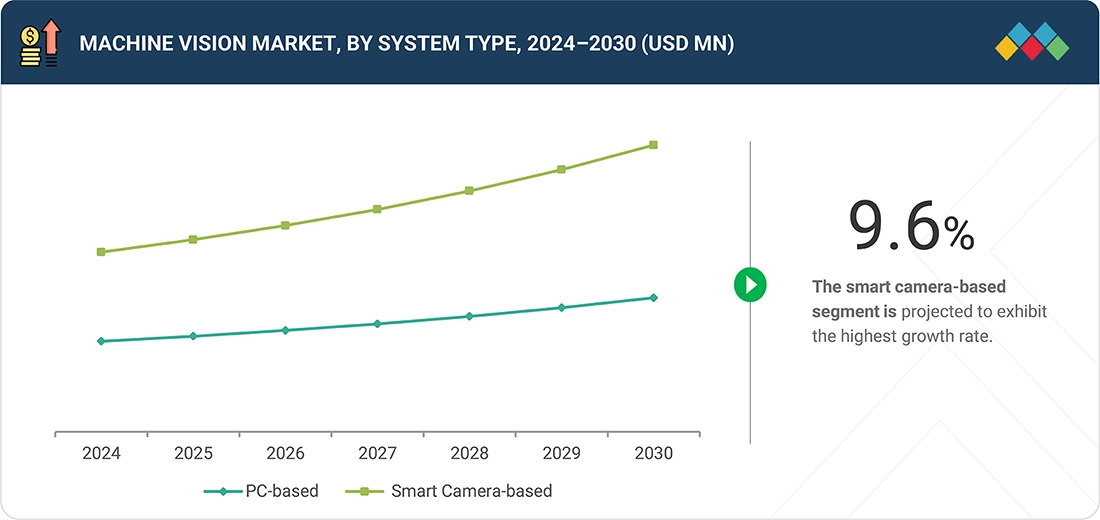
BY SYSTEM TYPEThe market is bifurcated into PC-based and Smart Camera-based. PC-based systems have historically held the largest market share due to their superior processing power and memory, which are necessary for complex, high-resolution 3D and multi-camera inspection tasks. These systems offer greater flexibility for customized applications and software integration, making them the preferred choice for demanding manufacturing environments in sectors like automotive and electronics.
-
BY INDUSTRYThe market serves a wide range of industries, including automotive, consumer products, electronics & semiconductors, printing, logistics, metals, rubber & plastics, food & beverages, healthcare, machinery, solar panel manufacturing, and other robotic vision industries. The food & beverage sector holds the largest market share, primarily due to stringent quality and safety regulations that mandate comprehensive inspection systems for sorting, grading, and detecting foreign objects. The consistency provided by machine vision is essential in high-speed processing lines to prevent contamination and maintain brand reputation, driving high adoption across packaging and quality control applications.
-
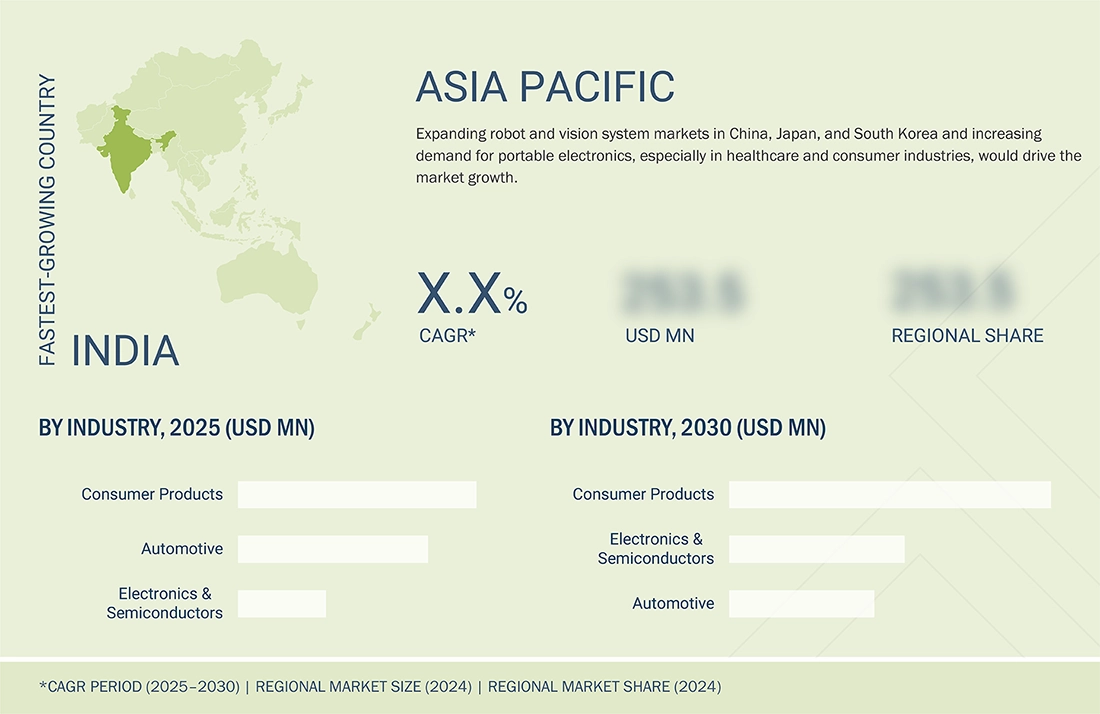
BY REGIONThe Asia Pacific is projected to record the fastest growth, with a CAGR of 9.2%, due to massive ongoing industrial automation efforts across major economies, including China, India, and South Korea. This growth is fueled by large-scale expansion in high-tech manufacturing, especially in electronics and automotive production, which requires high-volume, precision inspection and quality control offered by machine vision systems.
-
COMPETITIVE LANDSCAPEThe leading players in the market are Cognex Corporation, Teledyne Technologies Inc., KEYENCE CORPORATION, Omron Corporation, and Basler AG. Companies are pursuing strategic acquisitions and partnerships to expand their product portfolios and provide machine vision solutions, thereby strengthening their market position.
The machine vision market is growing rapidly as manufacturers increasingly demand higher precision, quality, and speed, particularly in sectors such as electronics, automotive, and pharmaceuticals. Technological advancements, including improved sensors, AI/ML, embedded processing, and smart cameras, are making vision systems more reliable and cost-effective. Additionally, labor shortages, rising automation in logistics and e-commerce, and stricter quality/regulatory standards are accelerating adoption.
Source: Secondary Research, Interviews with Experts, MarketsandMarkets Analysis
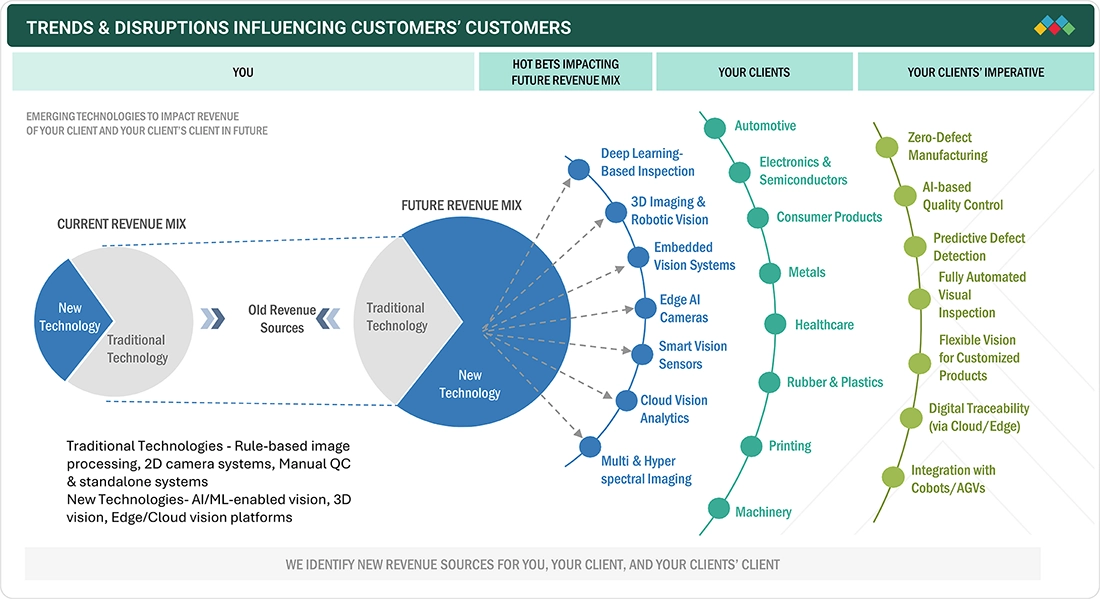
TRENDS & DISRUPTIONS IMPACTING CUSTOMERS' CUSTOMERS
The demand for machine vision systems is expected to increase over the next few years due to the growing need for automation in inspection processes across various industries. Key trends in the machine vision market include AI-driven advancements, integration with Industry 4.0 and smart manufacturing, rapid technological innovations, the emergence of embedded vision systems, edge computing, collaborative robots with vision capabilities, customization, a focus on sustainability, and data security. These trends impact customer businesses by enhancing efficiency, enabling real-time decision-making, supporting sustainability goals, and ensuring secure data handling in machine vision applications.
Source: Secondary Research, Interviews with Experts, MarketsandMarkets Analysis
MACHINE VISION MARKET DYNAMICS
Level
-
Increasing demand for quality assurance and automated inspection in manufacturing industry

-
Rising adoption of vision-guided robotic systems across multiple industries

Level
-
Lack of awareness and high cost associated with machine vision systems

Level
-
Rising adoption in food & beverage industry

-
Government-backed initiatives to support industrial automation

Level
-
Complexities in integrating diverse machine vision components with traditional systems

-
Cyber vulnerabilities in industrial robotic systems

Source: Secondary Research, Interviews with Experts, MarketsandMarkets Analysis
Driver: Increasing demand for quality assurance and automated inspection in manufacturing industry
Manufacturing companies worldwide are increasingly investing in automation. Also, the need for automated quality assurance has increased as industries have realized its importance in manufacturing processes. Quality assurance helps minimize defects, improve production efficiency, and ensure consistent product quality in manufacturing processes. This has led to the widespread adoption of machine vision as an integral part of long-term automation development processes.
Restraint: Lack of awareness and high cost associated with machine vision systems
A key challenge to the wider adoption of machine vision, despite its role in automation, is the lack of user awareness regarding advanced systems. While 3D stereo vision provides vital capabilities—such as precise distance measurement and complex defect identification (e.g., bent pins or irregular bottle shapes)—its sophistication creates barriers. The increasing complexity of 3D technology demands frequent training and workshops, which are costly and time-intensive. Consequently, operators often struggle to utilize these systems effectively, resulting in poor programming, inaccurate results, and unnecessary expenses.
Opportunity: Rising adoption in food & beverage industry
There has been a surge in demand for packaged food products, including biscuits, processed foods, frozen desserts, meat, and noodles. There is increasing adoption of machine vision technologies due to the growing demand for packaged food products. The major applications of AI machine vision systems in the food & beverage industry fall into three broad categories: production and processing, packaging and distribution, and tracking and tracing products through complex supply chains.
Challenge: Complexities in integrating diverse machine vision components with traditional systems
Whether it is a camera, optics, software, lighting, or a frame grabber, versatile solutions can be quickly developed to tackle a wide range of tasks by using multipurpose components. However, there is an urgent need to simplify the integration process of various components in machine vision systems and production lines at application sites. With the increasing need for convenient installation and handling of all technical systems, players in the machine vision industry must develop plug-and-play solutions to meet the demand for easier integration and installation.
Machine Vision Market: COMMERCIAL USE CASES ACROSS INDUSTRIES
| COMPANY | USE CASE DESCRIPTION | BENEFITS |
|---|---|---|
 |
Advanced cameras (2D, 3D, SWIR, line scan, embedded) and AI-enabled vision software for industrial inspection, robotics, logistics, pharma, automotive, and smart infrastructure | High image accuracy, rapid defect detection, modular systems, reliable AI analysis, broad application coverage, easy integration |
 |
Smart cameras/vision sensors for automated assembly, high-speed quality inspection, and robot guidance, widespread in automotive, electronics, and food industries | Consistent accuracy, quick deployment, flexible setups, robust programming, reduced manual oversight, scalable to diverse industries |
 |
Embedded and AI-powered vision platforms for real-time analytics, defect detection, lab automation, packaging, and automotive components | Reliable imaging for demanding environments, multi-format analytics, easy integration, robust data capture, customizable workflows |
 |
Vision systems (2D/3D/AI) for bin picking, object recognition, production quality control, dynamic factory inspection and automation | Flexible calibration, wide industry support, rapid error-proofing, fast deployment, versatile inspection modes, enhanced productivity |
 |
Vision-guided and deep learning systems for defect detection, traceability, barcode reading, robotic guidance, and yield optimization in manufacturing and logistics | Superior speed, robust accuracy, automated learning, minimal manual configuration, seamless traceability, high operational ROI |
Logos and trademarks shown above are the property of their respective owners. Their use here is for informational and illustrative purposes only.
MACHINE VISION MARKET ECOSYSTEM
A robust ecosystem of established hardware and software providers supports the machine vision market, which includes key players like Cognex Corporation (US), Basler AG (Germany), KEYENCE CORPORATION (Japan), Teledyne Technologies Inc. (US), and Omron Corporation (Japan). These companies offer advanced imaging technologies tailored to the needs of diverse industries. The market serves a wide range of potential customers across various sectors, including consumer products, automotive, pharmaceuticals, food & beverages, and machinery, highlighting its cross-sectoral relevance. The strong presence of industrial giants reflects the growing demand for automation, quality control, and intelligent inspection solutions.

Logos and trademarks shown above are the property of their respective owners. Their use here is for informational and illustrative purposes only.
MACHINE VISION MARKET SEGMENTS
Source: Secondary Research, Interviews with Experts, MarketsandMarkets Analysis
Machine Vision Market, By Component
The cameras segment held the largest market share in 2024, primarily because they are the fundamental, indispensable hardware component at the very start of any machine vision process. The camera is responsible for the crucial initial step of image capture, and its cost forms a substantial portion of the system's total bill of materials. Furthermore, the increasing demand for specialized, high-resolution smart cameras drives up the overall value of this segment.
Machine Vision Market, By System Type
The smart camera-based segment is experiencing the fastest growth because these systems integrate the camera, processor, and software into a single, compact unit. This results in easier installation, reduced integration complexity, and lower overall system costs for simpler inspection tasks, making them highly attractive for small- to medium-scale automation.
Machine Vision Market, By Industry
The Food & Beverage segment is forecast to be the fastest-growing in the machine vision market, primarily due to the increasing focus on strict quality control and traceability across the industry supply chain. Machine vision systems are being rapidly adopted for critical tasks such as high-speed packaging inspection, ensuring product integrity, and complying with complex regulatory standards.
MACHINE VISION MARKET REGION
Asia Pacific is expected to register the highest CAGR in the global machine vision market during the forecast period.
The Asia Pacific is projected to be the fastest-growing market for the machine vision market. The growth can be attributed to the large presence of major players through their subsidiaries, distributors, and resellers. China has a strong export industry. It is a major manufacturing hub for various industries, including electronics, semiconductors, automotive, and other consumer goods. The country has experienced tremendous industrial growth over the past two decades and has surpassed the US to become the world's largest producer of manufactured goods.
The North America machine vision market is projected to reach USD 6.66 billion by 2030 from USD 4.13 billion in 2024, growing at a CAGR of 8.5% from 2025 to 2030. Market growth is driven by the increasing adoption of automation in manufacturing, rising demand for quality inspection, rapid advancements in AI-based vision, and strong investments in smart factories and industrial digitization initiatives across the region.
The machine vision market in Europe is projected to reach USD 5.43 billion by 2030, up from USD 3.61 billion in 2024, with a CAGR of 7.3% from 2025 to 2030. Market growth is driven by the rising adoption of automation across European manufacturing, increasing demand for high-precision inspection, rapid advancements in AI-enabled vision technologies, and strong momentum toward smart factories supported by EU digitalization initiatives.
The Asia Pacific machine vision market is projected to reach USD 9.81 billion by 2030, up from USD 5.85 billion in 2024, growing at a CAGR of 9.2% from 2025 to 2030. Growth is supported by the region’s expanding electronics and semiconductor manufacturing base, accelerating automation in automotive and EV production, rising adoption of AI-driven inspection systems, and increasing investments in smart factory and industrial digitalization initiatives across the Asia Pacific.
Machine Vision Market: COMPANY EVALUATION MATRIX
In the machine vision market matrix, KEYENCE CORPORATION (Star) and Texas Instruments Incorporated (Emerging Leader) hold strong positions with their broad product portfolios, global presence, and robust financial capabilities. Their continuous innovation and brand equity enable them to lead large-scale adoption of machine vision solutions worldwide.
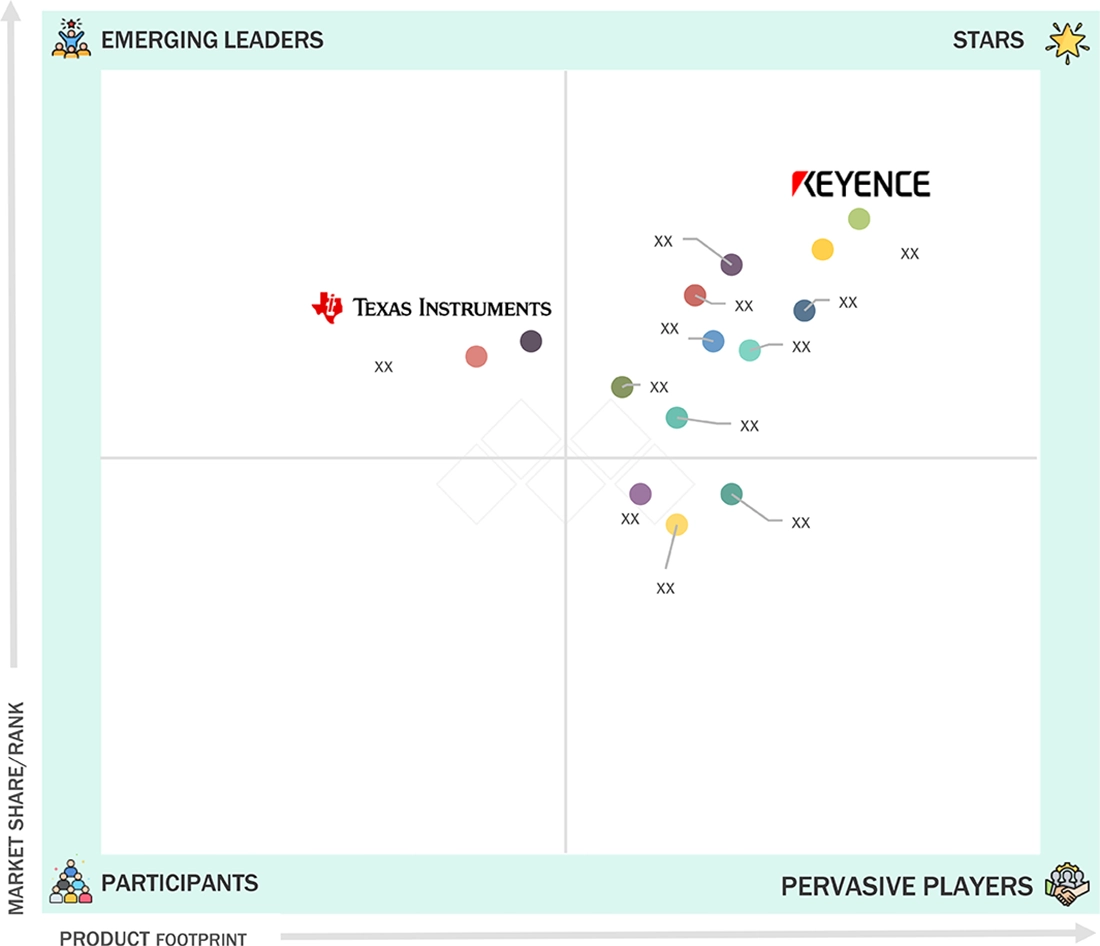
Source: Secondary Research, Interviews with Experts, MarketsandMarkets Analysis
MACHINE VISION MARKET KEY PLAYERS
MACHINE VISION MARKET SCOPE
| REPORT METRIC | DETAILS |
|---|---|
| Market Size in 2025 (Value) | USD 15.83 Billion |
| Market Forecast in 2030 (Value) | USD 23.63 Billion |
| Growth Rate | CAGR of 8.3% from 2025-2030 |
| Years Considered | 2021-2030 |
| Base Year | 2024 |
| Forecast Period | 2025-2030 |
| Units Considered | Value (USD Million/Billion), Volume (Million Unit) |
| Report Coverage | Revenue forecast, company ranking, competitive landscape, growth factors, and trends |
| Segments Covered |
|
| Regional Scope | North America, Europe, Asia Pacific, Latin America, Middle East, and RoW |
WHAT IS IN IT FOR YOU: Machine Vision Market REPORT CONTENT GUIDE
DELIVERED CUSTOMIZATIONS
We have successfully delivered the following deep-dive customizations:
| CLIENT REQUEST | CUSTOMIZATION DELIVERED | VALUE ADDS |
|---|---|---|
| European Automotive OEM |
|
|
| North American Electronics Manufacturer |
|
|
| Asia Pacific Pharmaceutical Packaging Company |
|
|
RECENT DEVELOPMENTS
- March 2025 : Keyence Corporation (Japan) launched vision sensor with built-in AI automates part detection, position verification, and counting under challenging conditions, surpassing traditional vision sensors. It ensures stability against environmental factors and simplify complex applications.
- September 2024 : Teledyne DALSA (Canada), a subsidiary of Teledyne Technologies Inc. (US), introduced the Linea HS2 TDI line scan camera family. It offers ultra-high-speed imaging with 16k resolution and 1 MHz line rates, excelling in light-starved environments. This next-generation TDI technology achieves 16 Gigapixels per second data throughput, representing a significant advancement in line scan imaging.
- August 2024 : Cognex Corporation (US) enhanced its In-Sight SnAPP vision sensor with a new AI-powered counting tool. This tool helps in automating assembly verification and quantity checks for manufacturers. It simplifies counting complex parts, including reflective, distorted, and varying contrast objects.
Table of Contents
 Exclusive indicates content/data unique to MarketsandMarkets and not available with any competitors.
Methodology
The study involved four major activities for estimating the current size of the machine vision market. Exhaustive secondary research has been done to collect information on the market. The next step is to validate these findings, assumptions, and size with industry experts across the value chain through primary research. Both the top-down and bottom-up approaches have been employed to estimate the complete market size. After that, market breakdown and data triangulation methods have been used to estimate the market size of the segments and subsegments. Two sources of information, secondary and primary, have been used to identify and collect information for an extensive technical and commercial study of the machine vision market.
Secondary Research
Various secondary sources have been referred to in the secondary research process to identify and collect information important for this study. The secondary sources include annual reports, press releases, and investor presentations of companies; white papers; journals and certified publications; and articles from recognized authors, websites, directories, and databases. Secondary research has been conducted to obtain key information about the industry’s supply chain, the market’s value chain, the total pool of key players, market segmentation according to the industry trends (to the bottom-most level), regional markets, and key developments from market- and technology-oriented perspectives. Secondary data has been collected and analyzed to determine the overall market size, which is further validated through primary research.
Primary Research
Extensive primary research was conducted after gaining knowledge about the current scenario of the machine vision market through secondary research. Several primary interviews were conducted with experts from the demand and supply sides across four major regions North America, Europe, Asia Pacific, and RoW. This primary data was collected through questionnaires, emails, and telephonic interviews.

To know about the assumptions considered for the study, download the pdf brochure
Market Size Estimation
Both the top-down and bottom-up approaches have been used to estimate and validate the total size of the machine vision market. These methods have also been used extensively to estimate the size of various subsegments in the market. The following research methodology has been used to estimate the market size:
- Major players in the market have been identified through extensive secondary research.
- The industry’s value chain and market size (in terms of value) have been determined through primary and secondary research processes.
- All percentage shares, splits, and breakdowns have been determined using secondary sources and verified through primary sources.
Machine Vision Market : Top-Down and Bottom-Up Approach

Data Triangulation
After arriving at the overall size of the machine vision market from the market size estimation process explained above, the total market has been split into several segments and subsegments. Data triangulation and market breakdown procedures have been employed, wherever applicable, to complete the overall market engineering process and arrive at the exact statistics for all segments and subsegments of the market. The data has been triangulated by studying various factors and trends from both the demand and supply sides. Along with this, the market size has been validated using both the top-down and bottom-up approaches.
Market Definition
Machine vision systems use a combination of hardware and software to provide operational guidance to devices in executing their functions. Visual inspections are automated, and product assembly equipment are precisely guided using sensors (cameras), processing hardware, and software algorithms. The system relies on digital sensors installed in cameras with specialized optics to acquire images. These images are then processed, analyzed, and measured by artificial intelligence (AI) technology embedded in the computer hardware for decision-making. AI allows machines to learn from experience, intercept new inputs, and perform human-like tasks. Machine learning and natural language processing (NLP), used to train computers, are also used in machine vision to perform specific tasks by processing large data captured by cameras. Machine vision systems offer fast response, a tailored approach, accurate information, and fewer redundancies—all essential to achieving higher organizational efficiency. Machine vision systems encompass all industrial and non-industrial applications.
Key Stakeholders
- Government bodies and policymakers
- Industry organizations, forums, alliances, and associations
- Raw material suppliers and distributors
- Research institutes and organizations
- Original equipment manufacturers (OEMs)
- Technology, service, and solution providers
- Intellectual property (IP) core and licensing providers
- Market research and consulting firms
Report Objectives
- To describe, segment, and forecast the overall machine vision market by application, vision type, deployment, component, system type, and industry, in terms of value
- To describe and forecast the market for four key regions: North America, Europe, Asia Pacific, and Rest of the World (RoW), along with their respective countries, in terms of value
- To provide an overview of the recent trends in the market
- To provide detailed information regarding the drivers, restraints, opportunities, and challenges influencing the growth of the market
- To analyze the supply chain, trends/disruptions impacting customer business, market/ecosystem map, pricing analysis, and regulatory landscape pertaining to the machine vision market
- To strategically analyze micromarkets with respect to individual growth trends, prospects, and contributions to the overall market size.
- To analyze opportunities in the market for stakeholders and provide a competitive landscape of the market
- To strategically profile the key players and comprehensively analyze their market positions in terms of their ranking and core competencies, along with detailing the competitive landscape for market leaders
- To analyze competitive developments, such as product launches, acquisitions, collaborations, agreements, and partnerships, in the machine vision market
- To provide ecosystem analysis, case study analysis, patent analysis, technology analysis, value chain analysis, trends/disruptions impacting customer business, impact of AI/Gen AI, key conferences and events, pricing analysis, Porter’s five forces analysis, and regulations pertaining to the market under study
- To provide a macroeconomic outlook based on all the regions in the region chapter
Available Customizations:
With the given market data, MarketsandMarkets offers customizations according to the company’s specific needs. The following customization options are available for the report:
Company Information:
- Detailed analysis and profiling of additional market players (up to 5)
Key Questions Addressed by the Report
What is the projected CAGR for the machine vision market from 2025 to 2030?
The global machine vision market is expected to record a CAGR of 8.3% from 2025 to 2030.
What are the driving factors for the machine vision market?
Key drivers for the machine vision market include an increasing demand for quality assurance and automated inspection in the manufacturing industry and rising adoption of vision-guided robotic systems across multiple industries.
Which are the significant players operating in the machine vision market?
Cognex Corporation (US), KEYENCE CORPORATION (Japan), Teledyne Technologies Inc. (US), Basler AG (Germany), and Omron Corporation (Japan) are major companies operating in the machine vision market.
What is the impact of AI on the machine vision market?
AI is transforming the machine vision market by enhancing image processing accuracy, speed, and decision-making capabilities. Advanced algorithms analyze image data captured in real-time to detect defects, classify objects, and support complex inspection tasks with minimal human intervention.
Which region is likely to offer lucrative opportunities for the players in the machine vision market?
During the forecast period, Asia Pacific is expected to offer lucrative opportunities for players in the machine vision market.
Need a Tailored Report?
Customize this report to your needs
Get 10% FREE Customization
Customize This ReportPersonalize This Research
- Triangulate with your Own Data
- Get Data as per your Format and Definition
- Gain a Deeper Dive on a Specific Application, Geography, Customer or Competitor
- Any level of Personalization
Let Us Help You
- What are the Known and Unknown Adjacencies Impacting the Machine Vision Market
- What will your New Revenue Sources be?
- Who will be your Top Customer; what will make them switch?
- Defend your Market Share or Win Competitors
- Get a Scorecard for Target Partners

Custom Market Research Services
We Will Customise The Research For You, In Case The Report Listed Above Does Not Meet With Your Requirements
Get 10% Free CustomisationTESTIMONIALS

Tetsuya Ohhira
Business Development Manager-Technology Business
Nikon Corporation,
Leading Japanese MNC specializing in optics and imaging productswww.nikon.com
MarketsandMarkets™ response
is quick. Their attitude is flexible and positive. Analyst Insights are globally considered and
significant. Client Services quickly respond to our inquiry and demand. Their wide range of global
surveys help us make our strategic plan.
We hope Knowledge Store will be easier to search
for a report.
VP - Marketing & Business Development
Leading Provider of Process Control Solutions
We engaged with MarketsandMarkets on a study to perform an analysis and recommend a Go-To-Market strategy for metrology and process control in the semiconductor market. The study was tailored to our targets and needs with well-defined milestones. Our overall experience with the MarketsandMarkets team was very good throughout the project in all aspects including the analysis methodologies used, the quality and depth of primary and secondary data sets, the professionalism and flexibility of the team and the ability to meet the target schedule and milestones. We want to thank MarketsandMarkets team for a job well done.
Growth opportunities and latent adjacency in Machine Vision Market


Clark
Apr, 2026
How is deep learning transforming machine vision from rule-based inspection to intelligent decision-making?.
Samuel
Apr, 2026
What�s driving the rapid growth of machine vision in Asia Pacific automation, electronics manufacturing, or labor dynamics?.