
Robotic Vision Market Size, Share & Trends

Robotic Vision Market Size, Share & Trends by Type (2D Vision Systems, 3D Vision Systems), Component (Cameras, LED Lighting, Optics, Processors & Controllers, Frame Grabbers, Deep Learning Software), Deployment (Robotic Guidance System, Robotic Cells)- Global Forecast to 2030


ROBOTIC VISION MARKET SIZE, SHARE & TRENDS
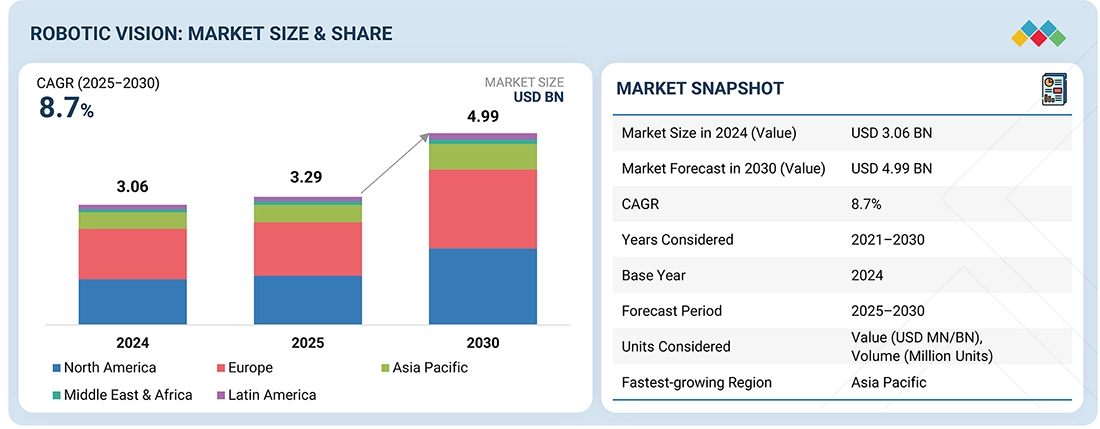
The global robotic vision market size was valued at USD 3.29 billion in 2025 and is projected to reach USD 4.99 billion by 2030, growing at a CAGR of 8.7% from 2025 to 2030. Robot vision systems provide reliable and consistent results because they eliminate defective goods from the supply chain and enable product traceability. Compared to photoelectric sensor-based applications, robotic vision systems are a better alternative. Many companies have adopted this technology, recognizing its value in improving product quality, enabling flexible manufacturing, and increasing throughput.
MARKET SNAPSHOPT TABLE
| REPORT METRIC | DETAILS |
|---|---|
| Market Size in 2025 (Value) | USD 3.29 Billion |
| Market Forecast in 2030 (Value) | USD 4.99 Billion |
| Growth Rate | CAGR of 8.7% from 2025-2030 |
| Years Considered | 2021-2030 |
| Base Year | 2024 |
| Forecast Period | 2025-2030 |
| Units Considered | Value (USD Million/Billion), Volume (Million Units) |
| Report Coverage | Revenue forecast, company ranking, competitive landscape, growth factors, and trends |
| Top Companies |
|
| Driver Growth |
|
| Segments Covered |
|
| Regions Covered | North America, Europe, Asia Pacific, Middle East, and RoW |
Market Size & Forecast
KEY TAKEAWAYS
-
BY COMPONENTThe software segment is experiencing the fastest growth because its value is tied directly to advancements in AI and deep learning. These software capabilities allow robotic vision systems to perform increasingly complex tasks, such as high-speed inspection, complex pattern recognition, and adaptive quality control, which provides a far greater return on investment and drives demand more rapidly than incremental hardware improvements.
-
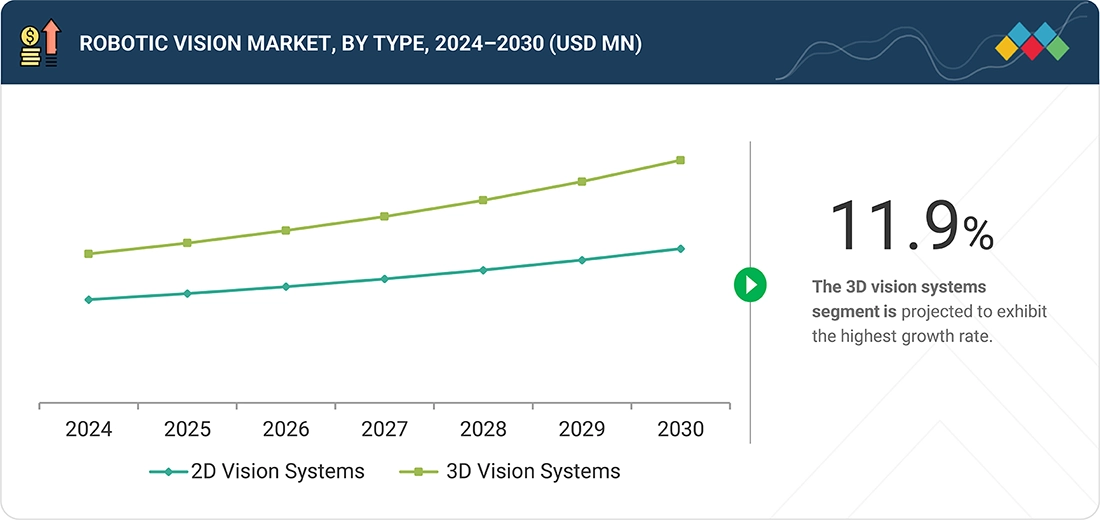
BY TYPEThe market is bifurcated into 2D and 3D vision systems. 2D vision systems hold the largest market share because they are more cost-effective, simpler to integrate, and offer sufficient functionality for the vast majority of industrial automation tasks. Most common applications, such as basic presence/absence checking, part inspection, and 2D guidance, do not require depth perception, making the mature 2D technology the default and most practical choice.
-
BY INDUSTRYThe automotive industry holds the largest market share in robotic vision due to its intensive need for high-speed, high-precision quality control across complex assembly lines. Vision systems are essential for tasks like robotic guidance for welding and painting, verifying the precise placement of thousands of components, and ensuring strict compliance with safety and cosmetic standards on every vehicle.
-
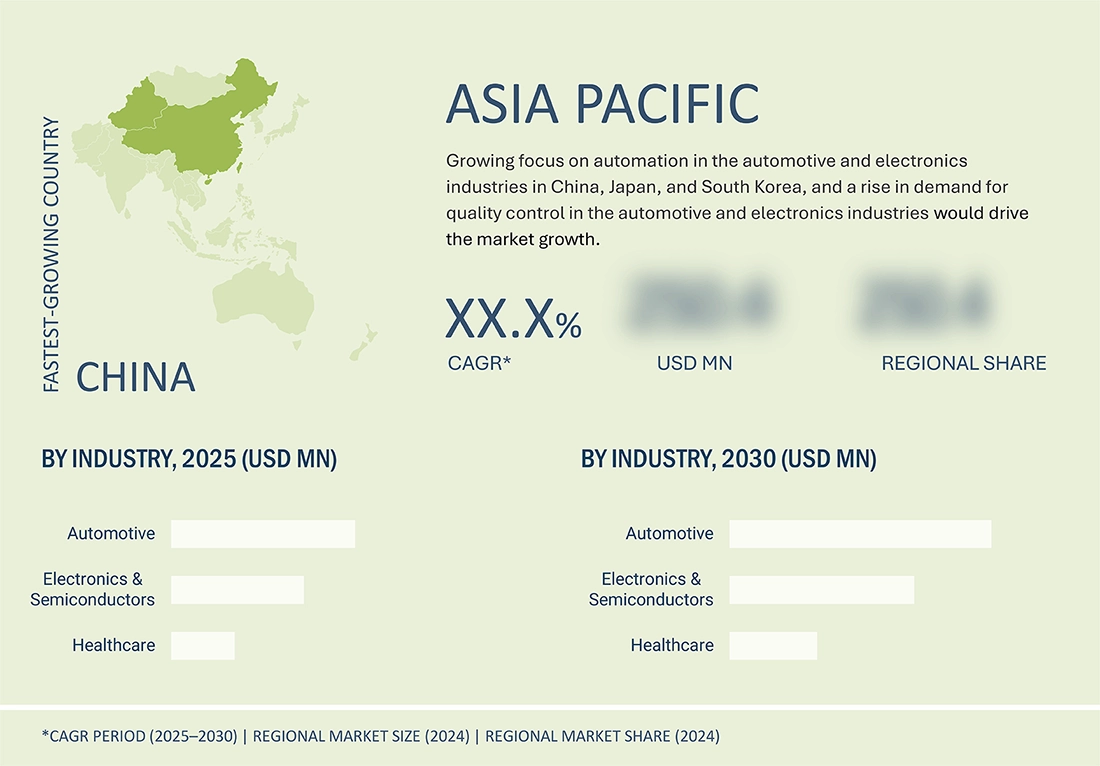
BY REGIONThe Asia Pacific is projected to record the fastest growth, with a CAGR of 9.5%, due to massive ongoing industrial automation efforts across major economies, including China, India, and South Korea. This growth is fueled by large-scale expansion in high-tech manufacturing, especially in electronics and automotive production, which requires high-volume, precision inspection and quality control offered by robotic vision systems.
-
COMPETITIVE LANDSCAPEThe leading players in the market are Cognex Corporation, Teledyne Technologies Inc., KEYENCE CORPORATION, Omron Corporation, and FANUC CORPORATION. Companies are pursuing strategic acquisitions and partnerships to expand their product portfolios and provide robotic vision solutions, thereby strengthening their market position.
The robotic vision market share is expanding rapidly because advances in cameras, sensors, and AI/ML now enable machines to perceive and make complex decisions with high accuracy, unlocking automation for tasks that previously required human intervention. The rising demand for higher throughput and zero-defect quality in industries like automotive, electronics, and logistics is driving adoption. At the same time, the falling costs of compute and vision hardware and integration with robots and Industry 4.0 platforms make vision systems a cost-effective way to boost productivity and respond to labor shortages.
Source: Secondary Research, Interviews with Experts, MarketsandMarkets Analysis
TRENDS & DISRUPTIONS IMPACTING CUSTOMERS' CUSTOMERS
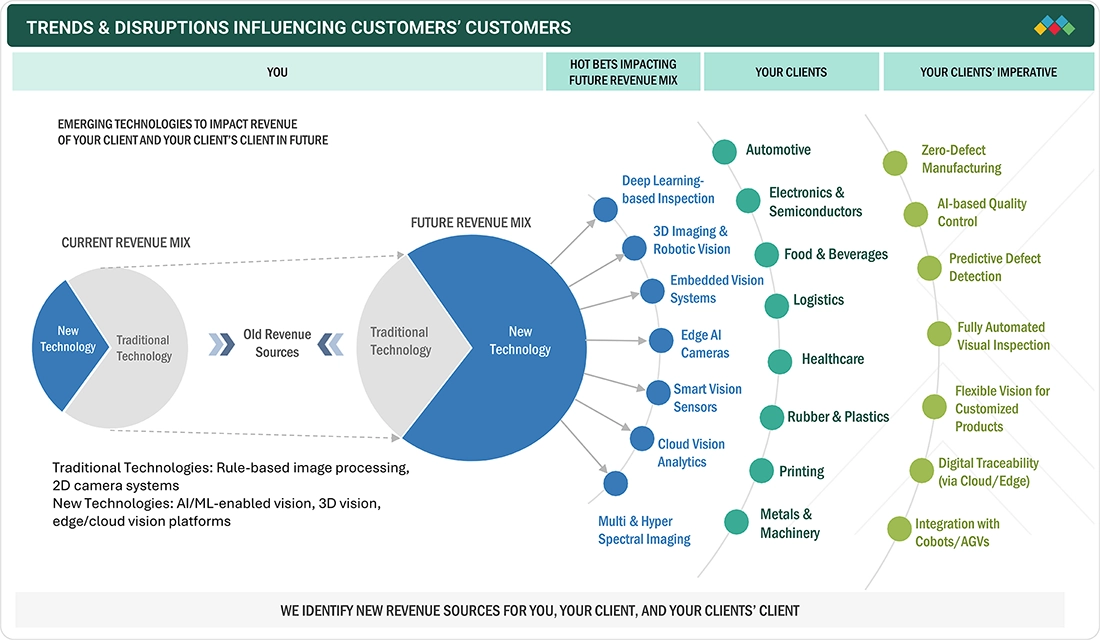
End users of robotic vision systems and system integrators have been leveraging imaging, optics, technologies, and software. Even though the machine vision system is a relatively mature technology, the decreasing costs of components, software, and engineering, combined with increased ease of use and application expansion, continue to drive the revenue growth of component and system suppliers serving the robotic vision market. The adoption of robotic vision systems for applications such as inspection, quality testing, and surface processing is expected to create a new revenue stream for robotic vision market trends players.
Source: Secondary Research, Interviews with Experts, MarketsandMarkets Analysis
MARKET DYNAMICS
Level
-
Rising emphasis on machine automation to enhance industrial operations

-
Growing adoption of 3D vision systems in industrial robotics

Level
-
High initial installation costs

-
Limited awareness of robotic vision systems

Level
-
Rising implementation of robotic vision systems in food & beverages industry

-
Government-driven programs to enhance industrial automation

Level
-
Complexities in integrating robots into vision systems

-
Issues related to complex inspections involving deviation and unpredictable defects

Source: Secondary Research, Interviews with Experts, MarketsandMarkets Analysis
Driver: Growing adoption of smart cameras in robotic vision systems
A smart camera is an integrated device with a powerful processor and advanced software, enabling it to perform complex vision tasks locally without relying on external CPU and memory. It combines image capture, processing, and analysis in a compact unit, processing data in real-time to boost speed and efficiency. Its flexibility and ease of integration make it suitable across many industries, leading to cost savings by reducing hardware and data transfer needs. The adoption of smart cameras in robotic vision is rapidly growing, transforming sectors like manufacturing, logistics, and healthcare by enhancing automation, accuracy, and efficiency
Restraint: Limited awareness of robotic vision systems
Limited awareness and understanding of robotic vision systems are key factors hindering the growth of the robotic vision market. Although the potential of robotic vision is vast, and it offers many benefits, many businesses and industries still do not recognize this technology or how to apply it in practice. For example, in India, industrial robots are mostly used in large-scale industries such as automobile and metal manufacturing. Consequently, 3D vision systems are commonly used in most industrial processes, but 2D vision systems see less adoption because smaller industries are less likely to embrace robot automation.
Opportunity: Incorporation of AI and deep learning technologies into robotic vision systems
New robotic vision technology, including AI and deep learning, has expanded business opportunities by enhancing visual perception, object recognition, scene understanding, and sequence identification. This has increased accuracy, reliability, and versatility, allowing systems to handle complex or dynamic tasks more effectively. AI-enabled decision-making allows real-time responses, sensing, and optimization. The democratization of AI through cloud platforms enables small and medium-sized enterprises (SMEs) to access advanced tools without heavy on-site infrastructure, facilitating image recognition, data analysis, and model training.
Challenge: Complexities in integrating robots into vision systems
Robotic vision systems mainly use step-by-step filtering and rule-based algorithms to detect deviations and defects. They work reliably with consistent parts, but increasing defects and exceptions make programming for new anomalies difficult, sometimes causing the system to misidentify objects. For example, in the food industry, if the system fails to identify rotten potatoes, it affects production, waste, and time. Vision systems tolerate minor variability in scale, rotation, and pose but struggle with complex textures, lighting issues, and distinguishing visual anomalies from functional ones. Hence, robotic vision systems can be challenging to program and maintain over time for complex inspections that involve deviations and unpredictable defects.
Robotic Vision Market: COMMERCIAL USE CASES ACROSS INDUSTRIES
| COMPANY | USE CASE DESCRIPTION | BENEFITS |
|---|---|---|
 |
Integrated iRVision for bin picking, part location, inspection, and robot guidance with 2D/3D sensors | Faster cycle times, higher accuracy, simplified programming, less fixturing, real-time inspection |
 |
Cobots with onboard vision for material handling, assembly, inspection, logistics | Rapid deployment, flexible programming, improved safety, reliable defect detection, consistent quality |
 |
Advanced Vision Solutions for process optimization, autonomous inspection, and smart data analytics in robotics | High-res 1D/2D/3D sensing, quick software integration, reliable QA, scalable to complex tasks, real-time processing |
 |
Vision-guided robots for pick-and-place, bin picking, high-speed defect detection, multi-inspection support | Fast, one-click calibration, 3D high-precision, flexible AI-based inspections, reduced labor, improved yield |
 |
Vision-guided robotic solutions for flexible manufacturing, barcode reading, deep learning-based inspection | Superior accuracy/speed, easy system integration, automated code reading, robust defect detection, production optimization |
Logos and trademarks shown above are the property of their respective owners. Their use here is for informational and illustrative purposes only.
MARKET ECOSYSTEM
A robust ecosystem of established hardware and software providers supports the robotic vision market growth, which includes key players, such as Cognex Corporation (US), Basler AG (Germany), KEYENCE CORPORATION (Japan), Teledyne Technologies Inc. (US), and OMRON Corporation (Japan). These companies offer advanced imaging technologies tailored to the needs of diverse industries. The strong presence of industrial giants reflects the growing demand for automation, quality control, and intelligent inspection solutions.
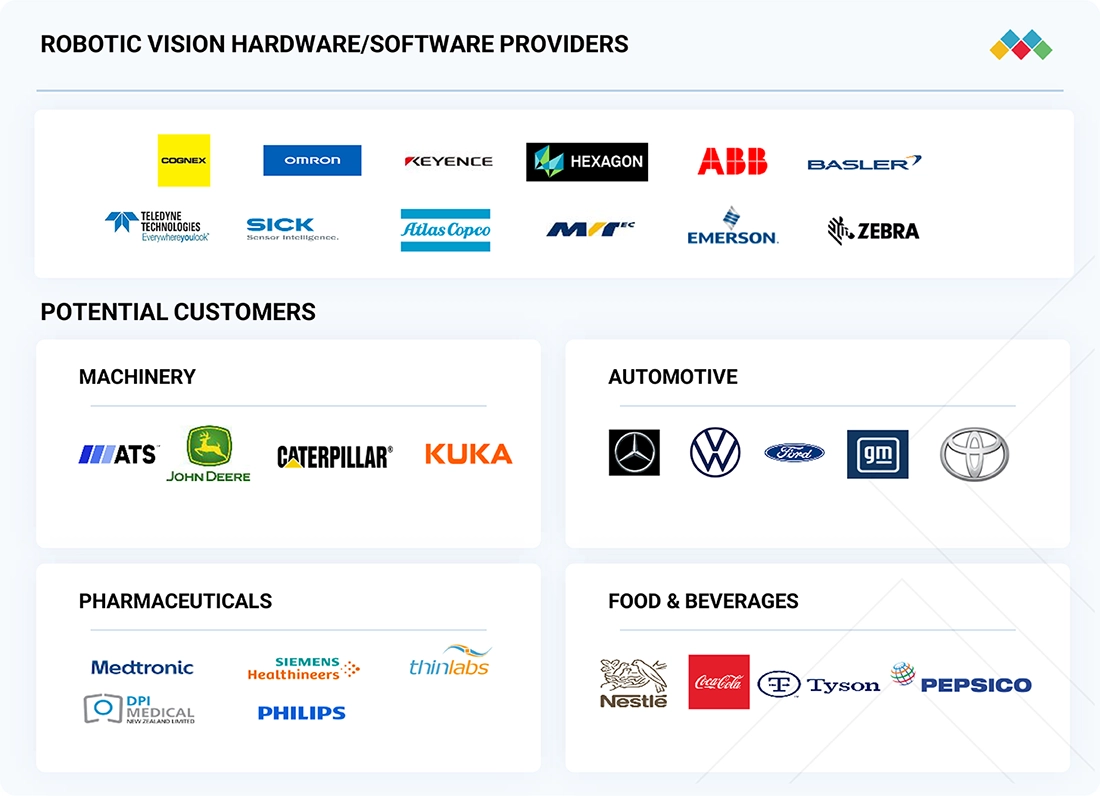
Logos and trademarks shown above are the property of their respective owners. Their use here is for informational and illustrative purposes only.
MARKET SEGMENTS
Source: Secondary Research, Interviews with Experts, MarketsandMarkets Analysis
Robotic Vision Market, By Component
Cameras held the largest market share in 2024, primarily because they are the fundamental, indispensable hardware component at the very start of any robotic vision process. The camera is responsible for the crucial initial step of image capture, and its cost forms a substantial portion of the system's total bill of materials. Furthermore, the increasing demand for specialized, high-resolution smart cameras drives up the overall value of this segment.
Robotic Vision Market, By Type
The 3D vision system segment is experiencing the fastest growth because industrial automation is rapidly shifting toward complex, unstructured tasks such as robotic bin picking, random part handling, and advanced quality inspection. These tasks require depth perception and spatial awareness, making 3D technology the necessary solution for next-generation manufacturing flexibility
Robotic Vision Market, By Industry
The food and beverage industry is exhibiting the fastest growth due to the escalating need for stringent safety and hygiene standards, coupled with the demand for rapid, accurate sorting and packaging of irregularly shaped products. Robotic vision systems are uniquely capable of high-speed defect detection, quality checks, and precision handling of delicate food items that are otherwise inconsistent for traditional automation.
REGION
Asia Pacific is expected to register the highest CAGR in the global robotic vision market during the forecast period.
The Asia Pacific is projected to be the fastest-growing market for robotic vision systems, as it is home to fast-growing economies and manufacturing hubs. China is a key market for emerging technologies, such as industrial robots and vision systems, while countries like Japan and South Korea have contributed to regional growth due to their large manufacturing industries. Countries such as Taiwan and India are expected to see significant growth as robotic vision systems enable industry modernization. The Asia Pacific also has the highest number of manufacturing plants, with Japan and South Korea leading in modern, advanced facilities, and India steadily adopting robotic vision technology.
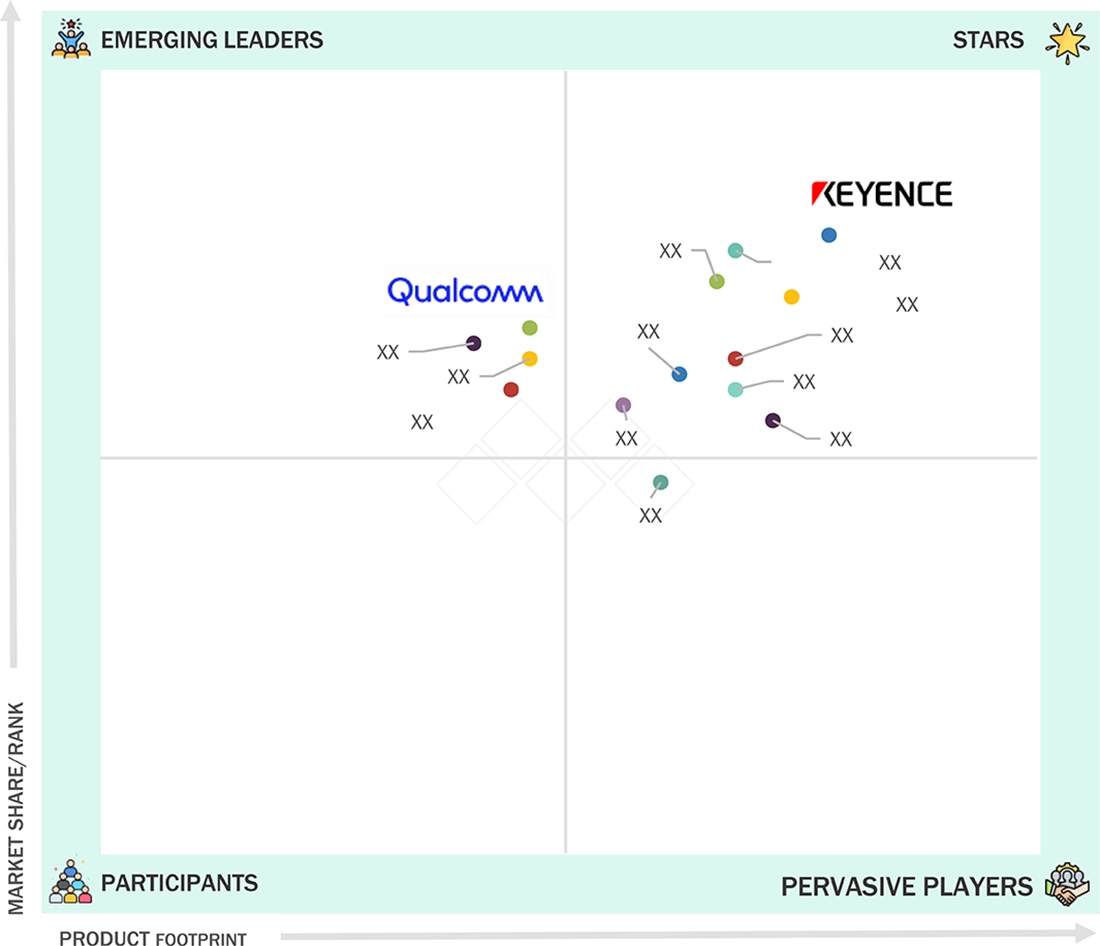
Robotic Vision Market: COMPANY EVALUATION MATRIX
In the robotic vision market matrix, KEYENCE CORPORATION (Star) and Qualcomm Technologies, Inc. (Emerging Leader) hold strong positions with their broad product portfolios, global presence, and robust financial capabilities. Their continuous innovation and brand equity enable them to lead the large-scale adoption of robotic vision solutions worldwide.
Source: Secondary Research, Interviews with Experts, MarketsandMarkets Analysis
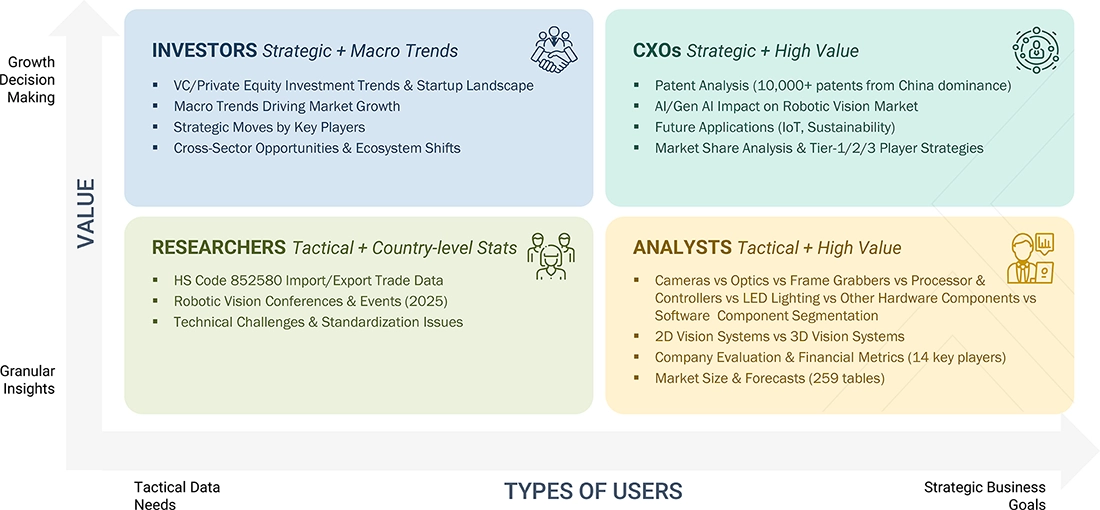
WHAT IS IN IT FOR YOU: Robotic Vision Market REPORT CONTENT GUIDE
DELIVERED CUSTOMIZATIONS
We have successfully delivered the following deep-dive customizations:
| CLIENT REQUEST | CUSTOMIZATION DELIVERED | VALUE ADDS |
|---|---|---|
| European Automotive OEM |
|
|
| North American Electronics Manufacturer |
|
|
| APAC Industrial Robot Integrator |
|
|
RECENT DEVELOPMENTS
- March 2025 : KEYENCE CORPORATION announced the launch of a vision sensor with built-in AI. It automates part detection, position verification, and counting under challenging conditions, surpassing the capabilities of traditional vision sensors. It ensures stability against environmental factors and simplifies complex applications.
- September 2024 : Teledyne DALSA, a subsidiary of Teledyne Technologies Inc., introduced the Linea HS2 TDI line scan camera family. It offers ultra-high-speed imaging with 16k resolution and 1 MHz line rates, excelling in light-starved environments.
- August 2024 : Cognex Corporation improved its In-Sight SnAPP vision sensor by adding a new AI-powered counting tool. This feature helps manufacturers automate assembly verification and quantity checks. It makes counting complex parts easier, even those that are reflective, distorted, or have varying contrast.
Table of Contents
 Exclusive indicates content/data unique to MarketsandMarkets and not available with any competitors.
Methodology
The study involved four main activities to estimate the current size of the robotic vision market. Extensive secondary research was conducted to gather information on the market, related markets, and the overall robotic vision landscape. These findings, along with assumptions and projections, were validated through primary research that included interviews with industry experts and key stakeholders across the value chain. Both top-down and bottom-up approaches were used to estimate the overall market size. Afterwards, market breakdown and data triangulation techniques helped determine the sizes of various segments and subsegments. Two primary sources, secondary and primary, were utilized to perform a comprehensive technical and commercial assessment of the robotic vision market.
Secondary Research
The secondary research process involved consulting various secondary sources to gather the necessary information for this study. These sources included annual reports, press releases, investor presentations by companies; white papers; journals and reputable publications; and articles from recognized authors, websites, directories, and databases. Secondary research was performed to acquire key information about the industry’s supply chain, the market’s value chain, the overall pool of key players, market segmentation based on industry trends (down to the most detailed level), regional markets, and significant developments from both market and technology perspectives. The collected secondary data was analyzed to estimate the overall market size, which was further validated through primary research.
Primary Research
After understanding the current state of the robotic vision market through secondary research, extensive primary research was conducted. Several interviews were carried out with experts from the demand and supply sides across four major regions: North America, Europe, the Asia Pacific, and the RoW. This primary data was gathered through questionnaires, emails, and phone calls.

Note: Three tiers of companies have been defined based on their total revenue as of 2024: tier 3: revenue less than USD 500 million; tier 2: revenue between USD 500 million and USD 1 billion; and tier 1: revenue more than USD 1 billion. Other designations include sales managers, marketing managers, and product managers.
To know about the assumptions considered for the study, download the pdf brochure
Market Size Estimation
Both top-down and bottom-up approaches were employed to estimate and validate the overall size of the robotic vision market. These methods have also been widely used to determine the size of various subsegments within the market. The following research methodology was applied to estimate the market size:
- Major players in the industry and markets were identified through extensive secondary research.
- The industry’s value chain and market size (in terms of value) were determined through primary and secondary research processes.
- All percentage shares, splits, and breakdowns were determined using secondary sources and verified through primary sources.
Robotic Vision Market : Top-Down and Bottom-Up Approach

Data Triangulation
After arriving at the overall size of the robotic vision market using the market size estimation process explained above, the total market was split into several segments and subsegments. Data triangulation and market breakdown procedures were employed, wherever applicable, to complete the overall market engineering process and arrive at the exact statistics for all segments and subsegments of the market. The data was triangulated by studying various factors and trends from both the demand and supply sides. The market size was also validated using both top-down and bottom-up approaches.
Market Definition
The integration of machine vision systems with industrial robots is called robotic vision. It involves combining advanced imaging and computer vision technologies with robotic systems to help machines perceive, interpret, and interact with their environment. This includes using cameras, sensors, and complex algorithms to capture and analyze visual data, enabling robots to perform tasks such as object recognition, navigation, inspection, and manipulation with high accuracy. The technology covers both 2D and 3D vision systems, which provide depth perception and spatial awareness essential for industries like manufacturing, automotive, logistics, and healthcare. By utilizing artificial intelligence and machine learning, robotic vision improves automation by supporting real-time decision-making and adapting to changing environments. It plays a key role in advancing Industry 4.0, boosting productivity, quality control, and safety in various operational areas.
Key Stakeholders
- Raw material and manufacturing equipment suppliers
- Government bodies, venture capitalists, and private equity firms
- Robotic vision manufacturers
- Robotic vision distributors
- Robotic vision industry associations
- Professional service/solution providers
- Research institutions and organizations
- Standards organizations and regulatory authorities related to the robotic vision market
- System integrators
- Technology consultants
Report Objectives
- To define, describe, and forecast the robotic vision market, in terms of type, component, industry, and region, in terms of value
- To forecast the market, by component, in terms of volume
- To describe and forecast the market, in terms of value, with regard to four central regions: North America, Europe, Asia Pacific, and Rest of the World (RoW), along with their respective countries
- To provide detailed information regarding major factors such as drivers, restraints, opportunities, and challenges influencing market growth
- To provide a detailed overview of the robotic vision value chain
- To strategically analyze micromarkets with respect to individual growth trends, prospects, and contributions to the robotic vision market
- To analyze opportunities in the market for stakeholders by identifying high-growth segments of the robotic vision market
- To strategically profile key players and comprehensively analyze their market position in terms of ranking and core competencies, along with detailing the competitive landscape for market leaders
- To analyze competitive strategies, such as product launches, expansions, mergers, and acquisitions, adopted by key players in the robotic vision market
Available customizations:
With the given market data, MarketsandMarkets offers customizations according to the company’s specific needs. The following customization options are available for the report:
Company Information:
- Detailed analysis and profiling of additional market players (up to 5)
Key Questions Addressed by the Report
What is the current size of the Robotic Vision Market?
The global Robotic Vision Market is estimated at USD 3.5 billion in 2025.
What is the projected market size by 2030?
The market is expected to reach USD 6.8 billion by 2030, driven by increasing adoption of industrial automation and AI-powered vision systems.
What is the CAGR of the Robotic Vision Market from 2025 to 2030?
The market is projected to grow at a CAGR of 14.2% during the forecast period.
What are the major growth drivers of the Robotic Vision Market?
Key drivers include growing adoption of smart cameras, increasing industrial automation, advancements in AI and machine vision, and rising demand for robotic quality inspection.
Why are smart cameras gaining popularity in robotic vision systems?
Smart cameras integrate image capture, processing, and analysis into a single device, enabling real-time decision-making, reducing hardware costs, and simplifying system integration.
Which industries are the primary users of robotic vision solutions?
Major end-use industries include manufacturing, automotive, electronics & semiconductor, logistics & warehousing, healthcare, and food & beverage processing.
Which region dominates the Robotic Vision Market?
Asia Pacific holds the largest market share due to strong manufacturing activity, rapid automation adoption, and significant investments in robotics across China, Japan, and South Korea.
Which region is expected to witness the fastest growth?
North America is projected to experience strong growth due to increasing deployment of AI-enabled robotic systems and smart factory initiatives.
Who are the leading companies in the Robotic Vision Market?
Major players include Cognex Corporation, Keyence Corporation, Basler AG, OMRON Corporation, FANUC Corporation, ABB Ltd., Yaskawa Electric Corporation, and SICK AG.
What are the key trends shaping the Robotic Vision Market?
Key trends include AI-powered vision systems, 3D machine vision, vision-guided robotics, edge computing, smart camera adoption, and collaborative robots (cobots) with integrated vision capabilities.
Need a Tailored Report?
Customize this report to your needs
Get 10% FREE Customization
Customize This ReportPersonalize This Research
- Triangulate with your Own Data
- Get Data as per your Format and Definition
- Gain a Deeper Dive on a Specific Application, Geography, Customer or Competitor
- Any level of Personalization
Let Us Help You
- What are the Known and Unknown Adjacencies Impacting the Robotic Vision Market
- What will your New Revenue Sources be?
- Who will be your Top Customer; what will make them switch?
- Defend your Market Share or Win Competitors
- Get a Scorecard for Target Partners

Custom Market Research Services
We Will Customise The Research For You, In Case The Report Listed Above Does Not Meet With Your Requirements
Get 10% Free CustomisationTESTIMONIALS

Tetsuya Ohhira
Business Development Manager-Technology Business
Nikon Corporation,
Leading Japanese MNC specializing in optics and imaging productswww.nikon.com
MarketsandMarkets™ response
is quick. Their attitude is flexible and positive. Analyst Insights are globally considered and
significant. Client Services quickly respond to our inquiry and demand. Their wide range of global
surveys help us make our strategic plan.
We hope Knowledge Store will be easier to search
for a report.
VP - Marketing & Business Development
Leading Provider of Process Control Solutions
We engaged with MarketsandMarkets on a study to perform an analysis and recommend a Go-To-Market strategy for metrology and process control in the semiconductor market. The study was tailored to our targets and needs with well-defined milestones. Our overall experience with the MarketsandMarkets team was very good throughout the project in all aspects including the analysis methodologies used, the quality and depth of primary and secondary data sets, the professionalism and flexibility of the team and the ability to meet the target schedule and milestones. We want to thank MarketsandMarkets team for a job well done.


Growth opportunities and latent adjacency in Robotic Vision Market