Next Generation Emergency Response System Market

Next Generation Emergency Response System Market by Offering (Hardware, Software, Services) by End User (PSAPs, Law Enforcement Agencies, Fire Departments, Emergency Medical Services, Other End Users) and Region - Global Forecast to 2028

Report Code: TC 8955 Feb, 2024, by marketsandmarkets.com

[224 Pages Report] MarketsandMarkets forecasts that the next generation emergency response system market size is projected to grow from USD 2.4 billion in 2023 to USD 3.3 billion by 2028, at a CAGR of 7.0% during the forecast period. Much of the emergency response infrastructure in place today is aging and outdated. This can make it unreliable and inefficient. Next generation systems are being designed to be more modern and up-to-date so that they can provide more reliable and effective service. As the benefits of next generation emergency response systems become more apparent, there is a growing awareness among government agencies and emergency responders of the need to invest in these technologies. This is driving the adoption of next generation emergency response systems worldwide.

Next Generation Emergency Response System Market

To know about the assumptions considered for the study, Request for Free Sample Report

Next Generation Emergency Response System Market Opportunities

To know about the assumptions considered for the study, download the pdf brochure

Next Generation Emergency Response System Market Dynamics

Driver:  The proliferation of the Internet of Things (IoT), smart cities, connected vehicles, and wearables

The proliferation of the Internet of Things (IoT), smart cities, connected vehicles, and wearables has become a driving force behind the evolution of Next Generation Emergency Response Systems (NGERS). In the realm of IoT, the integration of sensors in diverse environments allows for real-time data collection and analytics, enabling proactive incident detection and optimized resource allocation. Smart cities further enhance emergency response by integrating urban infrastructure components and facilitating real-time communication, while predictive analytics contribute to risk mitigation. Connected vehicles, equipped with telematics and Automatic Crash Notification (ACN) systems, provide crucial real-time data for locating and assisting individuals in emergencies. Wearable devices, with their ability to monitor health metrics and provide location tracking, play a pivotal role in transmitting critical information to emergency responders. The synergy among these technologies creates an interconnected ecosystem, fostering efficient data flow and informed decision-making within NGERS. As this integration continues to advance, it holds the promise of significantly improving public safety and emergency response effectiveness in the face of diverse challenges.

Restraint: Cost and infrastructure challenges

The development and deployment of Next Generation Emergency Response Systems (NGERS) face formidable challenges, primarily rooted in cost and infrastructure considerations. The initial investment required for the creation of cutting-edge technologies, software, and hardware components is substantial. This encompasses the integration of advanced sensors, communication devices, and real-time data analysis platforms. Upgrading existing emergency response infrastructure to align with the demands of NGERS can pose hurdles, particularly in regions with underdeveloped or inadequate connectivity. Ongoing operational costs, such as maintenance, energy consumption, and data storage, further contribute to the economic challenges. Achieving interoperability between NGERS and diverse existing emergency systems, navigating data security and privacy concerns, and complying with regulatory standards present additional complexities. Training emergency personnel, overcoming funding constraints, and fostering public awareness and acceptance are integral but demanding aspects of successful NGERS implementation. Addressing these multifaceted challenges requires collaborative efforts among governments, technology providers, and emergency response agencies to ensure the seamless integration of these systems for enhanced public safety.

Opportunity: Adoption of cloud computing

The integration of cloud computing technology represents a significant boon for the Next Generation Emergency Response System (NGERS) market, offering a multifaceted approach to enhancing capabilities. Cloud platforms provide unparalleled scalability, allowing NGERS to seamlessly adjust resources in response to fluctuating demands during emergencies. Furthermore, cloud-based storage solutions offer a cost-effective means of handling large volumes of multimedia data generated during emergency responses, while real-time communication tools foster collaboration among responders and stakeholders. Leveraging cloud-based data analytics and machine learning, NGERS can extract actionable insights from extensive datasets, facilitating informed decision-making during critical situations. The geospatial analysis capabilities of cloud platforms enable dynamic mapping, aiding in resource deployment and overall response coordination. The cost-efficiency of cloud adoption, coupled with the reliability and redundancy of distributed data centers, ensures operational continuity in the face of disruptions. The cloud's integration with Internet of Things (IoT) devices enhances situational awareness, and robust security measures offered by leading cloud providers safeguard sensitive emergency response data. In essence, cloud computing emerges as a transformative force, providing NGERS with the technological prowess to optimize response efforts, improve accessibility, and pave the way for a more resilient and collaborative emergency response landscape.

Challenge: Scalability and flexibility

The urgency and unpredictability of emergency situations demand a system capable of seamlessly handling increased data volumes, yet scalability hurdles emerge when the infrastructure strains under the weight of surging demands. Resource allocation complexities further compound this challenge, requiring careful management of servers, bandwidth, and processing power. On the flexibility front, interoperability issues pose a significant obstacle, as NGERS amalgamates diverse technologies with distinct standards, hindering smooth communication and adaptability. The rapid evolution of technology introduces another layer of complexity, necessitating swift integration of innovations without disruption. Integrating legacy systems and facilitating collaboration among multi-agency entities underscore the importance of a flexible and interoperable framework. NGERS must also demonstrate adaptability in the face of dynamic threats, necessitating the incorporation of new threat intelligence and community feedback for a responsive and tailored approach to emergency response.

Next Generation Emergency Response System Market Ecosyste

Prominent companies in this market include a well-established, financially stable provider of the next generation emergency response system market. These companies have innovated their offerings and possess a diversified product portfolio, state-of-the-art technologies, and marketing networks. Prominent companies in this market include Motorola Solutions (US), AT&T (US), Intrado (US), Hexagon (Sweden), Esri (US), Sinch (Sweden), Atos (France), Comtech (US), Zetron (US), Everbridge (US).

Top Companies in Next Generation Emergency Response System Market

Based on end user, the Emergency Medical Services segment is expected to grow with the highest CAGR during the forecast period

Emergency Medical Services (EMS) integration is a critical component in the development of the next generation emergency response systems market. By utilizing cutting-edge communication technologies to provide real-time information sharing between emergency personnel and medical specialists, the next generation of these systems aims to provide comprehensive emergency treatment. The optimal use of resources is achieved through data analytics and predictive modelling, while remote patient monitoring and telemedicine facilitate better decision-making and the early identification of health problems. Drones and geospatial technologies facilitate better event assessment and resource deployment, while wearable technology keeps emergency medical staff safe while providing vital health information. Rapid data analysis and the identification of crucial circumstances are facilitated by artificial intelligence (AI) and machine learning.

By end user, the Public Safety Answering Points (PSAPs) segment to expected to grow with the highest CAGR during the forecast period

In the evolution towards next generation emergency response systems market, Public Safety Answering Points (PSAPs) serve as pivotal hubs, embracing advanced technologies for more efficient emergency response. The integration of multimedia support within next generation emergency response systems allows PSAPs to receive and process diverse data types, such as text messages, images, and videos, enabling a richer understanding of emergencies. With enhanced geolocation services, PSAPs can leverage real-time location data to ensure accurate and swift response to incidents, particularly crucial in the case of mobile device emergencies. The interconnected nature of next generation emergency response systems facilitates seamless collaboration between various emergency response agencies, enabling PSAPs to coordinate effectively with law enforcement, fire departments, and medical services.

Based on region, Asia Pacific is expected to grow with the highest CAGR during the forecast period

The next generation emergency response system market in the Asia Pacific region is undergoing significant advancements, leveraging cutting-edge technologies to enhance the efficiency and effectiveness of emergency management. With a focus on IoT-based solutions, advanced communication systems like 5G, GIS technology, and artificial intelligence, the market aims to provide seamless and data-driven emergency responses. Mobile apps, wearables, and drones facilitate communication, location tracking, and aerial surveillance during emergencies. The integration of big data analytics allows for the processing of vast datasets to derive valuable insights, while collaborative platforms enable better coordination among various emergency response agencies.

Asia Pacific Next Generation Emergency Response System Market Size, and Share

Market Players:

The major players in the Next generation emergency response system market are Motorola Solutions (US), AT&T (US), Intrado (US), Hexagon (Sweden), Sinch (Sweden). These players have adopted various growth strategies, such as partnerships, agreements and collaborations, new product launches, product enhancements, and acquisitions to expand their footprint in the next generation emergency response system market.

Get online access to the report on the World's First Market Intelligence Cloud

  • Easy to Download Historical Data & Forecast Numbers
  • Company Analysis Dashboard for high growth potential opportunities
  • Research Analyst Access for customization & queries
  • Competitor Analysis with Interactive dashboard
  • Latest News, Updates & Trend analysis
Request Sample

Scope of the Report

Report Metrics

Details

Market size available for years

2018-2028

Base year considered

2022

Forecast period

2023–2028

Forecast units

Value (USD) Million/Billion

Segments Covered

Offering (Hardware (Switching & Routing Equipment, Call Handling Systems, Network Infrastructure Equipment, Other Hardware), Software (Call Management Software, Location-Based Services Software, Text Messaging Software, Multimedia Support Software, Other Softwares), Services (Professional Services (Training & Support Services, Consulting, Integration), Managed Services)), End User (Public Safety Answering Points (PSAPs), Law Enforcement Agencies, Fire Departments, Emergency Medical Services, Other End Users) and Region

Region covered

North America, Europe, Asia Pacific, Middle East & Africa, Latin America

Companies covered

Motorola Solutions (US), AT&T (US), Intrado (US), Hexagon (Sweden), Esri (US), Sinch (Sweden), Atos (France), Comtech (US), Zetron (US), Everbridge (US), Avaya (US), Cisco (US), RapidSOS (US), NGA (India), Convey 911 (US), Boost Pro Systems (UK), Simoco Wireless Solutions (UK), SEON Group (Germany), Carbyne (US), RapidDeploy (US)

This research report categorizes the next generation emergency response system market based on offering, end user, and region.

Based on Offering:
  • Hardware
    • Switching & Routing Equipment
    • Call Handling Systems
    • Network Infrastructure Equipment
    • Other Hardware
  • Software
    • Call Management Software
    • Location-Based Services Software
    • Text Messaging Software
    • Multimedia Support Software
    • Other Softwares
  • Services
    • Professional Services
      • Training & Support Services
      • Consulting
      • Integration
    • Managed Services
Based on End User
  • Public Safety Answering Points (PSAPs)
  • Law Enforcement Agencies
  • Fire Departments
  • Emergency Medical Services
  • Other End Users
Based on the region:
  • North America
    • US
    • Canada
  • Europe
    • UK
    • Germany
    • France
    • Spain
    • Italy
    • Rest of Europe
  • Asia Pacific
    • China
    • Japan
    • India
    • Rest of Asia Pacific
  • Middle East & Africa
    • GCC Countries
      • UAE
      • KSA
      • Rest of GCC Countries
    • South Africa
    • Rest of Middle East & Africa
  • Latin America
    • Brazil
    • Mexico
    • Rest of Latin America

Recent Developments

  • In August 2023, Motorolla Solutions launched CommandCentral Router. It is one of the first cloud-based 9-1-1 call routing technologies in the industry. It provides public safety answering points (PSAPs) with dependable, mission-critical 9-1-1 call routing performance through a cloud-based solution. It is compatible with all of Motorola Solutions' emergency call management products.
  • In May 2022, AT&T launched a new 911 location service, which enables them to route 911 calls from its wireless subscribers to the closest dispatch centers, reducing the delays caused by traditional closest cell tower routing.

Frequently Asked Questions (FAQ):

To speak to our analyst for a discussion on the above findings, click Speak to Analyst

TABLE OF CONTENTS
 
1 INTRODUCTION (Page No. - 37)
    1.1 STUDY OBJECTIVES 
    1.2 MARKET DEFINITION 
           1.2.1 INCLUSIONS & EXCLUSIONS
    1.3 STUDY SCOPE 
           1.3.1 MARKETS COVERED
                    FIGURE 1 MARKET SEGMENTATION
           1.3.2 GEOGRAPHIC SCOPE
                    FIGURE 2 MARKET: GEOGRAPHIC SCOPE
           1.3.3 YEARS CONSIDERED
    1.4 CURRENCY CONSIDERED 
           TABLE 1 USD EXCHANGE RATES, 2020–2022
    1.5 STAKEHOLDERS 
 
2 RESEARCH METHODOLOGY (Page No. - 41)
    2.1 RESEARCH DATA 
           FIGURE 3 MARKET: RESEARCH DESIGN
           2.1.1 SECONDARY DATA
                    2.1.1.1 Secondary sources
           2.1.2 PRIMARY DATA
                    2.1.2.1 Primary interviews with experts
                    2.1.2.2 Breakdown of primaries
                    2.1.2.3 Primary sources
                    2.1.2.4 Key industry insights
    2.2 MARKET SIZE ESTIMATION 
           FIGURE 4 MARKET SIZE ESTIMATION METHODOLOGY - APPROACH 1 (SUPPLY-SIDE): REVENUE OF OFFERINGS IN MARKET
           FIGURE 5 MARKET SIZE ESTIMATION METHODOLOGY - APPROACH 2 (DEMAND-SIDE):  MARKET
           2.2.1 TOP-DOWN APPROACH
                    FIGURE 6 TOP-DOWN APPROACH
           2.2.2 BOTTOM-UP APPROACH
                    FIGURE 7 BOTTOM-UP APPROACH
    2.3 MARKET BREAKDOWN AND DATA TRIANGULATION 
           FIGURE 8 DATA TRIANGULATION
           TABLE 2 FACTOR ANALYSIS
    2.4 RESEARCH ASSUMPTIONS 
    2.5 LIMITATIONS 
    2.6 MARKET: RECESSION IMPACT 
 
3 EXECUTIVE SUMMARY (Page No. - 52)
    FIGURE 9 MARKET,  2021–2028 (USD MILLION) 
    FIGURE 10 MARKET: REGIONAL SHARE, 2023 
 
4 PREMIUM INSIGHTS (Page No. - 55)
    4.1 BRIEF OVERVIEW OF MARKET 
           FIGURE 11 GROWING ADOPTION OF CLOUD COMPUTING TO ACT AS OPPORTUNITY IN MARKET
    4.2 NORTH AMERICA: MARKET, BY OFFERING AND COUNTRY 
           FIGURE 12 HARDWARE SEGMENT AND US TO ACCOUNT FOR DOMINANT SHARES IN NORTH AMERICA
    4.3 ASIA PACIFIC: MARKET, BY OFFERING AND TOP 3 COUNTRIES 
           FIGURE 13 HARDWARE SEGMENT AND CHINA TO DOMINATE MARKET IN ASIA PACIFIC
    4.4 MARKET,  BY END USER 
           FIGURE 14 PSAPS TO ACCOUNT FOR LARGEST SHARE
 
5 MARKET OVERVIEW AND INDUSTRY TRENDS (Page No. - 57)
    5.1 NEXT-GENERATION EMERGENCY RESPONSE SYSTEM MARKET OVERVIEW 
    5.2 MARKET DYNAMICS 
           FIGURE 15 DRIVERS, RESTRAINTS, OPPORTUNITIES, AND CHALLENGES: MARKET
           5.2.1 DRIVERS
                    5.2.1.1 Increased technological advancements in communication infrastructure
                    5.2.1.2 Proliferation of Internet of Things (IoT), smart cities, connected vehicles, and wearables
                    5.2.1.3 Growing need for enhanced emergency communication
           5.2.2 RESTRAINTS
                    5.2.2.1 Cost and infrastructure challenges
                    5.2.2.2 Data security and privacy concerns
           5.2.3 OPPORTUNITIES
                    5.2.3.1 Government initiatives and regulations
                    5.2.3.2 Adoption of cloud computing
           5.2.4 CHALLENGES
                    5.2.4.1 Cybersecurity risks
                    5.2.4.2 Scalability and flexibility
    5.3 INDUSTRY TRENDS 
           5.3.1 BRIEF HISTORY OF MARKET
                    FIGURE 16 BRIEF HISTORY OF NEXT-GENERATION EMERGENCY RESPONSE SYSTEM
                    5.3.1.1 2000–2010
                    5.3.1.2 2010–2020
                    5.3.1.3 2020–Present
           5.3.2 VALUE CHAIN ANALYSIS
                    FIGURE 17 NEXT-GENERATION EMERGENCY RESPONSE SYSTEM MARKET:  VALUE CHAIN ANALYSIS
           5.3.3 ECOSYSTEM
                    FIGURE 18 NEXT-GENERATION EMERGENCY RESPONSE SYSTEM ECOSYSTEM
                    TABLE 3 MARKET: ECOSYSTEM
           5.3.4 PATENT ANALYSIS
                    5.3.4.1 Methodology
                               FIGURE 19 LIST OF MAJOR PATENTS FOR NEXT-GENERATION EMERGENCY RESPONSE SYSTEM
                               TABLE 4 LIST OF MAJOR PATENTS
           5.3.5 USE CASES
                    5.3.5.1 Cisco helped city of San Luis Potosi to improve physical security of citizens
                    5.3.5.2 Honeywell intelligently secured and transformed Pristina International Airport
                    5.3.5.3 Government of India used NEC biometric identification system for over one billion people
                    5.3.5.4 Secom eliminated need for manned guarding at  speedy hire
                    5.3.5.5 Dublin Airport implemented ADT’s video management system
           5.3.6 PRICING ANALYSIS
                    5.3.6.1 Average selling price trend of key players, by technology
                               FIGURE 20 AVERAGE SELLING PRICE TREND OF KEY PLAYERS, BY HARDWARE
                               TABLE 5 AVERAGE SELLING PRICE OF KEY PLAYERS, BY HARDWARE
                    5.3.6.2 Indicative pricing analysis of next-generation emergency response systems, by offering
                               TABLE 6 INDICATIVE PRICING ANALYSIS OF NEXT-GENERATION EMERGENCY RESPONSE SYSTEMS, BY OFFERING
           5.3.7 TECHNOLOGY ANALYSIS
                    5.3.7.1 Key technologies
                               5.3.7.1.1 Internet of Things (IoT)
                               5.3.7.1.2 Geographic Information System (GIS)
                               5.3.7.1.3 AI & ML
                    5.3.7.2 Complementary technologies
                               5.3.7.2.1 Voice over Internet Protocol (VoIP)
                               5.3.7.2.2 5G
                    5.3.7.3 Adjacent technologies
                               5.3.7.3.1 Blockchain Technology
                               5.3.7.3.2 Edge Computing
           5.3.8 PORTER’S FIVE FORCES ANALYSIS
                    TABLE 7 NEXT-GENERATION EMERGENCY RESPONSE SYSTEM MARKETMARKET: PORTER’S FIVE FORCES MODEL ANALYSIS
                    FIGURE 21 MARKET: PORTER’S FIVE FORCES MODEL
                    5.3.8.1 Threat of new entrants
                    5.3.8.2 Threat of substitutes
                    5.3.8.3 Bargaining power of buyers
                    5.3.8.4 Bargaining power of suppliers
                    5.3.8.5 Intensity of competitive rivalry
           5.3.9 BEST PRACTICES IN MARKET
           5.3.10 CURRENT AND EMERGING BUSINESS MODELS
                    5.3.10.1 Traditional Model
                    5.3.10.2 Subscription Model
                    5.3.10.3 Data-as-a-service (DaaS) Model
                    5.3.10.4 Crowdsourcing Model
           5.3.11 DISRUPTIONS IMPACTING BUYERS/CUSTOMERS IN MARKET
                    FIGURE 22 DISRUPTION TRENDS IMPACTING BUYERS/CUSTOMERS IN MARKET
           5.3.12 KEY CONFERENCES & EVENTS IN 2024
                    TABLE 8 MARKET: DETAILED LIST OF CONFERENCES & EVENTS
           5.3.13 KEY STAKEHOLDERS & BUYING CRITERIA
                    5.3.13.1 Key stakeholders in buying process
                               FIGURE 23 INFLUENCE OF STAKEHOLDERS ON BUYING PROCESS FOR TOP THREE END USERS
                               TABLE 9 INFLUENCE OF STAKEHOLDERS ON BUYING PROCESS FOR TOP THREE END USERS (%)
                    5.3.13.2 Buying criteria
                               FIGURE 24 KEY BUYING CRITERIA FOR TOP THREE END USERS
                               TABLE 10 KEY BUYING CRITERIA FOR TOP THREE END USERS
           5.3.14 FUTURE LANDSCAPE OF MARKET
                    5.3.14.1 Next-generation emergency response system technology roadmap till 2030
                               5.3.14.1.1 Short-term roadmap (2024–2026)
                               5.3.14.1.2 Mid-term roadmap (2026–2028)
                               5.3.14.1.3 Long-term roadmap (2028–2030)
           5.3.15 REGULATORY LANDSCAPE
                    5.3.15.1 REGULATORY BODIES, GOVERNMENT AGENCIES, AND OTHER ORGANIZATIONS
                               TABLE 11 NORTH AMERICA: LIST OF REGULATORY BODIES, GOVERNMENT AGENCIES, AND OTHER ORGANIZATIONS
                               TABLE 12 EUROPE: LIST OF REGULATORY BODIES, GOVERNMENT AGENCIES, AND OTHER ORGANIZATIONS
                               TABLE 13 ASIA PACIFIC: LIST OF REGULATORY BODIES, GOVERNMENT AGENCIES, AND OTHER ORGANIZATIONS
                               TABLE 14 MIDDLE EAST & AFRICA: LIST OF REGULATORY BODIES, GOVERNMENT AGENCIES, AND OTHER ORGANIZATIONS
                               TABLE 15 LATIN AMERICA: REGULATORY BODIES, GOVERNMENT AGENCIES, AND OTHER ORGANIZATIONS
                    5.3.15.2 North America
                               5.3.15.2.1 US
                               5.3.15.2.2 Canada
                    5.3.15.3 Europe
                    5.3.15.4 Asia Pacific
                               5.3.15.4.1 South Korea
                               5.3.15.4.2 China
                               5.3.15.4.3 India
                    5.3.15.5 Middle East & Africa
                               5.3.15.5.1 UAE
                               5.3.15.5.2 KSA
                    5.3.15.6 Latin America
                               5.3.15.6.1 Brazil
                               5.3.15.6.2 Mexico
           5.3.16 HS CODES
                    5.3.16.1 Export Scenario
                               TABLE 16 EXPORT SCENARIO FOR HS CODE: 851762, BY COUNTRY, 2020–2022 (USD THOUSAND)
                    5.3.16.2 Import Scenario
                               TABLE 17 IMPORT SCENARIO FOR HS CODE: 851762, BY COUNTRY, 2020–2022 (USD THOUSAND)
           5.3.17 INVESTMENT AND FUNDING SCENARIO
 
6 NEXT-GENERATION EMERGENCY RESPONSE SYSTEM MARKET,  BY OFFERING (Page No. - 86)
    6.1 INTRODUCTION 
           FIGURE 25 HARDWARE SEGMENT TO DOMINATE MARKET DURING FORECAST PERIOD
           TABLE 18 MARKET, BY OFFERING,  2018–2022 (USD MILLION)
           TABLE 19 MARKET, BY OFFERING,  2023–2028 (USD MILLION)
           6.1.1 OFFERING: MARKET DRIVERS
    6.2 HARDWARE 
           6.2.1 GROWING NEED FOR ADVANCED EQUIPMENT TO DRIVE MARKET GROWTH
                    FIGURE 26 SWITCHING & ROUTING EQUIPMENT TO DOMINATE MARKET DURING FORECAST PERIOD
                    TABLE 20 MARKET, BY HARDWARE,  2018–2022 (USD MILLION)
                    TABLE 21 MARKET, BY HARDWARE,  2023–2028 (USD MILLION)
                    TABLE 22 HARDWARE: MARKET, BY REGION, 2018–2022 (USD MILLION)
                    TABLE 23 HARDWARE: MARKET, BY REGION, 2023–2028 (USD MILLION)
           6.2.2 SWITCHING & ROUTING EQUIPMENT
                    TABLE 24 SWITCHING & ROUTING EQUIPMENT: MARKET, BY REGION, 2018–2022 (USD MILLION)
                    TABLE 25 SWITCHING & ROUTING EQUIPMENT: MARKET, BY REGION, 2023–2028 (USD MILLION)
           6.2.3 CALL HANDLING SYSTEMS
                    TABLE 26 CALL HANDLING SYSTEMS: MARKET, BY REGION, 2018–2022 (USD MILLION)
                    TABLE 27 CALL HANDLING SYSTEMS: MARKET, BY REGION, 2023–2028 (USD MILLION)
           6.2.4 NETWORK INFRASTRUCTURE EQUIPMENT
                    TABLE 28 NETWORK INFRASTRUCTURE EQUIPMENT: MARKET, BY REGION, 2018–2022 (USD MILLION)
                    TABLE 29 NETWORK INFRASTRUCTURE EQUIPMENT: MARKET, BY REGION, 2023–2028 (USD MILLION)
           6.2.5 OTHER HARDWARE
                    TABLE 30 OTHER HARDWARE: MARKET,  BY REGION, 2018–2022 (USD MILLION)
                    TABLE 31 OTHER HARDWARE: MARKET,  BY REGION, 2023–2028 (USD MILLION)
    6.3 SOFTWARE 
           6.3.1 GROWING NEED FOR ADVANCED SOFTWARE TO DRIVE MARKET GROWTH
                    FIGURE 27 CALL MANAGEMENT SOFTWARE TO DOMINATE MARKET DURING FORECAST PERIOD
                    TABLE 32 MARKET, BY SOFTWARE,  2018–2022 (USD MILLION)
                    TABLE 33 MARKET, BY SOFTWARE,  2023–2028 (USD MILLION)
                    TABLE 34 SOFTWARE: MARKET, BY REGION, 2018–2022 (USD MILLION)
                    TABLE 35 SOFTWARE: MARKET, BY REGION, 2023–2028 (USD MILLION)
           6.3.2 CALL MANAGEMENT SOFTWARE
                    TABLE 36 CALL MANAGEMENT SOFTWARE: MARKET, BY REGION, 2018–2022 (USD MILLION)
                    TABLE 37 CALL MANAGEMENT SOFTWARE: MARKET, BY REGION, 2023–2028 (USD MILLION)
           6.3.3 LOCATION-BASED SERVICES SOFTWARE
                    TABLE 38 LOCATION-BASED SERVICES SOFTWARE: NEXT-GENERATION EMERGENCY RESPONSE SYSTEM MARKET, BY REGION, 2018–2022 (USD MILLION)
                    TABLE 39 LOCATION-BASED SERVICES SOFTWARE: MARKET, BY REGION, 2023–2028 (USD MILLION)
           6.3.4 TEXT MESSAGING SOFTWARE
                    TABLE 40 TEXT MESSAGING SOFTWARE: MARKET, BY REGION, 2018–2022 (USD MILLION)
                    TABLE 41 TEXT MESSAGING SOFTWARE: MARKET, BY REGION, 2023–2028 (USD MILLION)
           6.3.5 MULTIMEDIA SUPPORT SOFTWARE
                    TABLE 42 MULTIMEDIA SUPPORT SOFTWARE: MARKET, BY REGION, 2018–2022 (USD MILLION)
                    TABLE 43 MULTIMEDIA SUPPORT SOFTWARE: MARKET, BY REGION, 2023–2028 (USD MILLION)
           6.3.6 OTHER SOFTWARE
                    TABLE 44 OTHER SOFTWARE: MARKET,  BY REGION, 2018–2022 (USD MILLION)
                    TABLE 45 OTHER SOFTWARE: MARKET,  BY REGION, 2023–2028 (USD MILLION)
    6.4 SERVICES 
           6.4.1 INCREASING DEMAND FOR EFFICIENT AND RELIABLE SERVICES TO DRIVE MARKET GROWTH
                    FIGURE 28 PROFESSIONAL SERVICES TO DOMINATE MARKET DURING FORECAST PERIOD
                    TABLE 46 MARKET, BY SERVICE,  2018–2022 (USD MILLION)
                    TABLE 47 MARKET, BY SERVICE,  2023–2028 (USD MILLION)
                    TABLE 48 SERVICES: MARKET, BY REGION, 2018–2022 (USD MILLION)
                    TABLE 49 SERVICES: MARKET, BY REGION, 2023–2028 (USD MILLION)
           6.4.2 PROFESSIONAL SERVICES
                    FIGURE 29 CONSULTING SERVICES SEGMENT TO DOMINATE MARKET DURING FORECAST PERIOD
                    TABLE 50 MARKET, BY PROFESSIONAL SERVICE, 2018–2022 (USD MILLION)
                    TABLE 51 MARKET, BY PROFESSIONAL SERVICE, 2023–2028 (USD MILLION)
                    TABLE 52 PROFESSIONAL SERVICES: MARKET, BY REGION, 2018–2022 (USD MILLION)
                    TABLE 53 PROFESSIONAL SERVICES: MARKET, BY REGION, 2023–2028 (USD MILLION)
                    6.4.2.1 Training & Support Services
                               TABLE 54 TRAINING & SUPPORT SERVICES: MARKET, BY REGION, 2018–2022 (USD MILLION)
                               TABLE 55 TRAINING & SUPPORT SERVICES: MARKET, BY REGION, 2023–2028 (USD MILLION)
                    6.4.2.2 Consulting Services
                               TABLE 56 CONSULTING SERVICES: MARKET, BY REGION, 2018–2022 (USD MILLION)
                               TABLE 57 CONSULTING SERVICES: MARKET, BY REGION, 2023–2028 (USD MILLION)
                    6.4.2.3 Integration Services
                               TABLE 58 INTEGRATION SERVICES: MARKET, BY REGION, 2018–2022 (USD MILLION)
                               TABLE 59 INTEGRATION SERVICES: MARKET, BY REGION, 2023–2028 (USD MILLION)
           6.4.3 MANAGED SERVICES
                    TABLE 60 MANAGED SERVICES: MARKET,  BY REGION, 2018–2022 (USD MILLION)
                    TABLE 61 MANAGED SERVICES: MARKET,  BY REGION, 2023–2028 (USD MILLION)
 
7 NEXT-GENERATION EMERGENCY RESPONSE SYSTEM MARKET,  BY END USER (Page No. - 110)
    7.1 INTRODUCTION 
           FIGURE 30 PSAPS SEGMENT TO DOMINATE MARKET DURING FORECAST PERIOD
           TABLE 62 MARKET, BY END USER, 2018–2022 (USD MILLION)
           TABLE 63 MARKET, BY END USER, 2023–2028 (USD MILLION)
           7.1.1 END USER: MARKET DRIVERS
    7.2 PUBLIC SAFETY ANSWERING POINTS (PSAPS) 
           7.2.1 NEED FOR MORE ADVANCED AND INTEGRATED TECHNOLOGIES TO DRIVE MARKET
           7.2.2 USE CASE
                    7.2.2.1 Telecom CLM upgraded to enhanced public safety TETRA network utilizing Motorola Solutions’ DIMETRA X core
                               TABLE 64 PUBLIC SAFETY ANSWERING POINTS: MARKET, BY REGION, 2018–2022 (USD MILLION)
                               TABLE 65 PUBLIC SAFETY ANSWERING POINTS: MARKET, BY REGION, 2023–2028 (USD MILLION)
    7.3 LAW ENFORCEMENT AGENCIES 
           7.3.1 INCREASING DEMAND FOR RAPID DEPLOYMENT AND COORDINATION FOR EMERGENCY SERVICES TO PROPEL MARKET GROWTH
           7.3.2 USE CASE
                    7.3.2.1 Hamilton County Communications Center helped innovate 911 call handling with Intrado
                               TABLE 66 LAW ENFORCEMENT AGENCIES: MARKET, BY REGION, 2018–2022 (USD MILLION)
                               TABLE 67 LAW ENFORCEMENT AGENCIES: MARKET, BY REGION, 2023–2028 (USD MILLION)
    7.4 FIRE DEPARTMENTS 
           7.4.1 GROWING NEED FOR RELIABLE EMERGENCY RESPONSE SERVICES TO DRIVE MARKET GROWTH
           7.4.2 USE CASE
                    7.4.2.1 Bonnyville Regional Fire Authority integrated Zetron’s next-generation technology
                               TABLE 68 FIRE DEPARTMENTS: MARKET,  BY REGION, 2018–2022 (USD MILLION)
                               TABLE 69 FIRE DEPARTMENTS: MARKET,  BY REGION, 2023–2028 (USD MILLION)
    7.5 EMERGENCY MEDICAL SERVICES 
           7.5.1 INCREASING NEED FOR RAPID DEPLOYMENT OF EMERGENCY RESPONSE SYSTEMS TO DRIVE MARKET GROWTH
           7.5.2 USE CASE
                    7.5.2.1 Dutch ambulance service deployed latest in Motorola Solutions TETRA radios
                               TABLE 70 EMERGENCY MEDICAL SERVICES: MARKET, BY REGION, 2018–2022 (USD MILLION)
                               TABLE 71 EMERGENCY MEDICAL SERVICES: MARKET, BY REGION, 2023–2028 (USD MILLION)
    7.6 OTHER END USERS 
                    TABLE 72 OTHER END USERS: MARKET,  BY REGION, 2018–2022 (USD MILLION)
                    TABLE 73 OTHER END USERS: MARKET,  BY REGION, 2023–2028 (USD MILLION)
 
8 NEXT-GENERATION EMERGENCY RESPONSE SYSTEM MARKET,  BY REGION (Page No. - 119)
    8.1 INTRODUCTION 
                    FIGURE 31 MARKET: REGIONAL SNAPSHOT
                    FIGURE 32 ASIA PACIFIC TO ACCOUNT FOR HIGHEST CAGR DURING FORECAST PERIOD
                    TABLE 74 MARKET, BY REGION,  2018–2022 (USD MILLION)
                    TABLE 75 MARKET, BY REGION,  2023–2028 (USD MILLION)
    8.2 NORTH AMERICA 
           FIGURE 33 NORTH AMERICA: MARKET SNAPSHOT
           8.2.1 NORTH AMERICA: MARKET DRIVERS
           8.2.2 NORTH AMERICA: RECESSION IMPACT
                    TABLE 76 NORTH AMERICA: NEXT-GENERATION EMERGENCY RESPONSE SYSTEM MARKET,  BY OFFERING, 2018–2022 (USD MILLION)
                    TABLE 77 NORTH AMERICA: MARKET,  BY OFFERING, 2023–2028 (USD MILLION)
                    TABLE 78 NORTH AMERICA: MARKET,  BY HARDWARE, 2018–2022 (USD MILLION)
                    TABLE 79 NORTH AMERICA: MARKET,  BY HARDWARE, 2023–2028 (USD MILLION)
                    TABLE 80 NORTH AMERICA: MARKET,  BY SOFTWARE, 2018–2022 (USD MILLION)
                    TABLE 81 NORTH AMERICA: MARKET,  BY SOFTWARE, 2023–2028 (USD MILLION)
                    TABLE 82 NORTH AMERICA: MARKET,  BY SERVICE, 2018–2022 (USD MILLION)
                    TABLE 83 NORTH AMERICA: MARKET,  BY SERVICE, 2023–2028 (USD MILLION)
                    TABLE 84 NORTH AMERICA: MARKET,  BY PROFESSIONAL SERVICE, 2018–2022 (USD MILLION)
                    TABLE 85 NORTH AMERICA: MARKET,  BY PROFESSIONAL SERVICE, 2023–2028 (USD MILLION)
                    TABLE 86 NORTH AMERICA: MARKET,  BY END USER, 2018–2022 (USD MILLION)
                    TABLE 87 NORTH AMERICA: MARKET, BY END USER, 2023–2028 (USD MILLION)
                    TABLE 88 NORTH AMERICA: MARKET,  BY COUNTRY, 2018–2022 (USD MILLION)
                    TABLE 89 NORTH AMERICA: MARKET,  BY COUNTRY, 2023–2028 (USD MILLION)
           8.2.3 US
                    8.2.3.1 Key next-generation emergency response system players in region to drive market growth
                               TABLE 90 US: NEXT-GENERATION EMERGENCY RESPONSE SYSTEM MARKET, BY OFFERING,  2018–2022 (USD MILLION)
                               TABLE 91 US: MARKET, BY OFFERING,  2023–2028 (USD MILLION)
                               TABLE 92 US: MARKET, BY HARDWARE, 2018–2022 (USD MILLION)
                               TABLE 93 US: MARKET, BY HARDWARE, 2023–2028 (USD MILLION)
                               TABLE 94 US: MARKET, BY SOFTWARE,  2018–2022 (USD MILLION)
                               TABLE 95 US: MARKET, BY SOFTWARE,  2023–2028 (USD MILLION)
                               TABLE 96 US: MARKET, BY SERVICE,  2018–2022 (USD MILLION)
                               TABLE 97 US: MARKET, BY SERVICE,  2023–2028 (USD MILLION)
                               TABLE 98 US: MARKET, BY PROFESSIONAL SERVICE, 2018–2022 (USD MILLION)
                               TABLE 99 US: MARKET, BY PROFESSIONAL SERVICE, 2023–2028 (USD MILLION)
                               TABLE 100 US: MARKET, BY END USER,  2018–2022 (USD MILLION)
                               TABLE 101 US: MARKET, BY END USER,  2023–2028 (USD MILLION)
           8.2.4 CANADA
                    8.2.4.1 Increasing investments for better emergency services to propel market
    8.3 EUROPE 
           8.3.1 EUROPE: MARKET DRIVERS
                    8.3.2 EUROPE: RECESSION IMPACT
                    TABLE 102 EUROPE: NEXT-GENERATION EMERGENCY RESPONSE SYSTEM MARKET, BY OFFERING, 2018–2022 (USD MILLION)
                    TABLE 103 EUROPE: MARKET, BY OFFERING, 2023–2028 (USD MILLION)
                    TABLE 104 EUROPE: MARKET, BY HARDWARE, 2018–2022 (USD MILLION)
                    TABLE 105 EUROPE: MARKET, BY HARDWARE, 2023–2028 (USD MILLION)
                    TABLE 106 EUROPE: MARKET, BY SOFTWARE, 2018–2022 (USD MILLION)
                    TABLE 107 EUROPE: MARKET, BY SOFTWARE, 2023–2028 (USD MILLION)
                    TABLE 108 EUROPE: MARKET, BY SERVICE, 2018–2022 (USD MILLION)
                    TABLE 109 EUROPE: MARKET, BY SERVICE, 2023–2028 (USD MILLION)
                    TABLE 110 EUROPE: MARKET,  BY PROFESSIONAL SERVICE, 2018–2022 (USD MILLION)
                    TABLE 111 EUROPE: MARKET,  BY PROFESSIONAL SERVICE, 2023–2028 (USD MILLION)
                    TABLE 112 EUROPE: MARKET, BY END USER, 2018–2022 (USD MILLION)
                    TABLE 113 EUROPE: MARKET, BY END USER, 2023–2028 (USD MILLION)
                    TABLE 114 EUROPE: MARKET, BY COUNTRY, 2018–2022 (USD MILLION)
                    TABLE 115 EUROPE: MARKET, BY COUNTRY, 2023–2028 (USD MILLION)
           8.3.3 UK
                    8.3.3.1 Integration of smart devices and wearables to enhance real-time data transmission of emergency services to boost market
                               TABLE 116 UK: NEXT-GENERATION EMERGENCY RESPONSE SYSTEM MARKET, BY OFFERING,  2018–2022 (USD MILLION)
                               TABLE 117 UK: MARKET, BY OFFERING,  2023–2028 (USD MILLION)
                               TABLE 118 UK: MARKET, BY HARDWARE, 2018–2022 (USD MILLION)
                               TABLE 119 UK: MARKET, BY HARDWARE, 2023–2028 (USD MILLION)
                               TABLE 120 UK: MARKET, BY SOFTWARE,  2018–2022 (USD MILLION)
                               TABLE 121 UK: MARKET, BY SOFTWARE,  2023–2028 (USD MILLION)
                               TABLE 122 UK: MARKET, BY SERVICE,  2018–2022 (USD MILLION)
                               TABLE 123 UK: MARKET, BY SERVICE,  2023–2028 (USD MILLION)
                               TABLE 124 UK: MARKET, BY PROFESSIONAL SERVICE, 2018–2022 (USD MILLION)
                               TABLE 125 UK: MARKET, BY PROFESSIONAL SERVICE, 2023–2028 (USD MILLION)
                               TABLE 126 UK: MARKET, BY END USER,  2018–2022 (USD MILLION)
                               TABLE 127 UK: MARKET, BY END USER,  2023–2028 (USD MILLION)
           8.3.4 GERMANY
                    8.3.4.1 Growing initiatives for enhanced emergency services to propel market
           8.3.5 FRANCE
                    8.3.5.1 Need to provide reliable and efficient emergency response services to drive market
           8.3.6 ITALY
                    8.3.6.1 Adoption of advanced emergency response technologies to drive market
           8.3.7 REST OF EUROPE
    8.4 ASIA PACIFIC 
           FIGURE 34 ASIA PACIFIC: MARKET SNAPSHOT
           8.4.1 ASIA PACIFIC: MARKET DRIVERS
           8.4.2 ASIA PACIFIC: RECESSION IMPACT
                    TABLE 128 ASIA PACIFIC: NEXT-GENERATION EMERGENCY RESPONSE SYSTEM MARKET,  BY OFFERING, 2018–2022 (USD MILLION)
                    TABLE 129 ASIA PACIFIC: MARKET,  BY OFFERING, 2023–2028 (USD MILLION)
                    TABLE 130 ASIA PACIFIC: MARKET,  BY HARDWARE, 2018–2022 (USD MILLION)
                    TABLE 131 ASIA PACIFIC: MARKET,  BY HARDWARE, 2023–2028 (USD MILLION)
                    TABLE 132 ASIA PACIFIC: MARKET,  BY SOFTWARE, 2018–2022 (USD MILLION)
                    TABLE 133 ASIA PACIFIC: MARKET,  BY SOFTWARE, 2023–2028 (USD MILLION)
                    TABLE 134 ASIA PACIFIC: MARKET, BY SERVICE, 2018–2022 (USD MILLION)
                    TABLE 135 ASIA PACIFIC: MARKET, BY SERVICE, 2023–2028 (USD MILLION)
                    TABLE 136 ASIA PACIFIC: MARKET,  BY PROFESSIONAL SERVICE, 2018–2022 (USD MILLION)
                    TABLE 137 ASIA PACIFIC: MARKET,  BY PROFESSIONAL SERVICE, 2023–2028 (USD MILLION)
                    TABLE 138 ASIA PACIFIC: MARKET, BY END USER, 2018–2022 (USD MILLION)
                    TABLE 139 ASIA PACIFIC: MARKET, BY END USER, 2023–2028 (USD MILLION)
                    TABLE 140 ASIA PACIFIC: MARKET,  BY COUNTRY, 2018–2022 (USD MILLION)
                    TABLE 141 ASIA PACIFIC: MARKET,  BY COUNTRY, 2023–2028 (USD MILLION)
           8.4.3 CHINA
                    8.4.3.1 Increasing focus on providing innovative emergency response systems to drive market expansion
                               TABLE 142 CHINA: NEXT-GENERATION EMERGENCY RESPONSE SYSTEM MARKET, BY OFFERING, 2018–2022 (USD MILLION)
                               TABLE 143 CHINA: MARKET, BY OFFERING, 2023–2028 (USD MILLION)
                               TABLE 144 CHINA: MARKET, BY HARDWARE, 2018–2022 (USD MILLION)
                               TABLE 145 CHINA: MARKET, BY HARDWARE, 2023–2028 (USD MILLION)
                               TABLE 146 CHINA: MARKET, BY SOFTWARE, 2018–2022 (USD MILLION)
                               TABLE 147 CHINA: MARKET, BY SOFTWARE, 2023–2028 (USD MILLION)
                               TABLE 148 CHINA: MARKET, BY SERVICE, 2018–2022 (USD MILLION)
                               TABLE 149 CHINA: MARKET, BY SERVICE, 2023–2028 (USD MILLION)
                               TABLE 150 CHINA: MARKET, BY PROFESSIONAL SERVICE, 2018–2022 (USD MILLION)
                               TABLE 151 CHINA: MARKET, BY PROFESSIONAL SERVICE, 2023–2028 (USD MILLION)
                               TABLE 152 CHINA: MARKET, BY END USER, 2018–2022 (USD MILLION)
                               TABLE 153 CHINA: MARKET, BY END USER, 2023–2028 (USD MILLION)
           8.4.4 JAPAN
                    8.4.4.1 Increasing government initiatives for next-generation emergency response systems to propel market
           8.4.5 INDIA
                    8.4.5.1 Increasing government initiatives to improve emergency response infrastructure to drive market growth
           8.4.6 REST OF ASIA PACIFIC
    8.5 MIDDLE EAST & AFRICA 
           8.5.1 MIDDLE EAST & AFRICA: MARKET DRIVERS
           8.5.2 MIDDLE EAST & AFRICA: RECESSION IMPACT
                    TABLE 154 MIDDLE EAST & AFRICA: NEXT-GENERATION EMERGENCY RESPONSE SYSTEM MARKET, BY OFFERING, 2018–2022 (USD MILLION)
                    TABLE 155 MIDDLE EAST & AFRICA: MARKET, BY OFFERING, 2023–2028 (USD MILLION)
                    TABLE 156 MIDDLE EAST & AFRICA: MARKET, BY HARDWARE, 2018–2022 (USD MILLION)
                    TABLE 157 MIDDLE EAST & AFRICA: MARKET, BY HARDWARE, 2023–2028 (USD MILLION)
                    TABLE 158 MIDDLE EAST & AFRICA: MARKET, BY SOFTWARE, 2018–2022 (USD MILLION)
                    TABLE 159 MIDDLE EAST & AFRICA: MARKET, BY SOFTWARE, 2023–2028 (USD MILLION)
                    TABLE 160 MIDDLE EAST & AFRICA: MARKET, BY SERVICE, 2018–2022 (USD MILLION)
                    TABLE 161 MIDDLE EAST & AFRICA: MARKET, BY SERVICE, 2023–2028 (USD MILLION)
                    TABLE 162 MIDDLE EAST & AFRICA: MARKET, BY PROFESSIONAL SERVICE, 2018–2022 (USD MILLION)
                    TABLE 163 MIDDLE EAST & AFRICA: MARKET, BY PROFESSIONAL SERVICE, 2023–2028 (USD MILLION)
                    TABLE 164 MIDDLE EAST & AFRICA: MARKET, BY END USER, 2018–2022 (USD MILLION)
                    TABLE 165 MIDDLE EAST & AFRICA: MARKET, BY END USER, 2023–2028 (USD MILLION)
                    TABLE 166 MIDDLE EAST & AFRICA: MARKET, BY COUNTRY, 2018–2022 (USD MILLION)
                    TABLE 167 MIDDLE EAST & AFRICA: MARKET, BY COUNTRY, 2023–2028 (USD MILLION)
           8.5.3 GCC COUNTRIES
                    8.5.3.1 UAE
                               8.5.3.1.1 Growing digital transformations to boost market
                    8.5.3.2 KSA
                               8.5.3.2.1 Increasing transformation toward technological advancements and smart cities to drive market
                    8.5.3.3 Rest of GCC Countries
           8.5.4 SOUTH AFRICA
                    8.5.4.1 Growing public and private partnerships for enhanced emergency services to drive market expansion
           8.5.5 REST OF MIDDLE EAST & AFRICA
    8.6 LATIN AMERICA 
           8.6.1 LATIN AMERICA: MARKET DRIVERS
           8.6.2 LATIN AMERICA: RECESSION IMPACT
                    TABLE 168 LATIN AMERICA: NEXT-GENERATION EMERGENCY RESPONSE SYSTEM MARKET,  BY OFFERING, 2018–2022 (USD MILLION)
                    TABLE 169 LATIN AMERICA: MARKET,  BY OFFERING, 2023–2028 (USD MILLION)
                    TABLE 170 LATIN AMERICA: MARKET,  BY HARDWARE, 2018–2022 (USD MILLION)
                    TABLE 171 LATIN AMERICA: MARKET,  BY HARDWARE, 2023–2028 (USD MILLION)
                    TABLE 172 LATIN AMERICA: MARKET,  BY SOFTWARE, 2018–2022 (USD MILLION)
                    TABLE 173 LATIN AMERICA: MARKET,  BY SOFTWARE, 2023–2028 (USD MILLION)
                    TABLE 174 LATIN AMERICA: MARKET,  BY SERVICE, 2018–2022 (USD MILLION)
                    TABLE 175 LATIN AMERICA: MARKET,  BY SERVICE, 2023–2028 (USD MILLION)
                    TABLE 176 LATIN AMERICA: MARKET,  BY PROFESSIONAL SERVICE, 2018–2022 (USD MILLION)
                    TABLE 177 LATIN AMERICA: MARKET,  BY PROFESSIONAL SERVICE, 2023–2028 (USD MILLION)
                    TABLE 178 LATIN AMERICA: MARKET, BY END USER, 2018–2022 (USD MILLION)
                    TABLE 179 LATIN AMERICA: MARKET, BY END USER, 2023–2028 (USD MILLION)
                    TABLE 180 LATIN AMERICA: MARKET,  BY COUNTRY, 2018–2022 (USD MILLION)
                    TABLE 181 LATIN AMERICA: MARKET,  BY COUNTRY, 2023–2028 (USD MILLION)
           8.6.3 BRAZIL
                    8.6.3.1 Rising investments by multinational companies to boost adoption of next-generation emergency response systems to drive market
           8.6.4 MEXICO
                    8.6.4.1 Rising government initiatives and partnerships by large enterprises for enhanced emergency response systems to trigger market growth
           8.6.5 REST OF LATIN AMERICA
 
9 COMPETITIVE LANDSCAPE (Page No. - 163)
    9.1 OVERVIEW 
    9.2 KEY PLAYER STRATEGIES/RIGHT TO WIN 
           9.2.1 OVERVIEW OF STRATEGIES ADOPTED BY KEY NEXT-GENERATION EMERGENCY RESPONSE SYSTEM VENDORS
    9.3 REVENUE ANALYSIS 
           FIGURE 35 THREE-YEAR REVENUE ANALYSIS OF KEY PLAYERS
    9.4 MARKET SHARE ANALYSIS 
           TABLE 182 MARKET: DEGREE OF COMPETITION IN LAST 2 YEARS
           FIGURE 36 NEXT-GENERATION EMERGENCY RESPONSE SYSTEM MARKET SHARE ANALYSIS OF COMPANIES IN MARKET
           9.4.1 MARKET RANKING ANALYSIS
                    FIGURE 37 MARKET RANKING ANALYSIS OF TOP 5 PLAYERS
    9.5 COMPANY EVALUATION MATRIX: KEY PLAYERS, 2023 
           9.5.1 STARS
           9.5.2 EMERGING LEADERS
           9.5.3 PERVASIVE PLAYERS
           9.5.4 PARTICIPANTS
                    FIGURE 38 MARKET: COMPANY EVALUATION MATRIX (KEY PLAYERS), 2023
           9.5.5 COMPANY FOOTPRINT: KEY PLAYERS, 2023
                    FIGURE 39 COMPANY FOOTPRINT
                    TABLE 183 REGION FOOTPRINT
                    TABLE 184 OFFERING FOOTPRINT
                    TABLE 185 END USER FOOTPRINT
    9.6 COMPANY EVALUATION MATRIX: STARTUPS/SMES, 2023 
           9.6.1 PROGRESSIVE COMPANIES
           9.6.2 RESPONSIVE COMPANIES
           9.6.3 DYNAMIC COMPANIES
           9.6.4 STARTING BLOCKS
                    FIGURE 40 MARKET: STARTUP/SME EVALUATION MATRIX, 2023
           9.6.5 COMPETITIVE BENCHMARKING, 2023
                    TABLE 186 DETAILED LIST OF KEY STARTUPS/SMES
                    TABLE 187 COMPETITIVE BENCHMARKING OF KEY STARTUPS/SMES
    9.7 COMPETITIVE SCENARIO 
           9.7.1 PRODUCT LAUNCHES
                    TABLE 188 NEXT-EMERGENCY RESPONSE SYSTEM MARKET: PRODUCT LAUNCHES,  JUNE 2021–OCTOBER 2023
           9.7.2 DEALS
                    TABLE 189 NEXT-GENERATION EMERGENCY RESPONSE SYSTEM MARKET: DEALS, JULY 2021–DECEMBER 2023
    9.8 BRAND/PRODUCT COMPARISON 
           FIGURE 41 PROMINENT NEXT-GENERATION EMERGENCY RESPONSE SYSTEM SOLUTIONS
    9.9 COMPANY VALUATION AND FINANCIAL METRICS 
           FIGURE 42 VALUATION AND FINANCIAL METRICS OF KEY NEXT-GENERATION EMERGENCY RESPONSE SYSTEM VENDORS
 
10 COMPANY PROFILES (Page No. - 180)
     10.1 MAJOR PLAYERS 
(Business overview, Products/Solutions/Services offered, Recent developments, MnM view, Key Strengths, Strategic choices made, and Weaknesses and Competitive threats)*
             10.1.1 MOTOROLA SOLUTIONS
                       TABLE 190 MOTOROLA SOLUTIONS: COMPANY OVERVIEW
                       FIGURE 43 MOTOROLA SOLUTIONS: COMPANY SNAPSHOT
                       TABLE 191 MOTOROLA SOLUTIONS: PRODUCTS/SOLUTIONS/SERVICES OFFERED
                       TABLE 192 MOTOROLA SOLUTIONS: PRODUCT LAUNCHES
                       TABLE 193 MOTOROLA SOLUTIONS: DEALS
             10.1.2 AT&T
                       TABLE 194 AT&T: COMPANY OVERVIEW
                       FIGURE 44 AT&T: COMPANY SNAPSHOT
                       TABLE 195 AT&T: PRODUCTS/SOLUTIONS/SERVICES OFFERED
                       TABLE 196 AT&T: DEALS
             10.1.3 INTRADO
                       TABLE 197 INTRADO: COMPANY OVERVIEW
                       TABLE 198 INTRADO: PRODUCTS/SOLUTIONS/SERVICES OFFERED
                       TABLE 199 INTRADO: PRODUCT LAUNCHES
                       TABLE 200 INTRADO: DEALS
             10.1.4 HEXAGON
                       TABLE 201 HEXAGON: COMPANY OVERVIEW
                       FIGURE 45 HEXAGON: COMPANY SNAPSHOT
                       TABLE 202 HEXAGON: PRODUCTS/SOLUTIONS/SERVICES OFFERED
                       TABLE 203 HEXAGON: DEALS
             10.1.5 ESRI
                       TABLE 204 ESRI: COMPANY OVERVIEW
                       TABLE 205 ESRI: PRODUCTS/SOLUTIONS/SERVICES OFFERED
             10.1.6 SINCH
                       TABLE 206 SINCH: BUSINESS OVERVIEW
                       FIGURE 46 SINCH: COMPANY SNAPSHOT
                       TABLE 207 SINCH: PRODUCTS/SOLUTIONS/SERVICES OFFERED
                       TABLE 208 SINCH: DEALS
             10.1.7 ATOS
                       TABLE 209 ATOS: BUSINESS OVERVIEW
                       FIGURE 47 ATOS: COMPANY SNAPSHOT
                       TABLE 210 ATOS: PRODUCTS/SOLUTIONS/SERVICES OFFERED
             10.1.8 COMTECH
                       TABLE 211 COMTECH: COMPANY OVERVIEW
                       FIGURE 48 COMTECH: COMPANY SNAPSHOT
                       TABLE 212 COMTECH: PRODUCTS/SOLUTIONS/SERVICES OFFERED
                       TABLE 213 COMTECH: DEALS
             10.1.9 ZETRON
                       TABLE 214 ZETRON: COMPANY OVERVIEW
                       TABLE 215 ZETRON: PRODUCTS/SOLUTIONS/SERVICES OFFERED
                       TABLE 216 ZETRON: DEALS
              10.1.10 EVERBRIDGE
                                   TABLE 217 EVERBRIDGE: COMPANY OVERVIEW
                                   FIGURE 49 EVERBRIDGE: COMPANY SNAPSHOT
                                   TABLE 218 EVERBRIDGE: PRODUCTS/SOLUTIONS/SERVICES OFFERED
             10.1.11 AVAYA
             10.1.12 CISCO
*Details on Business overview, Products/Solutions/Services offered, Recent developments, MnM view, Key Strengths, Strategic choices made, and Weaknesses and Competitive threats might not be captured in case of unlisted companies.
     10.2 STARTUPS/SMES 
             10.2.1 RAPIDSOS
             10.2.2 NGA
             10.2.3 CONVEY 911
             10.2.4 BOOST PRO SYSTEMS
             10.2.5 SIMOCO WIRELESS SOLUTIONS
             10.2.6 SEON GROUP
             10.2.7 CARBYNE
             10.2.8 RAPIDDEPLOY
 
11 ADJACENT/RELATED MARKETS (Page No. - 211)
     11.1 INTRODUCTION TO ADJACENT MARKETS 
               TABLE 219 ADJACENT MARKETS AND FORECASTS
     11.2 LIMITATIONS 
     11.3 PUBLIC SAFETY AND SECURITY MARKET 
             11.3.1 MARKET DEFINITION
                       TABLE 220 PUBLIC SAFETY AND SECURITY MARKET, BY COMPONENT, 2015–2020 (USD MILLION)
                       TABLE 221 PUBLIC SAFETY AND SECURITY MARKET, BY COMPONENT, 2021–2027 (USD MILLION)
                       TABLE 222 PUBLIC SAFETY AND SECURITY MARKET, BY SOLUTION, 2015–2020 (USD MILLION)
                       TABLE 223 PUBLIC SAFETY AND SECURITY MARKET, BY SOLUTION, 2021–2027 (USD MILLION)
                       TABLE 224 PUBLIC SAFETY AND SECURITY MARKET, BY SERVICE, 2015–2020 (USD MILLION)
                       TABLE 225 PUBLIC SAFETY AND SECURITY MARKET, BY SERVICE, 2021–2027 (USD MILLION)
                       TABLE 226 PUBLIC SAFETY AND SECURITY MARKET, BY VERTICAL, 2015–2020 (USD MILLION)
                       TABLE 227 PUBLIC SAFETY AND SECURITY MARKET, BY VERTICAL, 2021–2027 (USD MILLION)
                       TABLE 228 PUBLIC SAFETY AND SECURITY MARKET, BY REGION, 2015–2020 (USD MILLION)
                       TABLE 229 PUBLIC SAFETY AND SECURITY MARKET, BY REGION, 2021–2027 (USD MILLION)
     11.4 WIRELESS BROADBAND IN PUBLIC SAFETY MARKET 
             11.4.1 MARKET DEFINITION
                       TABLE 230 WIRELESS BROADBAND IN PUBLIC SAFETY MARKET, BY TECHNOLOGY,  2017–2020 (USD MILLION)
                       TABLE 231 WIRELESS BROADBAND IN PUBLIC SAFETY MARKET, BY TECHNOLOGY,  2020–2026 (USD MILLION)
                       TABLE 232 WIRELESS BROADBAND IN PUBLIC SAFETY MARKET, BY OFFERING,  2017–2020 (USD MILLION)
                       TABLE 233 WIRELESS BROADBAND IN PUBLIC SAFETY MARKET, BY OFFERING,  2020–2026 (USD MILLION)
                       TABLE 234 WIRELESS BROADBAND IN PUBLIC SAFETY MARKET, BY APPLICATION,  2017–2020 (USD MILLION)
                       TABLE 235 WIRELESS BROADBAND IN PUBLIC SAFETY MARKET, BY APPLICATION,  2020–2026 (USD MILLION)
                       TABLE 236 WIRELESS BROADBAND IN PUBLIC SAFETY MARKET, BY END USER,  2017–2020 (USD MILLION)
                       TABLE 237 WIRELESS BROADBAND IN PUBLIC SAFETY MARKET, BY END USER,  2020–2026 (USD MILLION)
                       TABLE 238 WIRELESS BROADBAND IN PUBLIC SAFETY MARKET, BY REGION,  2017–2020 (USD MILLION)
                       TABLE 239 WIRELESS BROADBAND IN PUBLIC SAFETY MARKET, BY REGION, 2020–2026 (USD MILLION)
 
12 APPENDIX (Page No. - 219)
     12.1 DISCUSSION GUIDE 
     12.2 KNOWLEDGESTORE: MARKETSANDMARKETS’  SUBSCRIPTION PORTAL 
     12.3 CUSTOMIZATION OPTIONS 
     12.4 RELATED REPORTS 
     12.5 AUTHOR DETAILS 

The study involved four major activities in estimating the current size of the global next generation emergency response system market. Exhaustive secondary research was done to collect information on the market, peer market, and parent market. The next step was to validate these findings, assumptions, and sizing with industry experts across the value chain through primary research. Both top-down and bottom-up approaches were employed to estimate the total market size of the next generation emergency response system. After that, the market breakup and data triangulation techniques were used to estimate the market size of segments and subsegments.

Secondary Research

In the secondary research process, various secondary sources, such as Bloomberg and BusinessWeek, have been referred to identify and collect information for this study. The secondary sources included annual reports, press releases, and investor presentations of companies; white papers; journals, such as Linux Journal and Container Journal, and articles from recognized authors, directories, and databases.

Primary Research

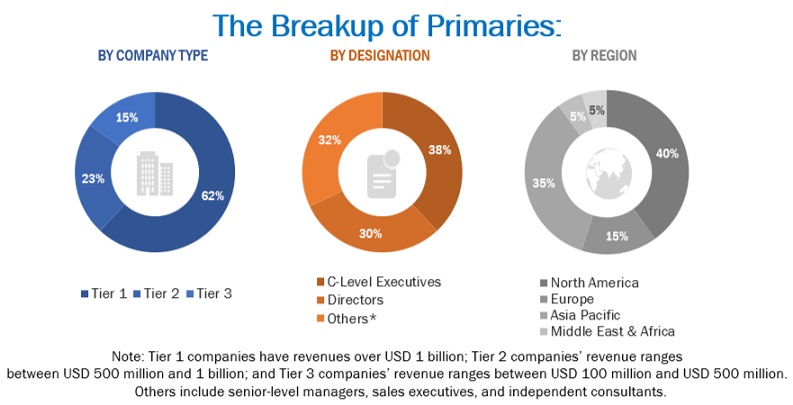
Various primary sources from both the supply and demand sides were interviewed to obtain qualitative and quantitative information for this report. The primary sources from the supply side included industry experts, such as Chief Executive Officers (CEOs), Chief Marketing Officers (CMO), Vice Presidents (VPs), Managing Directors (MDs), technology and innovation directors, and related key executives from various key companies and organizations operating in the next generation emergency response system market along with the associated service providers, and system integrators operating in the targeted regions. All possible parameters that affect the market covered in this research study have been accounted for, viewed in extensive detail, verified through primary research, and analyzed to get the final quantitative and qualitative data. Following is the breakup of primary respondents.
Next Generation Emergency Response System  Market Size, and Share

To know about the assumptions considered for the study, download the pdf brochure

Company Name

Designation

Avaya

Senior Manager

Convey 911

VP

Cisco

Business Executive

Market Size Estimation

For making market estimates and forecasting the next generation emergency response system market, and other dependent submarkets, the top-down and bottom-up approaches were used. The bottom-up procedure was used to arrive at the overall market size of the global next generation emergency response system market using key companies’ revenue and their offerings in the market. The research methodology used to estimate the market size includes the following:

  • The key players in the next generation emergency response system market have been identified through extensive secondary research.
  • The market size, in terms of value, has been determined through primary and secondary research processes.
  • All percentage shares, splits, and breakups have been determined using secondary sources and verified through primary sources.

Next generation emergency response system market Size: Bottom-Up Approach

Next Generation Emergency Response System  Market Bottom Up Approach

To know about the assumptions considered for the study, Request for Free Sample Report

Next generation emergency response system market Size: Top-Down Approach

Next Generation Emergency Response System  Market Top Down Approach

Data Triangulation

With data triangulation and validation through primary interviews, the exact value of the overall parent market size was determined and confirmed using this study. The overall market size was then used in the top-down procedure to estimate the size of other individual markets via percentage splits of the market segmentation.

Market Definition

The next generation emergency response systems market refers to the development, deployment, and maintenance of modernized emergency communication systems that enable faster response times, more accurate call routing, and better coordination during emergencies. These systems are designed to replace the aging analog-based infrastructure with a digital, internet protocol (IP)-based network that can handle a broader range of data, including voice, text, images, and videos.

Key Stakeholders

  • Emergency service providers
  • Technology providers
  • Network operators
  • Research and Development organizations
  • Healthcare providers
  • Law enforcement agencies
  • Non-Governmental Organizations (NGOs)
  • Technology consultants
  • Governments agencies
  • Insurance companies
  • System integrators
  • Telecommunications companies

Report Objectives

  • To determine, segment, and forecast the global next generation emergency response system market based on offering, end user, and region in terms of value.
  • To forecast the size of the market segments to five main regions: North America, Europe, Asia Pacific, Middle East & Africa, and Latin America.
  • To provide detailed information about the major factors (drivers, opportunities, threats, and challenges) influencing the growth of the next generation emergency response system market.
  • To study the complete value chain and related industry segments and perform a value chain analysis of the next generation emergency response system market landscape.
  • To strategically analyze the macro and micro markets to individual growth trends, prospects, and contributions to the total next generation emergency response system market.
  • To analyze the industry trends, patents, and innovations related to the next generation emergency response system market.
  • To analyze the opportunities for stakeholders by identifying the high-growth segments of the next generation emergency response system market.
  • To profile the key players in the market and comprehensively analyze their market share/ranking and core competencies.
  • Track and analyze competitive developments, such as mergers and acquisitions, product launches and developments, partnerships, agreements, collaborations, business expansions, and Research and development (R&D) activities.

Available Customizations

With the given market data, MarketsandMarkets offers customizations as per the company’s specific needs. The following customization options are available for the report:

Company Information

  • Detailed analysis and profiling of an additional two market players
Custom Market Research Services

We will customize the research for you, in case the report listed above does not meet with your exact requirements. Our custom research will comprehensively cover the business information you require to help you arrive at strategic and profitable business decisions.

Request Customization
Report Code
TC 8955
Published ON
Feb, 2024
Choose License Type
BUY NOW
  • SHARE
X
Request Customization
Speak to Analyst
Speak to Analyst
OR FACE-TO-FACE MEETING
PERSONALIZE THIS RESEARCH
  • Triangulate with your Own Data
  • Get Data as per your Format and Definition
  • Gain a Deeper Dive on a Specific Application, Geography, Customer or Competitor
  • Any level of Personalization
REQUEST A FREE CUSTOMIZATION
LET US HELP YOU!
  • What are the Known and Unknown Adjacencies Impacting the Next Generation Emergency Response System Market
  • What will your New Revenue Sources be?
  • Who will be your Top Customer; what will make them switch?
  • Defend your Market Share or Win Competitors
  • Get a Scorecard for Target Partners
CUSTOMIZED WORKSHOP REQUEST
+1-888-600-6441
  • Call Us
  • +1-888-600-6441 (Corporate office hours)
  • +1-888-600-6441 (US/Can toll free)
  • +44-800-368-9399 (UK office hours)
CONNECT WITH US
ABOUT TRUST ONLINE
©2024 MarketsandMarkets Research Private Ltd. All rights reserved
DMCA.com Protection Status Website Feedback