Plastomer Market by Application (Film-Food Packaging, Film-Non-Food Packaging, Film-Stretch & Shrink Film, Automotive, Wires & Cables, Polymer Modification, Medical and Others) and Region (Asia-Pacific, North America, Europe and Row) - Global Forecast to 2020


[124 Pages Report] The plastomer market is estimated to reach USD 5.33 Billion by 2020, at a CAGR of 7.4% between 2015 and 2020. The report covers the plastomers market by application (film-food packaging, film-non-food packaging, film-stretch & shrink film, automotive, wires & cables, polymer modification, medical, and others); and by region (North America, Europe, Asia-Pacific, and RoW). Base year considered for the study is 2014 while the forecast period is between 2015 and 2020.
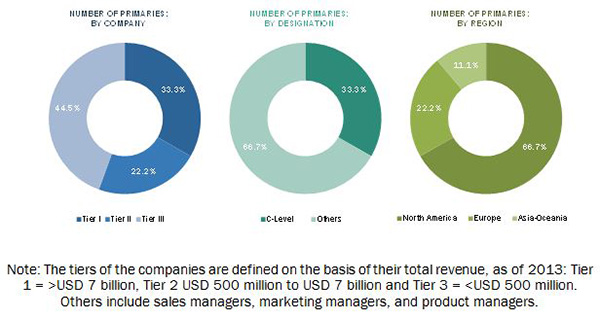
Both, top-down and bottom-up approaches have been used to estimate and validate the size of the global market and to estimate the sizes of various other dependent sub-markets in the overall plastomer market. The research study involved the use of extensive secondary sources, directories, and databases such as Hoovers, Bloomberg, Chemical Weekly, Factiva, and other government and private websites to identify and collect information useful for the technical, market-oriented, and commercial study of the global plastomer market. After arriving at the overall market size, the total market was split into several segments and sub-segments which are then verified through primary research by conducting extensive interviews with key people such as CEOs, VPs, Directors and executives. The breakdown of profiles of primary is depicted in the below figure.
The raw material for plastomers includes crude oil/natural gas. Polyolefins are produced by polymerization, wherein short-chain hydrocarbons are polymerized in the presence of catalysts to form long-chain polymers. The value chain of the plastomer market starts with the sourcing of basic raw materials. The value chain includes the manufacturing of plastomers and the delivery of the product for end-use applications. Some of the major applications of plastomers are film-food packaging, film-non-food packaging, film-stretch & shrink film, automotive, wires & cables, polymer modification, medical, and others.
Key target audience:
- Plastomers manufacturers
- Raw material suppliers
- Traders, distributors, and suppliers of plastomers
- Government and regional agencies and research organizations
- Investment research firms
Scope of the Report:
In this research report, the global plastomer market has been categorized on the basis of type, application, and region.
On the basis of application:
- Film-Food Packaging
- Film-Non-Food Packaging
- Film-Stretch & Shrink Film
- Automotive
- Wires & Cables
- Polymer Modification
- Medical
- Other applications (agriculture, industrial liners, artificial turf, and recreational products)
On the basis of region:
- North America
- Europe
- Asia-Pacific
- RoW
The market is further analyzed for the key countries in each of these regions.
Available Customizations:
With the given market data, MarketsandMarkets offers customizations according to the company’s specific needs. The following customization options are available for the report:
Regional Analysis:
- Country-level analysis of the Plastomer market by application.
Company Information:
- Detailed analysis and profiling of additional market players.
The market size of plastomers is estimated to reach USD 5.33 Billion by 2020, registering a CAGR of 7.4% between 2015 and 2020. The plastomer market is driven by its unique blend of properties of both, elastomers and plastics. Plastomers have narrow molecular weight distribution that differentiates them from regular plastics or elastomers for which they offer excellent sealing properties and are tough and clear. This is the prime factor responsible for the high demand for plastomers.
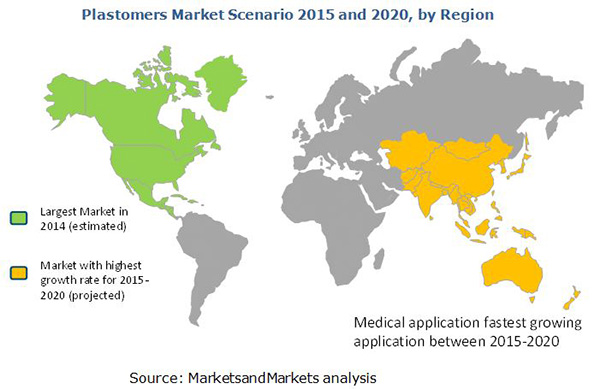
These are used in various applications such as film-food packaging, film-non-food packaging, film-stretch and shrink film, automotive, polymer modification, wires & cables, medical, and other applications. In 2014, the packaging application accounted for the largest market share among all the applications, in terms of value, followed by healthcare, water treatment, and pulp & paper applications, and film-food packaging application contributing to the maximum share. The plastomer market in the medical application segment is projected to witness the highest CAGR between 2015 and 2020, both, in terms of volume and value.
Film-food packaging is the largest application of plastomers followed by polymer modification and automotive. The plastomers industry has witnessed tremendous growth, especially in the Asia-Pacific region, due to stable economic conditions and high growth in end-use industries such as packaging, automotive, and polymer modification. The drivers of the growth are the increasing demand for plastomers products in emerging markets and high demand from end-use industries
The U.S. and Europe are the largest markets of packaged food. Growth in the packaged food industry depends on growth of population. Population in the U.S. was growing at 0.7% in 2013, while major countries in Europe, such as Germany and the U.K., were witnessing a slow population growth. The slow growth in population along with rise in importance of organic food products is affecting the market growth. Films manufactured for food packaging applications account for a major consumption of plastomers. Therefore, decrease in demand from the packaging industry of the U.S. and Europe restricts the growth of the global plastomer market.
The leading players manufacturing plastomers are The Dow Chemical Company (U.S.), Saudi Basic Industries Corporation (SABIC) (Saudi Arabia), Borealis AG (Austria), Mitsui Chemicals (Japan), LG Chem. Ltd. (South Korea), and ExxonMobil (U.S.). These companies have a strong foothold in the global plastomer market and are expected to account for a significant market share in the coming future. Entering into related industries and targeting new markets will enable manufacturers of plastomers to overcome the effects of volatile economy, leading to diversified business portfolio and increase their revenue.
 Exclusive indicates content/data unique to MarketsandMarkets and not available with any competitors.
Table of Contents
1 Introduction (Page No. - 14)
1.1 Objectives of the Study
1.2 Plastomer Market Definition
1.3 Market Scope
1.3.1 Markets Covered
1.3.2 Years Considered for the Study
1.4 Currency
1.5 Stakeholders
2 Research Methodology (Page No. - 17)
2.1 Research Data
2.1.1 Secondary Data
2.1.1.1 Key Data From Secondary Sources
2.1.2 Primary Data
2.1.2.1 Key Data From Primary Sources
2.1.2.2 Key Industry Insights
2.1.2.3 Breakdown of Primary Interviews
2.2 Plastomer Market Size Estimation
2.2.1 Bottom-Up Approach
2.2.2 Top-Down Approach
2.3 Market Breakdown and Data Triangulation
2.4 Research Assumptions and Limitations
2.4.1 Research Assumptions
2.4.2 Limitations
3 Executive Summary (Page No. - 25)
4 Premium Insights (Page No. - 29)
4.1 Attractive Opportunities in the Plastomer Market
4.2 Plastomers Applications in Asia-Pacific
4.3 Lifecycle Analysis, By Region, 2014
5 Market Overview (Page No. - 32)
5.1 Introduction
5.2 Plastomer Market Segmentation
5.2.1 By Region
5.3 Market Dynamics
5.3.1 Drivers
5.3.1.1 Growth in Packaging Industry
5.3.1.2 Improved Characteristics Over Conventional Plastics and Elastomers
5.3.2 Restraints
5.3.2.1 Slow Growth of Packaged Food Industry in U.S. and Europe
5.3.3 Opportunities
5.3.3.1 New and Emerging Applications
5.3.3.2 High Growth Opportunities in Cee, North Africa, and South America
5.3.4 Challenges
5.3.4.1 Competition From Other Polymers
6 Industry Trends (Page No. - 38)
6.1 Introduction
6.2 Value-Chain Analysis
6.2.1 Producers
6.2.2 Suppliers & Distributors
6.2.3 End-Use Industry
6.3 Porter’s Five Forces Analysis
6.3.1 Threat of New Entrants
6.3.2 Bargaining Power of Suppliers
6.3.3 Threat of Substitutes
6.3.4 Bargaining Power of Buyers
6.3.5 Intensity of Rivalry
7 Plastomer Market, By Application (Page No. - 43)
7.1 Introduction
7.2 Film-Food Packaging
7.3 Film-Non Food Packaging
7.4 Film- Stretch & Shrink
7.5 Automotive
7.6 Polymer Modification
7.7 Wires & Cables
7.8 Medical
7.9 Other Applications
8 Plastomer Market, By Region (Page No. - 57)
8.1 Introduction
8.2 North America
8.2.1 U.S.
8.2.2 Canada
8.2.3 Mexico
8.3 Europe
8.3.1 Germany
8.3.2 France
8.3.3 Italy
8.3.4 Rest of Europe
8.4 Asia-Pacific
8.4.1 China
8.4.2 Japan
8.4.3 India
8.4.4 South Korea
8.4.5 Rest of Asia-Pacific
8.5 RoW
8.5.1 South America
8.5.2 Middle East & Africa
9 Competitive Landscape (Page No. - 92)
9.1 Overview
9.2 New Product Development: the Most Popular Growth Strategy Between 2013 and 2015
9.2.1 New Product Development
9.2.2 Expansions
9.2.3 Partnerships & Collaborations
9.2.4 Mergers & Acquisitions
9.2.5 Agreements
9.2.6 Joint Venture
10 Company Profiles (Page No. - 98)
(Overview, Financial*, Products & Services, Strategy, and Developments)
10.1 Introduction
10.2 The DOW Chemical Company
10.3 Saudi Basic Industries Corporation (SaBIC)
10.4 Borealis AG
10.5 Mitsui Chemicals Inc.
10.6 LG Chem Ltd.
10.7 Exxonmobil
10.8 Sumitomo Corporation
10.9 SK Group
10.10 Alpha Group
10.11 Plastomer Corporation
*Details Might Not Be Captured in Case of Unlisted Companies.
11 Appendix (Page No. - 120)
11.1 Insights From Industry Experts
11.2 Discussion Guide
11.3 Introducing RT: Real Time Market Intelligence
11.4 Available Customizations
11.5 Related Reports
List of Tables (73 Tables)
Table 1 Plastomer Market, By Application
Table 2 Market Size, By Application (Kiloton), 2013-2020
Table 3 Market Size, By Application (USD Million), 2013-2020
Table 4 Plastomers Market Size in Film-Food Packaging (Kiloton), 2013-2020
Table 5 Market Size in Film-Food Packaging (USD Million), 2013-2020
Table 6 Market Size in Film- Non Food Packaging , (Kiloton), 2013-2020
Table 7 Market Size in Film- Nonfood Packaging Application (USD Million), 2013-2020
Table 8 Market Size in Film- Stretch & Shrink (Kiloton), 2013-2020
Table 9 Plastomer Market Size in Film- Stretch & Shrink (USD Million), 2013-2020
Table 10 Market Size in Automotive (Kiloton), 2013-2020
Table 11 Market Size in Automotive (USD Million), 2013-2020
Table 12 Market Size in Polymer Modification (Kiloton), 2013-2020
Table 13 Plastomers Market Size in Polymer Modification (USD Million), 2013-2020
Table 14 Market Size in Wires & Cables (Kiloton), 2013-2020
Table 15 Market Size in Wires & Cables (USD Million), 2013-2020
Table 16 Market Size in Medical (Kiloton), 2013-2020
Table 17 Market Size in Medical (USD Million), 2013-2020
Table 18 Plastomer Market Size in Other Applications (Kiloton), 2013-2020
Table 19 Market Size in Other Applications (USD Million), 2013-2020
Table 20 Plastomers Market Size, By Region, 2013-2020 (Kiloton)
Table 21 Market Size, By Region, 2013-2020 (USD Million)
Table 22 Market Size, By Application, 2013-2020 (Kiloton)
Table 23 Plastomer Market Size, By Application, 2013-2020 (USD Million)
Table 24 North America: Market Size, By Country, 2013-2020 (Kiloton)
Table 25 North America: Market Size, By Country, 2013-2020 (USD Million)
Table 26 North America: Market Size, By Application, 2013-2020 (Kiloton)
Table 27 North America: Market Size, By Application, 2013-2020 (USD Million)
Table 28 U.S.: Plastomer Market Size, By Application, 2013-2020 (Kiloton)
Table 29 U.S.: Market Size, By Application, 2013-2020 (USD Million)
Table 30 Canada: Plastomer Market Size, By Application, 2013-2020 (Kiloton)
Table 31 Canada: Plastomer Market Size, By Application, 2013-2020 (USD Million)
Table 32 Mexico: Plastomers Market Size, By Application, 2013-2020 (Kiloton)
Table 33 Mexico: Market Size, By Application, 2013-2020 (USD Million)
Table 34 Europe: Plastomer Market Size, By Country, 2013-2020 (Kiloton)
Table 35 Europe: Plastomer Market Size, By Country, 2013-2020 (USD Million)
Table 36 Europe: Plastomer Market Size, By Application, 2013-2020 (Kiloton)
Table 37 Europe: Plastomer Market Size, By Application, 2013-2020 (USD Million)
Table 38 Germany: Plastomer Market Size, By Application, 2013-2020 (Kiloton)
Table 39 Germany: Market Size, By Application, 2013-2020 (USD Million)
Table 40 France: Market Size, By Application, 2013-2020 (Kiloton)
Table 41 France: Market Size, By Application, 2013-2020 (USD Million)
Table 42 Italy: Plastomer Market Size, By Application, 2013-2020 (Kiloton)
Table 43 Italy: Plastomer Market Size, By Application, 2013-2020 (USD Million)
Table 44 Rest of Europe: Plastomer Market Size, By Application, 2013-2020 (Kiloton)
Table 45 Rest of Europe: Market Size, By Application, 2013-2020 (USD Million)
Table 46 Asia-Pacific: Plastomer Market Size, By Country, 2013-2020 (Kiloton)
Table 47 Asia-Pacific: Market Size, By Country, 2013-2020 (USD Million)
Table 48 Asia-Pacific: Market Size, By Application, 2013-2020 (Kiloton)
Table 49 Asia-Pacific: Market Size, By Application, 2013-2020 (USD Million)
Table 50 China: Plastomer Market Size, By Application, 2013-2020 (Kiloton)
Table 51 China: Plastomer Market Size, By Application, 2013-2020 (USD Million)
Table 52 Japan: Plastomer Market Size, By Application, 2013-2020 (Kiloton)
Table 53 Japan: Plastomers Market Size, By Application, 2013-2020 (USD Million)
Table 54 India: Market Size, By Application, 2013-2020 (Kiloton)
Table 55 India: Plastomer Market Size, By Application, 2013-2020 (USD Million)
Table 56 South Korea: Plastomer Market Size, By Application, 2013-2020 (Kiloton)
Table 57 South Korea: Market Size, By Application, 2013-2020 (USD Million)
Table 58 Rest of Asia-Pacific: Plastomer Market Size, By Application, 2013-2020 (Kiloton)
Table 59 Rest of Asia-Pacific: Market Size, By Application, 2013-2020 (USD Million)
Table 60 RoW: Plastomer Market Size, By Region, 2013-2020 (Kiloton)
Table 61 RoW: Plastomer Market Size, By Region, 2013-2020 (USD Million)
Table 62 RoW: Plastomer Market Size, By Application, 2013-2020 (Kiloton)
Table 63 RoW: Plastomer Market Size, By Application, 2013-2020 (USD Million)
Table 64 South America: Plastomer Market Size, By Application, 2013-2020 (Kiloton)
Table 65 South America: Market Size, By Application, 2013-2020 (USD Million)
Table 66 Middle East & Africa: Plastomer Market Size, By Application, 2013-2020 (Kiloton)
Table 67 Middle East & Africa: Plastomer Market Size, By Application, 2013-2020 (USD Million)
Table 68 New Product Development
Table 69 Expansions
Table 70 Partnerships & Collaborations
Table 71 Mergers & Acquisitions
Table 72 Agreements
Table 73 Joint Venture
List of Figures (40 Figures)
Figure 1 Research Design
Figure 2 Breakdown of Primary Interviews
Figure 3 Market Size Estimation: Bottom-Up Approach
Figure 4 Market Size Estimation: Top-Down Approach
Figure 5 Data Triangulation: Plastomer Market
Figure 6 Film-Food Packaging to Account for the Largest Share in the Plastomer Market Between 2015 and 2020 (USD Million)
Figure 7 Market Share By Region, 2014 (USD Million)
Figure 8 Market Size, 2015 vs 2020 (USD Million)
Figure 9 Plastomers Applications in Water Treatment Accounted for the Largest Share (Value) in Asia-Pacific, 2014
Figure 10 Lifecycle Analysis: European Plastomers Market Reaching Maturity
Figure 11 Plastomer Market Segmentation, By Region
Figure 12 Improved Charactrisitcs Over Conventional Materials Drive the Plastomer Market
Figure 13 Market: Value-Chain Analysis
Figure 14 Porter’s Five Forces Analysis of the Plastomers Market
Figure 15 Asia-Pacific Projected to Be the Fastest-Growing Market for Plastomers in Film- Food Processing Application, 2015-2020 (USD Million)
Figure 16 Asia-Pacific Projected to Be the Fastest-Growing Market of Plastomers in Film- Nonfood Packaging, 2015-2020 (USD Million)
Figure 17 North America Estimated to Be the Largest Market for Plastomers in Film- Stretch & Shrink in 2015 (USD Million)
Figure 18 Asia Pacific Projected to Be the Largest Market of Plastomers in Automotive, By 2020, (USD Million)
Figure 19 RoW Should Be the Fastest Growing Market of Plastomers in Polymer Modification , 2015-2020 (USD Million)
Figure 20 Asia-Pacific Plastomer Market is Projected to Surpass the North American Plastomers Market in Wires & Cables By 2020 (USD Million)
Figure 21 North America Estimated to Be the Largest Plastomer Market for Medical Application in 2015 (USD Million)
Figure 22 Europe Projected to Be the Largest Market for Plastomers in Other Applications, By 2020 (USD Million)
Figure 23 Regional Snapshot: Rapid Growth Markets are Emerging as New Hotspots
Figure 24 The U.S. Dominates the Plastomer Market in North American Region
Figure 25 European Market Snapshot, 2014: Country-Wise Market Size of Plastomers in Food & Nonfood Packaging, Polymer Modification, and Automotive (Kiloton)
Figure 26 China Dominates the Plastomer Market in Asia-Pacific Region
Figure 27 China to Account for A Major Share of Plastomers in Asia-Pacific in 2014 (Kiloton)
Figure 28 Companies Adopted New Product Development as the Key Growth Strategy Between 2013 and 2015
Figure 29 Top Companies Adopted New Product Development as the Key Growth Strategy Between 2013 and 2015
Figure 30 Major Growth Strategies for Acquiring Market Share, 2013-2015
Figure 31 DOW: Company Snapshot
Figure 32 DOW: SWOT Analysis
Figure 33 Saudi Basic Industries Corporation (SaBIC): Company Snapshot
Figure 34 Saudi Basic Industries Corporation (SaBIC): SWOT Analysis
Figure 35 Borealis AG: Company Snapshot
Figure 36 Mitsui Chemicals Inc.: Company Snapshot
Figure 37 LG Chem: Company Snapshot
Figure 38 Exxonmobil: Company Snapshot
Figure 39 Sumitomo Corporation: Company Snapshot
Figure 40 SK Group: Company Snapshot


Growth opportunities and latent adjacency in Plastomer Market