3D PA (Polyamide) Market by Application (Healthcare, Aerospace & Defense, Automotive, Electronics, Others), by Type (PA11, PA12), by Region (Asia-Pacific, Europe, North America, RoW), by Scenario One and Two - Global Forecasts to 2020


[121 Pages Report] The 3D PA (polyamide) market consisting of PA11 and PA12 is forecasted based on two scenarios as its growth is primarily based on the adoption of 3D printing technology by end-use industries. Scenario one represents comparatively normal growth whereas scenario two projects exponential growth. The 3D PA (polyamide) market is projected to reach USD 48.6 Million by 2020, at a CAGR of 26.59% from 2015 to 2020, by scenario one and USD 85.1 Million by 2020, at a CAGR of 41.2% from 2015 to 2020, by scenario two. Healthcare and aerospace & defense are expected to contribute the largest share to this market during the forecast period owing to the increasing use of 3D printing in manufacturing of highly customized products. Based on end users, the 3D PA (polyamide) market has been segmented into healthcare, aerospace & defense, automotive, electronics, and others. Based on types, the market has been segmented into PA11 and PA12 of which PA12 holds maximum market share.
The years considered for the study are:
- Base Year � 2014
- Estimated Year � 2015
- Projected Year � 2020
- Forecast Period � 2015 to 2020
For company profiles in the report, 2014 has been considered as the base year. Where information was unavailable for the base year, the prior year has been considered.
Research Methodology
This research study involves extensive usage of secondary sources, directories, and databases, such as Hoovers, Bloomberg, Businessweek, Factiva, and Avention to identify and collect information useful for technical, market-oriented, and commercial aspects of the 3D PA (polyamide) market. The research methodology used for this study can be explained as follows:
- Analysis of all recent developments in the polyamide market across the globe with emphasis on emerging regions
- Analysis of potential end users of PA11 and PA12 in 3D printing
- Analysis of country-wise rate of demand of PA11 and PA12 for the past three years
- Estimation of various costs involved to arrive at the value chain of 3D PA (polyamide) market
- Estimation of unit shipments of PA11 and PA12 and arriving at the total market size using market engineering process
- Finalization of market size values by triangulation with the supply side data, which includes, product developments, supply chain, and annual shipments of PA11 and PA12 across the globe
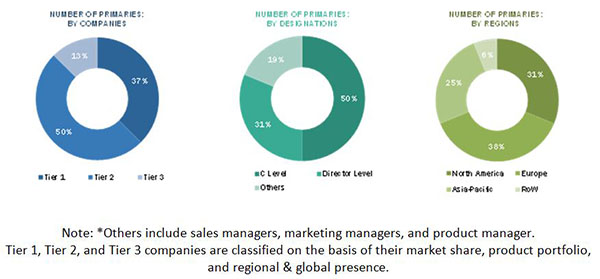
After arriving at the overall market size, the total market has been split into several segments and subsegments. The figure below shows the breakdown of primaries based on company, designation, and region conducted during the research study.
To know about the assumptions considered for the study, download the pdf brochure
Market Ecosystem:
The ecosystem for 3D PA (polyamide) market consists of key suppliers of raw materials, including monomers, catalysts, and other chemical agents. Monomers such as laurolactum and undecanoic acid are the key materials which are polymerized to form PA11 and PA12. Various companies such as Arkema SA, Evonik AG, and others have a backward integrated network to meet their production demands whereas EOS GmbH (Germany), 3D Systems (U.S.), and others modify the unfilled grades into specialized ones. The demand side of polyamide market comprises healthcare, aerospace & defense, automotive, electronics, and others.
Target Audience:
The stakeholder�s for the report includes:
- PA11 and PA12 Manufacturers, Dealers, and Suppliers
- Government Bodies
- 3D Printing Experts
- End-use Companies
- Companies Operational in Material R&D
- Defense and Military
- Feedstock Suppliers
- Industry Associations
- Large Infrastructure Companies
- Investment Banks
- Consulting Companies/Consultants in Chemical and Material Sectors
Scope of the Report: This research report categorizes the 3D PA (polyamide) market on the basis of type, end user, and region. The report has forecast volumes and revenues as well as analyzed trends in each of the submarkets.
On the basis of Type:
- PA11
- PA12
On the basis of End User:
- Healthcare
- Aerospace & Defense
- Automotive
- Electronics
- Others
On the basis of Region:
- North America
- Europe
- Asia-Pacific
- RoW
Available Customizations
With the given market data, MarketsandMarkets offers customizations according to the company�s specific needs. The following customization options are available for the report:
- Product Analysis: Product matrix that gives a detailed comparison of product portfolio of each company
- Regional Analysis: Further breakdown of a region with respect to a particular country
- Company Information: Detailed analysis and profiling of additional market players (up to five)
The 3D PA (polyamide) market consisting of PA11 and PA12 is projected to reach USD 48.6 Million by 2020, at a CAGR of 26.59%, by scenario one and USD 85.1 Million, at a CAGR of 41.2% from 2015 to 2020, by scenario two. The key factors responsible for this growth is its increased usage in healthcare and aerospace & defense sectors for customized products. As the market is dependent on the commercial growth of the 3D printing technology, this report has been prepared based on two scenarios where scenario one represents normal growth and scenario two represents exponential one. These scenarios are based on certain factors such as rate of adoption by end-use industries.
The healthcare and aerospace & defense segment contributed a major share to the market owing to the increased usage of PA11 & PA12 using 3D printing technology for highly customized products such as prosthetics, aerodynamic parts using various compositions. Moreover, many automobile companies are using PA11 and PA12 for rapid prototyping as well as manufacturing of customized parts. North America and Europe are the key markets for PA11 and PA12 in 3D printing with large number of suppliers and several end user companies in healthcare and aerospace & defense. The growth of PA11 and PA12 in 3D printing is largely dependent on the growth of 3D printing technology as an alternative to conventional manufacturing practices. Laser sintering in 3D printing is an important technology with many commercial applications where PA11 and PA12 are used in powdered form.
Based on type, the PA12 segment is expected to account for the largest share of PA11 and PA12 market in 3D printing in 2015. This segment is estimated to witness high growth owing to the high supply base and increased demand of PA12 in the production of specialized parts. PA11 is a bio-based specialty polyamide. It is environment-friendly and provides better performance than conventional thermoplastics. This is expected to result in the growth of bio-based & specialty segment globally from a strategic point of view.
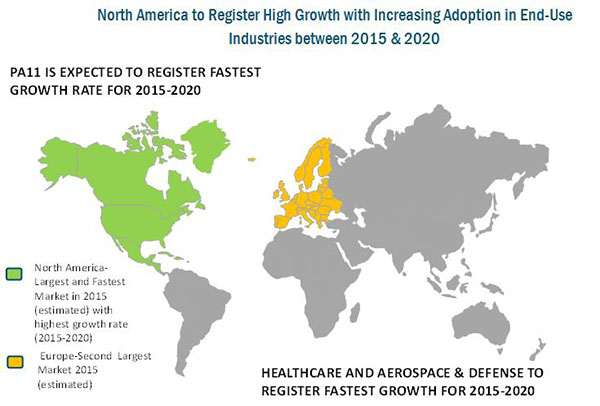
North America and Europe are expected to dominate the 3D PA (polyamide) market between 2015 and 2020 by both the scenarios due to high adoption rate of technologies in these regions. The growth of PA11 and PA12 market for 3D printing in North America & Europe is majorly driven by the increasing demand from healthcare and aerospace & defense. The U.S. is a major market in North America, followed by Canada and Mexico. Germany, France, and Italy are the key countries in the European 3D PA (polyamide) market. Asia-Pacific is estimated to be a potential market for 3D PA (polyamide) in future. This growth can be attributed to the presence of emerging economies such as China, India, Taiwan, and others as well as the growth in end user industries such as automotive, healthcare, and others in this region.
The increasing usage in healthcare and aerospace & defense sector for weight reduction is one of the key factors driving the growth of 3D PA (polyamide) market. Many grades of PA11 and PA12 can be used for medical applications. Some grades have carbon fiber additions to increase the material strength. PA12 has a greater availability due to established distribution system as compared to PA11 which is derived from castor seeds. However, companies such as Arkema SA, Evonik AG, and others, dealing primarily in specialty chemicals, have started operations in emerging markets to increase product supply in these regions. Other key companies supplying 3D PA (polyamide) materials includes EOS GmbH, 3D Systems, Stratasys, and others which have developed their own grades for 3D printing technology.
Estimating the future demand is a prime challenge for PA11 and PA12 suppliers owing to the economic slowdown that took place in the last decade. Many economies in the European region have still not recovered completely, which has affected the demand for PA11 and PA12 from major end user industries in this region. In Asia-Pacific, China witnessed lowest growth rates in the last decade. Manufacturing sector holds a key share in the GDP of China, and the slowdown in this sector will affect the PA11 and PA12 consumption as it will affect technology adoption. However, from a strategic point of view, China still holds the key to the growth of 3D PA (polyamide) market in Asia-Pacific region.
To speak to our analyst for a discussion on the above findings, click Speak to Analyst
 Exclusive indicates content/data unique to MarketsandMarkets and not available with any competitors.
Table of Content
1 Introduction
1.1 Market Definition
1.2 Objectives of the Study
1.3 Markets Covered
1.4 Stakeholders
1.5 Material Flow System
2 Research Methodology
2.1 3D PA (Polyamide) Market, By End-User Industry
2.2 Data Triangulation
2.3 Arriving at Global Market Size
2.3.1 Top Down Approach
2.3.2 Bottom-Up Approach
2.3.3 Demand-Side Approach
2.3.4 Supply-Side Approach
2.4 Assumptions
2.4.1 Growth Scenarios - 1 and 2
3 Executive Summary
3.1 Market Overview
3.2 Polyamide 11 & Polyamide 12: Comparison
3.3 Scenario One
3.4 Scenario Two
4 Premium Insights
4.1 Market Share Distribution
4.1.1 Polyamide 11 Market in 3D Printing
4.1.2 Polyamide 12 Market in 3D Printing
4.2 Global Scenario
4.2.1 Polyamide 11 Market in 3D Printing
4.2.2 Polyamide 12 Market in 3D Printing
4.3 Attractive Market Opportunities
4.3.1 Scenario 1
4.3.2 Scenario 2
5 Market Overview
5.1 Market Overview
5.2 Polyamide 11 and Polyamide12: Key Properties
5.3 Polyamide 11 and Polyamide 12: Material Flow Structure
5.4 Value Chain Analysis
5.5 Polyamide12 � Different Grades Available in Market
5.6 Market Dynamics
5.6.1 Drivers
5.6.2 Restraints
5.6.3 Opportunities
5.7 Peer Market Comparison
5.8 Market Trends in 3D Printing Materials Market
5.9 Substitutes of Polyamide11 and Polyamide 12 in 3D Printing
5.10 Porter�s Five Forces Model
6 3D Polyamide (Polyamide) Market in 3D Printing, By End User Industry
6.1 Comparison Between Scenario 1 & 2
6.2 Scenario 1
6.2.1 Polyamide 11 Market in 3D Printing
6.2.2 Polyamide 12 Market in 3D Printing
6.3 Scenario 2
6.3.1 Polyamide 11 Market in 3D Printing
6.3.2 Polyamide 12 Market in 3D Printing
7 3D Polyamide (Polyamide) Market in 3D Printing, By Geography
7.1 Comparison Between Scenario 1 & 2
7.2 North America
7.2.1 Scenario 1 & 2: Polyamide 11 Market
7.2.2 Scenario 1 & 2: Polyamide 12 Market
7.3 Europe
7.3.1 Scenario 1 & 2: Polyamide 11 Market
7.3.2 Scenario 1 & 2: Polyamide 12 Market
7.4 Asia-Pacific
7.4.1 Scenario 1 & 2: Polyamide 11 Market
7.4.2 Scenario 1 & 2: Polyamide 12 Market
7.5 Rest of the World
7.5.1 Scenario 1 & 2: Polyamide 11 Market
7.5.2 Scenario 1 & 2: Polyamide 12 Market
8 Competitive Landscape
8.1 Competitive Situation & Trends
8.1.1 Overview
8.1.2 By Developments
8.1.3 By Company
8.1.4 By Recent Years
8.2 Recent Developments
9 Company Profiles
9.1 Geographic Revenue Mix of Key Players
9.2 3D Systems
9.2.1 Company Overview
9.2.2 Key Developments
9.2.3 SWOT Analysis
9.2.4 MnM View
9.3 Stratasys, Ltd.
9.3.1 Company Overview
9.3.2 Key Developments
9.3.3 SWOT Analysis
9.3.4 MnM View
9.4 Evonik Industries AG
9.4.1 Company Overview
9.4.2 Key Developments
9.4.3 SWOT Analysis
9.4.4 MnM View
9.5 Arkema S.A.
9.5.1 Company Overview
9.5.2 Key Developments
9.5.3 SWOT Analysis
9.5.4 MnM View
9.6 EOS GmbH
9.6.1 Company Overview
9.6.2 Product Portfolio
9.6.3 Key Developments
9.6.4 SWOT Analysis
9.6.5 MnM View
9.7 CRP Group
9.7.1 Company Overview
9.7.2 Product Portfolio
9.7.3 MnM View
9.8 Golden Plastics
9.8.1 Company Overview
9.8.2 Product Portfolio
9.8.3 MnM View
List of Tables (39 Tables)
Table 1 Comparison Between Polyamide 11 & Polyamide 12, By Properties
Table 2 Polyamide 11 & Polyamide 12 Market in 3D Printing: Comparison Between Scenario 1 and Scenario 2, 2013-2020 (USD Million)
Table 3 Key Properties of Polyamide 11 & Polyamide 12
Table 4 Scenario 1: Polyamide 11 Market in 3D Printing, By End User Industry, 2013-2020 (Tons)
Table 5 Scenario 1: Polyamide 11 Market in 3D Printing, By End User Industry, 2013-2020 (USD Million)
Table 6 Scenario 1: Polyamide 12 Market in 3D Printing, By End User Industry, 2013-2020 (Tons)
Table 7 Scenario 1: Polyamide 12 Market in 3D Printing, By End User Industry, 2013-2020 (USD Million)
Table 8 Scenario 2: Polyamide 11 Market in 3D Printing, By End User Industry, 2013-2020 (Tons)
Table 9 Scenario 2: Polyamide 11 Market in 3D Printing, By End User Industry, 2013-2020 (USD Million)
Table 10 Scenario 2: Polyamide 12 Market in 3D Printing, By End User Industry, 2013-2020 (Tons)
Table 11 Scenario 2: Polyamide 12 Market in 3D Printing, By End User Industry, 2013-2020 (USD Million)
Table 12 Scenario 1 & 2: North America Polyamide 11 Market in 3D Printing, 2013-2020 (Tons)
Table 13 Scenario 1 & 2: North America Polyamide 11 Market in 3D Printing, 2013-2020 (USD Million)
Table 14 Scenario 1 & 2: North America Polyamide 12 Market in 3D Printing, 2013-2020 (Tons)
Table 15 Scenario 1 & 2: North America Polyamide 12 Market in 3D Printing, 2013-2020 (USD Million)
Table 16 Scenario 1 & 2: Europe Polyamide 11 Market in 3D Printing, 2013-2020 (Tons)
Table 17 Scenario 1 & 2: Europe Polyamide 11 Market in 3D Printing, 2013-2020 (USD Million)
Table 18 Scenario 1 & 2: Europe Polyamide 12 Market in 3D Printing, 2013-2020 (Tons)
Table 19 Scenario 1 & 2: Europe Polyamide 12 Market in 3D Printing, 2013-2020 (USD Million)
Table 20 Scenario 1 & 2: Asia-Pacific Polyamide 11 Market in 3D Printing, 2013-2020 (Tons)
Table 21 Scenario 1 & 2: Asia-Pacific Polyamide 11 Market in 3D Printing, 013-2020 (USD Million)
Table 22 Scenario 1 & 2: Asia-Pacific Polyamide 12 Market in 3D Printing, 2013-2020 (Tons)
Table 23 Scenario 1 & 2: Asia-Pacific Polyamide 12 Market in 3D Printing, 2013-2020 (USD Million)
Table 24 Scenario 1 & 2: RoW Polyamide 11 Market in 3D Printing, 2013-2020 (Tons)
Table 25 Scenario 1 & 2: RoW Polyamide 11 Market in 3D Printing, 2013-2020 (USD Million)
Table 26 Scenario 1 & 2: RoW Polyamide 12 Market in 3D Printing, 2013-2020 (Tons)
Table 27 Scenario 1 & 2: RoW Polyamide 12 Market in 3D Printing, 2013-2020 (USD Million)
Table 28 3D PA (Polyamide) Market: New Product/ Service/ Technology Launch
Table 29 Polyamide 11 &12 Market in 3D Printing: Mergers and Acquisitions
Table 30 Polyamide 11 &12 Market in 3D Printing: Expansions and Investments
Table 31 Polyamide 11 &12 Market in 3D Printing: Agreements and Joint Ventures
Table 32 3D Systems: Key Developments
Table 33 Stratasys, Ltd.: Key Developments
Table 34 Evonik Industries AG: Key Developments
Table 35 Arkema S.A.: Key Developments
Table 36 EOS GmbH: Product Portfolio
Table 37 EOS GmbH: Key Developments
Table 38 CRP Group: Products and Services
Table 39 Golden Plastics: Product Portfolio
List of Figures (57 Figures)
Figure 1 3D PA (Polyamide) Market: Market Segmentation
Figure 2 3D PA (Polyamide) Market: Material Flow System
Figure 3 3D PA (Polyamide) Market: End User Industry
Figure 4 3D PA (Polyamide) Market: Data Triangulation
Figure 5 Arriving at Global Market Size: Top-Down Approach
Figure 6 Arriving at Global Market Size: Bottom-Up Approach
Figure 7 Arriving at Global Market Size: Demand Side Approach
Figure 8 Arriving at Global Market Size: Supply Side Approach
Figure 9 3D PA (Polyamide) Market: Years Considered for the Study
Figure 10 Polyamide 11 Market in 3D Printing: Market Share Distribution, 2015
Figure 11 Polyamide 12 Market in 3D Printing: Market Share Distribution, 2015
Figure 12 Polyamide 11 Marketing in 3D Printing: Global Scenario
Figure 13 Polyamide 12 Market in 3D Printing: Global Scenario
Figure 14 Scenario 1 - Polyamide 11 &12 Market in 3D Printing: Attractive Market Opportunities
Figure 15 Scenario-2 - Polyamide 11 &12 Market in 3D Printing: Attractive Market Opportunities
Figure 16 Polyamide 11 &12 Market in 3D Printing: Comparison Between Scenario 1 and Scenario 2, 2014-2020 (%)
Figure 17 Polyamide 11 &12 Market in 3D Printing: Material Flow Structure
Figure 18 Polyamide 11 &12 Market in 3D Printing: Value Chain Analysis
Figure 19 Polyamide 12 - Different Grades Available in Market
Figure 20 Polyamide 11 &12 Market in 3D Printing: Market Dynamics
Figure 21 Polyamide 11 &12 Market in 3D Printing: Peer Market Comparison
Figure 22 Polyamide 11 &12 Market in 3D Printing: Porter�s Five Forces Model
Figure 23 Polyamide 11 &12 Market in 3D Printing: Comparison Between Scenario 1 & 2 By End User, 2013-2015 (Tons)
Figure 24 Scenario 1: Polyamide 11 Market in 3D Printing, By End User Industry, 2013-2020 (Tons)
Figure 25 Scenario 1: Polyamide 11 Market in 3D Printing, By End User Industry, 2013-2020 (USD Million)
Figure 26 Scenario 1: Polyamide 12 Market in 3D Printing, By End User Industry, 2013-2020 (Tons)
Figure 27 Scenario 1: Polyamide 12 Market in 3D Printing, By End User Industry, 2013-2020 (USD Million)
Figure 28 Scenario 2: Polyamide 11 Market in 3D Printing, By End User Industry, 2013-2020 (Tons)
Figure 29 Scenario 2: Polyamide 11 Market in 3D Printing, By End User Industry, 2013-2020 (USD Million)
Figure 30 Scenario 2: Polyamide 12 Market in 3D Printing, By End User Industry, 2013-2020 (Tons)
Figure 31 Scenario 2: Polyamide 12 Market in 3D Printing, By End User Industry, 2013-2020 (USD Million)
Figure 32 Polyamide 11 &12 Market in 3D Printing: Comparison Between Scenario 1 & 2, By Geography, 2013-2020 (Tons)
Figure 33 Scenario 1 & 2: North America Polyamide 11 Market in 3D Printing, 2013-2020 (Tons)
Figure 34 Scenario 1 & 2: North America Polyamide 11 Market in 3D Printing, 2013-2020 (USD Million)
Figure 35 Scenario 1 & 2: North America Polyamide 12 Market in 3D Printing, 2013-2020 (Tons)
Figure 36 Scenario 1 & 2: North America Polyamide 12 Market in 3D Printing, 2013-2020 (USD Million)
Figure 37 Scenario 1 & 2: Europe Polyamide 11 Market in 3D Printing, 2013-2020 (Tons)
Figure 38 Scenario 1 & 2: Europe Polyamide 11 Market in 3D Printing, 2013-2020 (USD Million)
Figure 39 Scenario 1 & 2: Europe Polyamide 12 Market in 3D Printing, 2013-2020 (Tons)
Figure 40 Scenario 1 & 2: Europe Polyamide 12 Market in 3D Printing, 2013-2020 (USD Million)
Figure 41 Scenario 1 & 2: Asia-Pacific Polyamide 11 Market in 3D Printing, 2013-2020 (Tons)
Figure 42 Scenario 1 & 2: Asia-Pacific Polyamide 12 Market in 3D Printing, 2013-2020 (USD Million)
Figure 43 Scenario 1 & 2: Asia-Pacific Polyamide 12 Market in 3D Printing, 2013-2020 (Tons)
Figure 44 Scenario 1 & 2: Asia-Pacific Polyamide 12 Market in 3D Printing, 2013-2020 (USD Million)
Figure 45 Scenario 1 & 2: RoW Polyamide 11 Market in 3D Printing, 2013-2020 (Tons)
Figure 46 Scenario 1 & 2: RoW Polyamide 11 Market in 3D Printing, 2013-2020 (USD Million)
Figure 47 Scenario 1 & 2: RoW Polyamide 12 Market in 3D Printing, 2013-2020 (Tons)
Figure 48 Scenario 1 & 2: RoW Polyamide 12 Market in 3D Printing, 2013-2020 (USD Million)
Figure 49 Polyamide 11 &12 in 3D Printing: Key Growth Strategies
Figure 50 Polyamide 11 &12 in 3D Printing: Company Developments, By Company (%)
Figure 51 Polyamide 11 &12 in 3D Printing: Developments From 2012 to 2015
Figure 52 Polyamide 11 &12 in 3D Printing: Geographic Revenue Mix of Key Players
Figure 53 3D Systems: SWOT Analysis
Figure 54 Stratasys, Ltd.: SWOT Analysis
Figure 55 Evonik Industries AG: SWOT Analysis
Figure 56 Arkema SA: SWOT Analysis
Figure 57 EOS GmbH: SWOT Analysis


Growth opportunities and latent adjacency in 3D PA (Polyamide) Market