Ready to Drink Tea Market & Ready to Drink Coffee Market - By Additives, Packaging, Price Segments, Distribution Channels & Geography - Forecasts up to 2017


The Ready to Drink tea and Ready to Drink coffee is the sub group of soft drinks, but differs in the function with proven health benefits. The market for Ready to Drink tea and Ready to Drink coffee is growing exponentially. Various types of RTD tea and RTD coffee products are introduced in the market to serve the wide consumer base spread across geographies. For further expansion young adults and health conscious consumers are targeted. Various nutraceutical ingredients are being incorporated to make them more functional. Asia-Pacific is the most dominating market whereas North America is the fastest growing Ready to Drink tea and Ready to Drink coffee market.
Rising consumer awareness about the health hazards of carbonated drinks is leading to a shift towards Ready to Drink tea and Ready to Drink coffee. Another major driver is surge in the health conscious population who prefer antioxidant property of RTD tea. Customizing health beneficial products for women and children are the strategies of the major players to expand in the market. Positioning of the RTD tea and Ready to Drink coffee market as recreational products has proved beneficial in attracting younger population. Increase in disposable income in developing economies is another factor triggering the growth rate of RTD tea and Ready to Drink coffee market.
Unpredictable rainfall and increase in cost of agricultural inputs had led to an increase in cost of raw materials; tea and coffee which makes the final product costly. Higher cost than hot tea and ground coffee is major restraint of the market. Age old traditional practices of drinking hot tea and coffee are creating hindrances in the growth of the market. The winning imperative of the industry is distribution alliance implemented by major players which helps in supplying the product to far off geographies and increasing the visibility of the product.
We have used various secondary sources such as encyclopedia, directories, and databases to identify and collect information useful for this extensive commercial study of Ready to Drink tea and Ready to Drink coffee market. The primary sources � experts from related industries and suppliers have been interviewed to obtain and verify critical information as well as to assess the future prospects of Ready to Drink tea and Ready to Drink coffee.
To capitalize on the growth trend in the global Ready to Drink tea and Ready to Drink coffee market, several leading companies are rushing in to the development and manufacturing. Growing demand is forcing the global soft drinks manufacturers to add RTD tea and coffee to their product line. We have also profiled leading players of this industry with their recent developments and other strategic industry activities. These include: PepsiCo Inc. (U.S.), The Coca-Cola Company (U.S.), Suntory Holdings Ltd (Japan), Nestle S.A. (Switzerland), Ting Hsin International Group (China), Sapparo Beverage Co. Ltd (Japan).
Scope of the report
This research report categorizes the global market for Ready to Drink tea and Ready to Drink coffee on the basis of additives, types, packaging, price segment, distribution channel, and geography; forecasting revenue and analyzing trends in each of the submarkets:
On the basis of additives
- Flavors
- Artificial sweeteners
- Acidulants
- Nutraceuticals
- Preservatives
- Others
On the basis of types
- Ready to drink tea
- Ready to drink coffee
On the basis of packaging
- Glass bottle
- Canned
- Pet bottle
- Fountain/Aseptic
- Others
On the basis of price segment
- Premium
- Regular
- Popular priced
- Fountain
- Super premium
On the basis of distribution channel:
- Off-trade
- Independent retailers
- Supermarkets/Hypermarkets
- Convenience stores
- Others
- On-trade
- Food service
- Vending
On the basis of geography
- North America
- Europe
- Asia-Pacific
- ROW
The Ready to Drink tea and Ready to Drink coffee market is one of fastest growing segment of the global soft drinks market. RTD tea dominates the global RTD tea and coffee market with Asia-Pacific region as major market participant. RTD tea market showed maximum new product launches with variety of combinations and formulations than RTD coffee products.
The reasons for the rapid growth for Ready to Drink tea and Ready to Drink coffee market is pull from health conscious population. Consumers switch from carbonated drinks, demanding instant energy source by combination of RTD tea and coffee products with energy drinks is another market driver. Complimenting the above growth drivers the rising per capita income in developing and emerging economies are expanding Ready to Drink tea and Ready to Drink coffee market in those geographies. The rise in cost of raw material and competition from traditional hot and freshly ground tea and coffee are the major stumbling blocks in RTD tea and coffee market.
The global market for Ready to Drink tea and Ready to Drink coffee was estimated to be worth around $70 billion in 2011 and is expected to reach $125 billion by 2017, growing at a CAGR of 10.9% from 2012 to 2017. The demand for the RTD tea and coffee market is expected to rise further in North America and Europe due to an increase in consumer awareness about health benefits of these products over other soft drinks.
RTD Tea & Coffee Market Share, By Geography, 2011
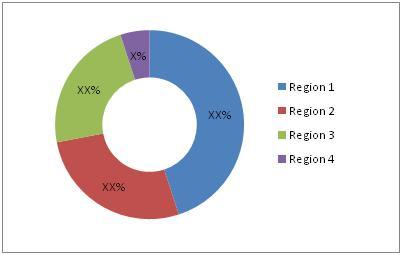
Source: MarketsandMarkets Analysis
With unique distribution alliances the RTD tea and coffee manufacturers are able to tap most of the world geographies. Another strategy adopted by manufacturers is introducing wide range of flavors in the existing product line which led to increased shelf visibility, catching attention of consumers. The major health benefits focussed are antioxidant property, instant source of energy with reduced fat, and enhanced vigour.
Key market participants in the global RTD tea and coffee market are PepsiCo. Inc. (U.S.), The Coca-Cola Company (U.S.), Suntory Holdings Ltd (Japan), Nestle S.A. (Switzerland), Ting Hsin International Group (China), Sapparo Beverage Co. Ltd (Japan), etc.
 Exclusive indicates content/data unique to MarketsandMarkets and not available with any competitors.
TABLE OF CONTENTS
1 INTRODUCTION
1.1 KEY TAKE-AWAYS
1.2 REPORT DESCRIPTION
1.3 MARKETS COVERED
1.4 STAKEHOLDERS
1.5 RESEARCH METHODOLOGY
1.5.1 MARKET SIZE
1.5.2 LIST OF SECONDARY SOURCES
1.5.3 KEY DATA POINTS TAKEN FROM SECONDARY SOURCES
1.5.4 KEY DATA POINTS TAKEN FROM PRIMARY SOURCES
1.5.5 ASSUMPTIONS MADE FOR THE REPORT
1.5.6 KEY QUESTIONS ANSWERED
2 EXECUTIVE SUMMARY
3 MARKET OVERVIEW
3.1 SOFT DRINKS MARKET: AN OVERVIEW
3.2 TEA & COFFEE PRODUCTION & TRADE INDICES: AN OVERVIEW
3.2.1 GLOBAL TEA & COFFEE PRODUCTION
3.2.2 GLOBAL TEA & COFFEE TRADE
3.3 DISTRIBUTION ALLIANCES: A WINNING IMPERATIVES
3.4 MARKET DYNAMICS
3.4.1 DRIVERS
3.4.1.1 Rising health awareness triggering demand for RTD tea and coffee market
3.4.1.2 Making drinks more functional
3.4.1.3 Smart marketing and intelligent positioning
3.4.1.4 Combination of RTD tea and coffee with energy drinks
3.4.1.5 Per capita rising income in developing economies
3.4.2 RESTRAINTS
3.4.2.1 Rising raw material costs
3.4.2.2 Increasing consumption of freshly ground coffee
3.4.2.3 Aging demography
3.4.3 OPPORTUNITY
3.4.3.1 New target consumer
3.5 PATENT ANALYSIS
3.5.1 BY REGION
3.5.2 BY YEAR
3.5.3 BY COMPANY
4 GLOBAL RTD TEA & COFFEE MARKET, BY ADDITIVES
4.1 INTRODUCTION
4.2 READY TO DRINK TEA & COFFEE ADDITIVES
4.2.1 FLAVORS
4.2.2 ARTIFICIAL SWEETENERS
4.2.3 ACIDULANTS
4.2.4 NUTRACEUTICALS
4.2.5 PRESERVATIVES
4.2.6 OTHERS
5 GLOBAL RTD TEA & COFFEE MARKET
5.1 INTRODUCTION
5.2 RTD TEA
5.2.1 BLACK TEA
5.2.1.1 Famous black tea variants
5.2.1.1.1 Keemun
5.2.1.1.2 Lapsang Souchong
5.2.1.1.3 Yunnan
5.2.1.1.4 Darjeeling
5.2.2 GREEN TEA
5.2.3 OOLONG TEA
5.2.3.1 Famous oolong varieties
5.2.3.1.1 Tai Guan Yin
5.2.3.1.2 Dong Ding
5.2.4 FRUIT & HERBAL BASED TEA
5.3 RTD COFFEE
5.3.1 EMERGING RTD COFFEE INGREDIENTS
5.3.1.1 Taurine
5.3.1.2 Guarana
5.3.1.3 Vitamin B
5.3.1.4 Ginseng
5.3.1.5 Yerba Mate
5.3.1.6 Acai Berry
6 GLOBAL RTD TEA & COFFEE MARKET, BY PACKAGING & PRICE SEGMENT
6.1 INTRODUCTION
6.2 GLASS BOTTLE
6.3 CANNED
6.4 PET BOTTLE
6.5 FOUNTAIN/ASEPTIC/CARTONS
6.6 OTHER PACKAGING
7 GLOBAL RTD TEA & COFFEE MARKET, BY DISTRIBUTION CHANNEL
7.1 INTRODUCTION
7.2 NORTH AMERICA
7.3 EUROPE
7.4 ASIA-PACIFIC
8 RTD TEA & COFFEE MARKET, BY GEOGRAPHY
8.1 INTRODUCTION
8.2 NORTH AMERICA
8.2.1 U.S.
8.2.2 CANADA
8.2.3 MEXICO
8.3 EUROPE
8.3.1 RUSSIA
8.3.2 SPAIN
8.3.3 FRANCE
8.3.4 AUSTRIA
8.3.5 SWITZERLAND
8.3.6 GERMANY
8.3.7 NORWAY
8.3.8 GREECE
8.3.9 OTHERS
8.4 ASIA-PACIFIC
8.4.1 CHINA
8.4.2 JAPAN
8.4.3 TAIWAN
8.4.4 THAILAND
8.4.5 SINGAPORE
8.4.6 AUSTRALIA
8.4.7 MALAYSIA
8.4.8 OTHERS
8.5 ROW
8.5.1 BRAZIL
8.5.2 ISRAEL
8.5.3 SOUTH AFRICA
9 COMPETITIVE LANDSCAPE
9.1 INTRODUCTION
9.2 NEW PRODUCT DEVELOPMENT: MOST PREFERRED STRATEGIC APPROACH
9.3 MAXIMUM DEVELOPMENTS IN 2011
9.4 ASAHI, COCA-COLA & KIRIN: MOST ACTIVE COMPANIES
9.5 MERGERS & ACQUISITION
9.6 AGREEMENTS, PARTNERSHIPS, COLLABORATIONS & JOINT VENTURES
9.7 NEW PRODUCT LAUNCHES
9.8 INVESTMENTS & EXPANSIONS
10 COMPANY PROFILES
10.1 AJINOMOTO GENERAL FOODS INC.
10.1.1 OVERVIEW
10.1.2 FINANCIALS
10.1.3 PRODUCT & SERVICES
10.1.4 STRATEGY
10.1.5 DEVELOPMENTS
10.2 ASAHI GROUP HOLDINGS LTD
10.2.1 OVERVIEW:
10.2.2 FINANCIALS
10.2.3 PRODUCTS & SERVICES
10.2.4 STRATEGY
10.2.5 DEVELOPMENTS
10.3 DR PEPPER SNAPPLE GROUP
10.3.1 OVERVIEW
10.3.2 FINANCIALS
10.3.3 PRODUCTS & SERVICES
10.3.4 STRATEGY
10.3.5 DEVELOPMENTS
10.4 DUNKIN' BRANDS GROUP
10.4.1 OVERVIEW
10.4.2 FINANCIALS
10.4.3 PRODUCTS & SERVICES
10.4.4 STRATEGY
10.4.5 DEVELOPMENTS
10.5 FEROLITO VULTAGGIO & SONS
10.5.1 OVERVIEW
10.5.2 FINANCIALS
10.5.3 PRODUCTS & SERVICES
10.5.4 STRATEGY
10.5.5 DEVELOPMENTS
10.6 GREEN MOUNTAIN COFFEE ROASTERS
10.6.1 OVERVIEW
10.6.2 FINANCIALS
10.6.3 PRODUCTS & SERVICES
10.6.4 STRATEGY
10.6.5 DEVELOPMENTS
10.7 HANGZHOU WAHAHA GROUP
10.7.1 OVERVIEW
10.7.2 FINANCIALS
10.7.3 PRODUCT & SERVICES
10.7.4 STRATEGY
10.7.5 DEVELOPMENTS
10.8 ITO EN LTD
10.8.1 OVERVIEW
10.8.2 FINANCIALS
10.8.3 PRODUCTS & SERVICES
10.8.4 STRATEGY
10.8.5 DEVELOPMENTS
10.9 JAPAN TOBACCO INC.
10.9.1 OVERVIEW
10.9.2 FINANCIALS
10.9.3 PRODUCTS & SERVICES
10.9.4 STRATEGY
10.9.5 DEVELOPMENTS
10.10 KIRIN HOLDINGS CO. LTD
10.10.1 OVERVIEW
10.10.2 FINANCIALS
10.10.3 PRODUCTS & SERVICES
10.10.4 STRATEGY
10.10.5 DEVELOPMENTS
10.11 LOTTE CHILSUNG BEVERAGE CO. LTD
10.11.1 OVERVIEW
10.11.2 FINANCIALS
10.11.3 PRODUCTS & SERVICES
10.11.4 STRATEGY
10.11.5 DEVELOPMENTS
10.12 MONSTER BEVERAGE COMPANY
10.12.1 OVERVIEW
10.12.2 FINANCIALS
10.12.3 PRODUCTS & SERVICES
10.12.4 STRATEGY
10.12.5 DEVELOPMENTS
10.13 PEPSICO INC.
10.13.1 OVERVIEW
10.13.2 FINANCIALS
10.13.3 PRODUCTS & SERVICES
10.13.4 STRATEGY
10.13.5 DEVELOPMENTS
10.14 POKKA GROUP
10.14.1 OVERVIEW
10.14.2 FINANCIALS
10.14.3 PRODUCTS & SERVICES
10.14.4 STRATEGY
10.14.5 DEVELOPMENTS
10.15 SAN BENEDETTO
10.15.1 OVERVIEW
10.15.2 PRODUCTS & SERVICES
10.15.3 FINANCIALS
10.15.4 STRATEGY
10.15.5 DEVELOPMENTS
10.16 STARBUCKS CORPORATION
10.16.1 OVERVIEW
10.16.2 FINANCIALS
10.16.3 PRODUCTS & SERVICES
10.16.4 STRATEGY
10.16.5 DEVELOPMENTS
10.17 SUNTORY BEVERAGE & FOOD LTD
10.17.1 OVERVIEW
10.17.2 FINANCIALS
10.17.3 PRODUCTS & SERVICES
10.17.4 STRATEGY
10.17.5 DEVELOPMENTS
10.18 TAISAN ENTERPRISE CO. LTD
10.18.1 OVERVIEW
10.18.2 FINANCIALS
10.18.3 PRODUCTS & SERVICES
10.18.4 STRATEGY
10.18.5 DEVELOPMENTS
10.19 THE COCA-COLA COMPANY
10.19.1 OVERVIEW
10.19.2 FINANCIALS
10.19.3 PRODUCTS & SERVICES
10.19.4 STRATEGY
10.19.5 DEVELOPMENTS
10.20 THE REPUBLIC OF TEA
10.20.1 OVERVIEW
10.20.2 PRODUCTS & SERVICES
10.20.3 FINANCIALS
10.20.4 STRATEGY
10.20.5 DEVELOPMENTS
10.21 TINGYI CI HOLDINGS CORP.
10.21.1 OVERVIEW
10.21.2 FINANCIALS
10.21.3 PRODUCT & SERVICES
10.21.4 STRATEGY
10.21.5 DEVELOPMENTS
10.22 UNI-PRESIDENT ENTERPRISES (UPEC)
10.22.1 OVERVIEW
10.22.2 FINANCIALS
10.22.3 PRODUCT & SERVICES
10.22.4 STRATEGY
10.22.5 DEVELOPMENTS
APPENDIX
U.S. PATENTS
EUROPE PATENTS
JAPAN PATENTS
LIST OF TABLES
TABLE 1 RTD TEA & COFFEE MARKET REVENUE, BY GEOGRAPHY, 2010 � 2017 ($MILLION)
TABLE 2 READY TO DRINK TEA & RTD COFFEE MARKET VOLUME, BY GEOGRAPHY, 2010 � 2017 (MILLION LITERS)
TABLE 3 SOFT DRINKS MARKET REVENUE, BY GEOGRAPHY, 2010 � 2017 ($MILLION)
TABLE 4 GLOBAL SOFT DRINKS MARKET REVENUE, BY TYPE, 2010 � 2017 ($MILLION)
TABLE 5 TEA & COFFEE HARVESTED AREA, BY GEOGRAPHY, 2010 (THOUSAND HECTARES)
TABLE 6 TEA & COFFEE PRODUCTION, BY GEOGRAPHY, 2010 (THOUSAND TONS)
TABLE 7 TEA TRADE VALUE, BY GEOGRAPHY, 2010 ($BILLION)
TABLE 8 TEA TRADE VOLUME, BY GEOGRAPHY, 2010 (THOUSAND TONS)
TABLE 9 COFFEE TRADE VALUE, BY GEOGRAPHY, 2010 ($BILLION)
TABLE 10 COFFEE TRADE VOLUME, BY GEOGRAPHY, 2010 (THOUSAND TONS)
TABLE 11 READY TO DRINK TEA: DISTRIBUTION ALLIANCES
TABLE 12 READY TO DRINK COFFEE: DISTRIBUTION ALLIANCES
TABLE 13 PEPSICO: RTD COFFEE BLENDED WITH ENERGY DRINKS
TABLE 14 PER CAPITA INCOME GROWTH IN MAJOR DEVELOPING ECONOMIES
TABLE 15 READY TO DRINK PRODUCTS & ARTIFICIAL SWEETENERS
TABLE 16 FAMOUS GREEN TEA VARIANTS
TABLE 17 HEALTH BENEFITS OF GREEN TEA
TABLE 18 NUTRITIONAL INFORMATION: FRUIT & HERBAL BASED TEA (8FL OZ.)
TABLE 19 READY TO DRINK TEA MARKET REVENUE, BY GEOGRAPHY, 2010 � 2017 ($MILLION)
TABLE 20 READY TO DRINK TEA MARKET VOLUME, BY GEOGRAPHY, 2010 � 2017 (MILLION LITERS)
TABLE 21 GLOBAL RTD TEA MARKET REVENUE, BY TYPES, 2010 � 2017 ($MILLION)
TABLE 22 GLOBAL READY TO DRINK TEA MARKET VOLUME, BY TYPES, 2010 � 2017 (MILLION LITERS)
TABLE 23 PEPSICO: READY TO DRINK COFFEE PRODUCTS
TABLE 24 READY TO DRINK COFFEE MARKET REVENUE, BY GEOGRAPHY, 2010 � 2017 ($MILLION)
TABLE 25 READY TO DRINK COFFEE MARKET VOLUME, BY GEOGRAPHY, 2010 � 2017 (MILLION LITERS)
TABLE 26 GLOBAL RTD TEA & COFFEE MARKET REVENUE, BY PACKAGING, 2010 � 2017 ($MILLION)
TABLE 27 GLOBAL READY TO DRINK TEA & COFFEE MARKET VOLUME, BY PACKAGING, 2010 � 2017 (MILLION LITERS)
TABLE 28 GLOBAL READY TO DRINK TEA & COFFEE MARKET REVENUE, BY PRICE SEGMENT, 2010 � 2017 ($MILLION)
TABLE 29 GLOBAL READY TO DRINK TEA & COFFEE MARKET VOLUME, BY PRICE SEGMENT, 2010 � 2017 (MILLION LITERS)
TABLE 30 PEPSICO: FOUNTAIN ICED TEA RANGE
TABLE 31 GLOBAL RTD TEA & RTD COFFEE MARKET REVENUE, BY DISTRIBUTION CHANNEL, 2010 � 2017 ($MILLION)
TABLE 32 GLOBAL RTD TEA & COFFEE MARKET VOLUME, BY DISTRIBUTION CHANNEL, 2010 � 2017 (MILLION LITERS)
TABLE 33 GLOBAL READY TO DRINK TEA & COFFEE MARKET REVENUE, BY ON-TRADE DISTRIBUTION CHANNEL, 2010 � 2017 ($MILLION)
TABLE 34 GLOBAL READY TO DRINK TEA & COFFEE MARKET VOLUME, BY ON-TRADE DISTRIBUTION CHANNEL, 2010 � 2017 (MILLION LITERS)
TABLE 35 GLOBAL RTD TEA & COFFEE MARKET REVENUE, BY OFF-TRADE DISTRIBUTION CHANNEL, 2010 � 2017 ($MILLION)
TABLE 36 GLOBAL RTD TEA & READY TO DRINK COFFEE MARKET VOLUME, BY OFF-TRADE DISTRIBUTION CHANNEL, 2010 � 2017 (MILLION LITERS )
TABLE 37 NORTH AMERICA: RTD TEA & COFFEE MARKET REVENUE, BY DISTRIBUTION CHANNEL, 2010 � 2017 ($MILLION)
TABLE 38 NORTH AMERICA: RTD TEA & COFFEE MARKET VOLUME, BY DISTRIBUTION CHANNEL, 2010 � 2017 (MILLION LITERS)
TABLE 39 NORTH AMERICA: RTD TEA & COFFEE MARKET REVENUE, BY ON-TRADE DISTRIBUTION CHANNEL, 2010 � 2017 ($MILLION)
TABLE 40 NORTH AMERICA: RTD TEA & COFFEE MARKET VOLUME, BY ON-TRADE DISTRIBUTION CHANNEL, 2010 � 2017 (MILLION LITERS)
TABLE 41 NORTH AMERICA: RTD TEA & READY TO DRINK COFFEE MARKET REVENUE, BY OFF-TRADE DISTRIBUTION CHANNEL, 2010 � 2017 ($MILLION)
TABLE 42 NORTH AMERICA: READY TO DRINK TEA & READY TO DRINK COFFEE MARKET VOLUME, BY OFF-TRADE DISTRIBUTION CHANNEL, 2010 � 2017 (MILLION LITERS)
TABLE 43 EUROPE: RTD TEA & COFFEE MARKET REVENUE, BY DISTRIBUTION CHANNEL, 2010 � 2017 ($MILLION)
TABLE 44 EUROPE: READY TO DRINK TEA & COFFEE MARKET VOLUME, BY DISTRIBUTION CHANNEL, 2010 � 2017 (MILLION LITERS)
TABLE 45 EUROPE: RTD TEA & COFFEE MARKET REVENUE, BY ON-TRADE DISTRIBUTION CHANNEL, 2010 � 2017 ($MILLION)
TABLE 46 EUROPE: RTD TEA & RTD COFFEE MARKET VOLUME, BY ON-TRADE DISTRIBUTION CHANNEL, 2010 � 2017 (MILLION LITERS)
TABLE 47 EUROPE: RTD TEA & READY TO DRINK COFFEE MARKET REVENUE, BY OFF-TRADE DISTRIBUTION CHANNEL, 2010 � 2017 ($MILLION)
TABLE 48 EUROPE: RTD TEA & COFFEE MARKET VOLUME, BY OFF-TRADE DISTRIBUTION CHANNEL, 2012 � 2017 (MILLION LITERS)
TABLE 49 ASIA-PACIFIC: RTD TEA & COFFEE MARKET REVENUE, BY DISTRIBUTION CHANNEL, 2010 � 2017 ($MILLION)
TABLE 50 ASIA-PACIFIC: RTD TEA & READY TO DRINK COFFEE MARKET VOLUME, BY DISTRIBUTION CHANNEL, 2010 � 2017 (MILLION LITERS)
TABLE 51 ASIA-PACIFIC: READY TO DRINK TEA & READY TO DRINK COFFEE MARKET REVENUE, BY ON-TRADE DISTRIBUTION CHANNEL, 2010 � 2017 ($MILLION)
TABLE 52 ASIA-PACIFIC: RTD TEA & RTD COFFEE MARKET VOLUME, BY ON-TRADE DISTRIBUTION CHANNEL, 2010 � 2017 (MILLION LITERS)
TABLE 53 ASIA-PACIFIC: READY TO DRINK TEA & RTD COFFEE MARKET REVENUE, BY OFF-TRADE DISTRIBUTION CHANNEL, 2010 � 2017 ($MILLION)
TABLE 54 ASIA-PACIFIC: RTD TEA & COFFEE MARKET VOLUME, BY OFF-TRADE DISTRIBUTION CHANNEL, 2010 � 2017 (MILLION LITERS )
TABLE 55 NORTH AMERICA: READY TO DRINK TEA & COFFEE MARKET REVENUE, BY COUNTRY, 2010 � 2017 ($MILLION)
TABLE 56 NORTH AMERICA: RTD TEA & COFFEE MARKET VOLUME, BY COUNTRY, 2010 � 2017 (MILLION LITERS)
TABLE 57 U.S: POPULAR RTD TEA BRAND
TABLE 58 U.S: POPULAR READY TO DRINK COFFEE BRAND
TABLE 59 U.S: RTD TEA & COFFEE MARKET REVENUE, BY TYPE, 2010 � 2017 ($MILLION)
TABLE 60 U.S: READY TO DRINK TEA & COFFEE MARKET VOLUME, BY TYPE, 2010 � 2017 (MILLION LITERS)
TABLE 61 CANADA: POPULAR RTD TEA BRANDS
TABLE 62 CANADA: POPULAR RTD COFFEE BRANDS
TABLE 63 CANADA: RTD TEA & COFFEE MARKET REVENUE, BY TYPE, 2010 � 2017 ($MILLION)
TABLE 64 CANADA: READY TO DRINK TEA & COFFEE MARKET VOLUME, BY TYPE, 2010 � 2017 (MILLION LITERS)
TABLE 65 MEXICO: POPULAR RTD TEA BRANDS
TABLE 66 MEXICO: POPULAR READY TO DRINK COFFEE BRANDS
TABLE 67 MEXICO: RTD TEA & COFFEE MARKET REVENUE, BY TYPE, 2010 � 2017 ($MILLION)
TABLE 68 MEXICO: RTD TEA & COFFEE MARKET VOLUME, BY TYPE, 2010 � 2017 (MILLION LITERS)
TABLE 69 EUROPE: READY TO DRINK TEA & COFFEE MARKET REVENUE, BY COUNTRY, 2010 � 2017 ($MILLION)
TABLE 70 EUROPE: RTD TEA & COFFEE MARKET VOLUME, BY COUNTRY, 2010 � 2017 (MILLION LITERS)
TABLE 71 RUSSIA: POPULAR RTD TEA BRAND
TABLE 72 RUSSIA: POPULAR READY TO DRINK COFFEE BRANDS
TABLE 73 RUSSIA: RTD TEA & COFFEE MARKET REVENUE, BY TYPE, 2010 � 2017 ($MILLION)
TABLE 74 RUSSIA: READY TO DRINK TEA & COFFEE MARKET VOLUME, BY TYPE, 2010 � 2017 (MILLION LITERS)
TABLE 75 SPAIN: POPULAR RTD TEA BRAND
TABLE 76 SPAIN: POPULAR RTD COFFEE BRAND
TABLE 77 SPAIN: RTD TEA & COFFEE MARKET REVENUE, BY TYPE, 2010 � 2017 ($MILLION)
TABLE 78 SPAIN: RTD TEA & COFFEE MARKET VOLUME, BY TYPE, 2010 � 2017 (MILLION LITERS)
TABLE 79 FRANCE: POPULAR RTD TEA BRAND
TABLE 80 FRANCE: POPULAR RTD COFFEE BRAND
TABLE 81 FRANCE: READY TO DRINK TEA & COFFEE MARKET REVENUE, BY TYPE, 2010 � 2017 ($MILLION)
TABLE 82 FRANCE: RTD TEA & COFFEE MARKET VOLUME, BY TYPE, 2010 � 2017 (MILLION LITERS)
TABLE 83 AUSTRIA: POPULAR RTD TEA BRAND
TABLE 84 AUSTRIA: POPULAR RTD COFFEE BRAND
TABLE 85 AUSTRIA: RTD TEA &COFFEE MARKET REVENUE, BY TYPE, 2010 � 2017 ($MILLION)
TABLE 86 AUSTRIA: RTD TEA & COFFEE MARKET VOLUME, BY TYPE, 2010 � 2017 (MILLION LITERS)
TABLE 87 SWITZERLAND: POPULAR RTD TEA BRAND
TABLE 88 SWITZERLAND: POPULAR READY TO DRINK COFFEE BRAND
TABLE 89 SWITZERLAND: RTD TEA & COFFEE MARKET REVENUE, BY TYPE, 2010 � 2017 ($MILLION)
TABLE 90 SWITZERLAND: READY TO DRINK TEA & COFFEE MARKET VOLUME, BY TYPE, 2010 � 2017 (MILLION LITERS)
TABLE 91 GERMANY: POPULAR RTD TEA BRANDS
TABLE 92 GERMANY: POPULAR RTD COFFEE BRANDS
TABLE 93 GERMANY: RTD TEA & COFFEE MARKET REVENUE, BY TYPE, 2010 � 2017 ($MILLION)
TABLE 94 GERMANY: RTD TEA & COFFEE MARKET VOLUME, BY TYPE, 2010 � 2017 (MILLION LITERS)
TABLE 95 NORWAY: POPULAR RTD TEA BRAND
TABLE 96 NORWAY: POPULAR READY TO DRINK COFFEE BRAND
TABLE 97 NORWAY: RTD TEA & COFFEE MARKET REVENUE, BY TYPE, 2010 � 2017 ($MILLION)
TABLE 98 NORWAY: RTD TEA & COFFEE MARKET VOLUME, BY TYPE, 2010 � 2017 (MILLION LITERS)
TABLE 99 GREECE: POPULAR RTD TEA BRAND
TABLE 100 GREECE: POPULAR RTD COFFEE BRAND
TABLE 101 GREECE: READY TO DRINK TEA & COFFEE MARKET REVENUE, BY TYPE, 2010 � 2017 ($MILLION)
TABLE 102 GREECE: RTD TEA & COFFEE MARKET VOLUME, BY TYPE, 2010 � 2017 (MILLION LITERS)
TABLE 103 OTHERS: RTD TEA & COFFEE MARKET REVENUE, BY TYPE, 2010 � 2017 ($MILLION)
TABLE 104 OTHERS: RTD TEA & COFFEE MARKET VOLUME, BY TYPE, 2010 � 2017 (MILLION LITERS)
TABLE 105 ASIA-PACIFIC: RTD TEA & COFFEE MARKET REVENUE, BY COUNTRY, 2010 � 2017 ($MILLION)
TABLE 106 ASIA-PACIFIC: RTD TEA & COFFEE MARKET VOLUME, BY COUNTRY, 2010 � 2017 (MILLION LITERS)
TABLE 107 CHINA: POPULAR RTD TEA BRAND
TABLE 108 CHINA: POPULAR READY TO DRINK COFFEE BRAND
TABLE 109 CHINA: RTD TEA & COFFEE MARKET REVENUE, BY TYPE, 2010 � 2017 ($MILLION)
TABLE 110 CHINA: RTD TEA & COFFEE MARKET VOLUME, BY TYPE, 2010 � 2017 (MILLION LITERS)
TABLE 111 JAPAN: POPULAR RTD TEA BRAND
TABLE 112 JAPAN: POPULAR RTD COFFEE BRAND
TABLE 113 JAPAN: RTD TEA & COFFEE MARKET REVENUE, BY TYPE, 2010 � 2017 ($MILLION)
TABLE 114 JAPAN: RTD TEA & COFFEE MARKET VOLUME, BY TYPE, 2010 � 2017 (MILLION LITERS)
TABLE 115 TAIWAN: POPULAR RTD TEA BRAND
TABLE 116 TAIWAN: POPULAR RTD COFFEE BRAND
TABLE 117 TAIWAN: RTD TEA & COFFEE MARKET REVENUE, BY TYPE, 2010 � 2017 ($MILLION)
TABLE 118 TAIWAN: READY TO DRINK TEA & COFFEE MARKET VOLUME, BY TYPE, 2010 � 2017 (MILLION LITERS)
TABLE 119 THAILAND: POPULAR RTD TEA BRAND
TABLE 120 THAILAND: POPULAR RTD COFFEE BRAND
TABLE 121 THIALAND: RTD TEA & COFFEE MARKET REVENUE, BY TYPE, 2010 � 2017 ($MILLION)
TABLE 122 THIALAND: RTD TEA & COFFEE MARKET VOLUME, BY TYPE, 2010 � 2017 (MILLION LITERS)
TABLE 123 SINGAPORE: POPULAR RTD TEA BRAND
TABLE 124 SINGAPORE: POPULAR RTD COFFEE BRAND
TABLE 125 SINGAPORE: READY TO DRINK TEA & COFFEE MARKET REVENUE, BY TYPE, 2010 � 2017 ($MILLION)
TABLE 126 SINGAPORE: RTD TEA & COFFEE MARKET VOLUME, BY TYPE, 2010 � 2017 (MILLION LITERS)
TABLE 127 AUSTRALIA: POPULAR RTD TEA BRAND
TABLE 128 AUSTRALIA: POPULAR RTD COFFEE BRAND
TABLE 129 AUSTRALIA: RTD TEA & COFFEE MARKET REVENUE, BY TYPE, 2010 � 2017 ($MILLION)
TABLE 130 AUSTRALIA: RTD TEA & COFFEE MARKET VOLUME, BY TYPE, 2010 � 2017 (MILLION LITERS)
TABLE 131 MALAYSIA: POPULAR RTD TEA BRAND
TABLE 132 MALAYSIA: POPULAR READY TO DRINK COFFEE BRAND
TABLE 133 MALAYSIA: RTD TEA & COFFEE MARKET REVENUE, BY TYPE, 2010 � 2017 ($MILLION)
TABLE 134 MALAYSIA: RTD TEA & COFFEE MARKET VOLUME, BY TYPE, 2010 � 2017 (MILLION LITERS)
TABLE 135 OTHER ASIA-PACIFIC: RTD TEA & COFFEE MARKET REVENUE, BY TYPE, 2010 � 2017 ($MILLION)
TABLE 136 OTHER ASIA-PACIFIC: RTD TEA & COFFEE MARKET VOLUME, BY TYPE, 2010 � 2017 (MILLION LITERS)
TABLE 137 ROW: RTD TEA & COFFEE MARKET REVENUE, BY COUNTRY, 2010 � 2017 ($MILLION)
TABLE 138 ROW: RTD TEA & COFFEE MARKET VOLUME, BY COUNTRY, 2010 � 2017 (MILLION LITERS)
TABLE 139 BRAZIL: POPULAR RTD TEA BRAND
TABLE 140 BRAZIL: POPULAR READY TO DRINK COFFEE BRAND
TABLE 141 BRAZIL: RTD TEA & COFFEE MARKET REVENUE, BY TYPE, 2010 � 2017 ($MILLION)
TABLE 142 BRAZIL: RTD TEA & COFFEE MARKET VOLUME, BY TYPE, 2010 � 2017 (MILLION LITERS)\
TABLE 143 ISRAEL: POPULAR RTD TEA BRAND
TABLE 144 ISRAEL: POPULAR RTD COFFEE BRAND
TABLE 145 ISRAEL: RTD TEA & COFFEE MARKET REVENUE, BY TYPE, 2010 � 2017 ($MILLION)
TABLE 146 ISRAEL: RTD TEA & COFFEE MARKET VOLUME, BY TYPE, 2010 � 2017 (MILLION LITERS)
TABLE 147 SOUTH AFRICA: POPULAR RTD TEA BRAND
TABLE 148 SOUTH AFRICA: RTD TEA & COFFEE MARKET REVENUE, BY TYPE, 2010 � 2017 ($MILLION)
TABLE 149 SOUTH AFRICA: RTD TEA & COFFEE MARKET VOLUME, BY TYPE, 2010 � 2017 (MILLION LITERS)
TABLE 150 OTHER ROW: RTD TEA & COFFEE MARKET REVENUE, BY TYPE, 2010 � 2017 ($MILLION)
TABLE 151 OTHER ROW: RTD TEA & COFFEE MARKET VOLUME, BY TYPE, 2010 � 2017 (MILLION LITERS)
TABLE 152 MERGERS & ACQUISITION, 2009 � 2012
TABLE 153 AGREEMENTS, PARTNERSHIPS, COLLABORATIONS & JOINT VENTURES, 2009 � 2012
TABLE 154 NEW PRODUCT LAUNCHES, 2009 � 2012
TABLE 155 INVESTMENTS & EXPANSIONS , 2009 � 2012
TABLE 156 AJINOMOTO: RTD TEA PRODUCTS
TABLE 157 AJINOMOTO GENERAL FOODS: RTD COFFEE PRODUCT
TABLE 158 ASAHI: ANNUAL REVENUE, BY BUSINESS SEGMENT, 2010 � 2011 ($MILLION)
TABLE 159 DR PEPPER SNAPPLE: ANNUAL REVENUE, 2010 � 2011 ($MILLION)
TABLE 160 DR PEPPER SNAPPLE: ANNUAL REVENUE, BY BUSINESS SEGMENT, 2010 � 2011 ($MILLION)
TABLE 161 DR PEPPER SNAPPLE: ANNUAL REVENUE, BY GEOGRAPHY, 2010 � 2011 ($MILLION)
TABLE 162 DR PEPPER SNAPPLE: RTD TEA PRODUCTS
TABLE 163 DUNKIN' BRANDS: ANNUAL REVENUE, BY BUSINESS SEGMENT, 2010 � 2011 ($MILLION)
TABLE 164 DUNKIN' BRANDS: RTD TEA PRODUCTS
TABLE 165 DUNKIN' BRANDS: RTD COFFEE PRODUCTS
TABLE 166 FEROLITO VULTAGGIO: RTD TEA PRODUCTS
TABLE 167 GREEN MOUNTAIN: ANNUAL REVENUE, BY BUSINESS SEGMENT, 2010 � 2011 ($MILLION)
TABLE 168 GREEN MOUNTAIN: ANNUAL REVENUE, BY GEOGRAPHY, 2010 � 2011 ($MILLION)
TABLE 169 GREEN MOUNTAIN: RTD COFFEE PRODUCTS, VALUE PACKS
TABLE 170 GREEN MOUNTAIN: RTD COFFEE PRODUCTS, CUP PACKS
TABLE 171 HANGZHOU: RTD TEA PRODUCTS
TABLE 172 HANGZHOU: RTD COFFEE PRODUCTS
TABLE 173 ITO EN: ANNUAL REVENUE, BY BUSINESS SEGMENTS, 2011 � 2012 ($MILLION)
TABLE 174 ITO EN: RTD TEA PRODUCTS
TABLE 175 ITO EN : RTD COFFEE PRODUCTS
TABLE 176 JAPAN TOBACCO: ANNUAL REVENUE, BY BUSINESS SEGMENT, 2011 � 2012 ($MILLION)
TABLE 177 JAPAN TOBACCO: ANNUAL REVENUE, BY GEOGRAPHY, 2010 � 2011 ($MILLION)
TABLE 178 JAPAN TOBACCO: RTD COFFEE PRODUCTS
TABLE 179 KIRIN HOLDINGS: ANNUAL REVENUE, BY BUSINESS SEGMENT, 2010 � 2011 ($MILLION)
TABLE 180 KIRIN HOLDINGS: RTD TEA PRODUCTS
TABLE 181 KIRIN HOLDINGS: RTD COFFEE PRODUCTS
TABLE 182 LOTTE CHILSUNG: RTD TEA & COFFEE PRODUCTS
TABLE 183 MONSTER BEVERAGE: ANNUAL REVENUE, BY BUSINESS SEGMENT, 2010 � 2011 ($MILLION)
TABLE 184 MONSTER BEVERAGE: ANNUAL REVENUE, BY GEOGRAPHY, 2010 � 2011 ($MILLION)
TABLE 185 MONSTER BEVERAGE: RTD TEA PRODUCTS
TABLE 186 MONSTER BEVERAGE: RTD COFFEE PRODUCTS
TABLE 187 PEPSICO: ANNUAL REVENUE, 2010 � 2011 ($MILLION)
TABLE 188 PEPSICO: ANNUAL REVENUE, BY BUSINESS SEGMENT, 2010 � 2011 ($MILLION)
TABLE 189 TAISAN ENTERPRISE: RTD TEA PRODUCTS
TABLE 190 TAISAN ENTERPRISE: RTD COFFEE PRODUCTS
TABLE 191 POKKA: TEA PRODUCTS
TABLE 192 POKKA: COFFEE PRODUCTS
TABLE 193 SAN BENEDETTO: RTD TEA PRODUCTS
TABLE 194 STARBUCKS: ANNUAL REVENUE, 2010 � 2011 ($MILLION)
TABLE 195 STARBUCKS : ANNUAL REVENUE, BY BUSINESS SEGMENT, 2010 � 2011 ($MILLION)
TABLE 196 STARBUCKS: ANNUAL REVENUE, BY GEOGRAPHY, 2010 � 2011 ($MILLION)
TABLE 197 STARBUCKS: RTD TEA PRODUCTS
TABLE 198 STARBUCKS: RTD COFFEE PRODUCTS
TABLE 199 SUNTORY: RTD TEA PRODUCTS
TABLE 200 SUNTORY: RTD COFFEE PRODUCTS
TABLE 201 TAISAN ENTERPRISE: RTD TEA PRODUCTS
TABLE 202 COCA-COLA: ANNUAL REVENUE, BY BUSINESS SEGMENT, 2010 � 2011 ($MILLION)
TABLE 203 COCA-COLA: ANNUAL REVENUE, BY BUSINESS SEGMENT, 2010 � 2011 ($MILLION)
TABLE 204 COCA-COLA: RTD TEA PRODUCTS
TABLE 205 COCA-COLA: RTD COFFEE PRODUCTS
TABLE 206 THE REPUBLIC OF TEA: RTD TEA PRODUCTS
TABLE 207 TINGYI CI HOLDINGS: ANNUAL REVENUE, BY BUSINESS SEGMENT, 2010 � 2011 ($MILLION)
TABLE 208 TINGYI CI HOLDINGS: RTD TEA PRODUCTS
TABLE 209 UPEC: ANNUAL REVENUE, BY BUSINESS SEGMENT, 2010 � 2011 ($MILLION)
TABLE 210 UPEC: ANNUAL REVENUE, BY GEOGRAPHY, 2010 � 2011 ($MILLION)
TABLE 211 UPEC: RTD TEA PRODUCTS
TABLE 212 UPEC: RTD COFFEE PRODUCTS
LIST OF FIGURES
FIGURE 1 GLOBAL SOFT DRINKS MARKET SHARE ANALYSIS
FIGURE 2 IMPACT OF MAJOR DRIVERS ON GLOBAL RTD TEA & COFFEE MARKET, 2010 � 2017
FIGURE 3 MARKETING & ADVERTISEMENT CHANNEL SHARE FOR RTD TEA & COFFEE, 2011
FIGURE 4 GLOBAL ENERGY DRINKS MARKET SHARE, BY GEOGRAPHY, 2010
FIGURE 5 IMPACT OF MAJOR RESTRAINTS ON GLOBAL RTD TEA & COFFEE MARKET, 2010 � 2017
FIGURE 6 BASELINE TEA PRICES, 1989 � 2011
FIGURE 7 PATENT ANALYSIS, BY GEOGRAPHY, 2008 � 2012
FIGURE 8 PATENT ANALYSIS, BY YEAR, 2008 � 2012
FIGURE 9 PATENT ANALYSIS, BY COMPANY, 2008 � 2012
FIGURE 10 GLOBAL RTD TEA & COFFEE ADDITIVES MARKET SHARE, BY TYPE, 2011
FIGURE 11 RTD TEA & COFFEE DISTRIBUTION CHANNEL
FIGURE 12 GLOBAL RTD TEA & COFFEE MARKET, BY GROWTH STRATEGY, 2009 � 2012
FIGURE 13 GLOBAL RTD TEA & COFFEE MARKET, BY DEVELOPMENT, 2009 � 2012
FIGURE 14 GLOBAL RTD TEA & COFFEE MARKET GROWTH STRATEGIES, BY COMPANIES, 2009 � 2012


Growth opportunities and latent adjacency in Ready to Drink Tea Market