Soft Drink Concentrates Market by Application [Carbonated (Cola & Non-cola), & Non-carbonated (Orange, Apple, Mixed, Grape, Pineapple, Grapefruit, Mango), End Use (Mass Merchandise, Food Service, Fountain Machine), & by Region - Global Trends & Forecast to 2019


This report provides a study on the global market, categorizing soft drink concentrates on the basis of their main applications, end use, and geography. It includes projections for global as well as regional soft drink concentrate demand.
The Soft Drink Concentrates Market was estimated to be $25,500.00 million in 2013, and is projected to reach $34,761.36 million by 2019, at a CAGR of 5.4% from 2013 to 2019.
Market size, on the basis of soft drink concentrate applications and end use has also been analysed. The report also analyses the market size, in terms of value, of soft drink concentrates, based on their application and geography. The regions covered in the report include North America (U.S., Canada, and Mexico), Europe (U.K., Germany, France, Italy, Spain, The Netherlands, Greece, Russia, and Poland), Asia-Pacific (China, Indonesia, Japan, India, Thailand, and Australia), Latin America (Brazil and Argentina) and Rest of the World (Africa and Others).
The report provides a comprehensive analysis of this market that witnesses increasing growth due to the changing lifestyles and consumer preferences. Applications of soft drink concentrates in beverages have been analysed based on region.
The growth strategies adopted by market players to sustain and garner a larger share have been identified and analysed in the report. Food manufacturers have started focusing on the emerging Asian and Latin American markets. The market is estimated to illustrate the growth potential in both, the developed and developing regions. The market growth is also attributed to an increase in the demand for convenience food. China is one of the largest markets for soft drink concentrates.
Soft Drink Concentrates Market Share (Value), by Region, 2013
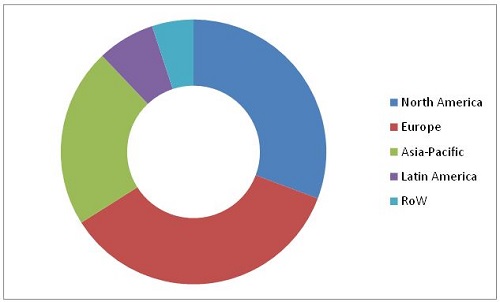
Source: Expert Interviews and MarketsandMarkets Analysis
This report estimates the size of the global market in terms of value ($million). Market drivers, restraints, opportunities, and challenges have also been discussed in detail. The share of participants in the overall market has been discussed in detail. The market has grown significantly in the last few years and this growth is projected to continue.
Scope of the report
This research report categorizes the global market based on application, end use, and region.
Based on application, the market has been segmented as follows:
- Carbonated
- Non-Carbonated
Based on flavors of each application, the market has been segmented as follows:
- Carbonated
- Cola
- Non-cola
- Non-carbonated
- Orange
- Apple
- Mixed
- Grape
- Pineapple
- Grapefruit
- Mango
- Others (Kiwi, Peach, and Lichi)
Based on end use, the market has been segmented as follows:
- Mass Merchandise
- Food Service
- Fountain Machine
- Others (Drinking places, and private clubs)
Based on region, the market has been segmented as follows:
- North America
- Europe
- Asia-Pacific
- Latin America
- RoW (Africa, Persian Gulf Countries, and Central Asia)
The role of soft drink concentrates in beverages is essential to maintain the product taste as well as nutritive value. The soft drink concentrates market has witnessed large use of apple, orange, grape, pineapple, mango, pineapple, and other flavours. The market is driven by changing consumer trends and food preferences.
The global market is Projected to Reach a Value of $34,761.36 Million by 2019.
This market is driven by consumer demand for processed food & beverages, without compromising on the taste and nutrition of the product. The growth potential of the market also depends on the research & development and opportunities to introduce new flavours of non-carbonated concentrates. The market is characterized by the growing demand for healthy and upmarket products. The changing lifestyles and the rapidly growing food & beverage industry have driven the demand for soft drink concentrates.
Non-Carbonated Soft Drink Concentrates Market Size, by Flavour, 2014-2019 ($Million)
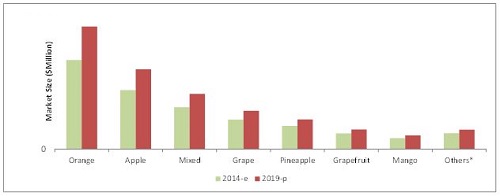
Others* include kiwi, peach, and lichi
E � Estimated; P - Projected
Source: Expert Interviews and MarketsandMarkets Analysis
Orange and apple fruit concentrates accounted for a major share, in terms of value, of the total non-carbonated soft drink concentrates market. The steady increase in demand for fruit juices, and healthy and upmarket products is projected to increase the market size, in terms of value, of non-carbonated soft drink concentrates, by 2019.
Europe formed the largest segment of the soft drink concentrate market in 2013. The market here is projected to grow at a CAGR of 4.8% during the projected period. North America was the second-largest market, due to an increase in the demand for processed food & beverage in the region. The Asia-Pacific region is projected to see the fastest growth during the same period.
 Exclusive indicates content/data unique to MarketsandMarkets and not available with any competitors.
Table of Contents
1 Introduction (Page No. - 17)
1.1 Objectives of the Study
1.2 Market Definition
1.3 Study Scope
1.3.1 Market, By Application
1.3.2 Market, By Flavor
1.3.3 Market, By End Use
1.3.4 Market, By Region
1.3.5 Years Considered in the Report
1.4 Currency
1.5 Limitations
1.6 Stakeholders
2 Research Methodology (Page No. - 21)
2.1 Research Data
2.1.1 Secondary Data
2.1.2 Primary Data
2.1.2.1 Breakdown of Primaries
2.2 Factor Analysis
2.2.1 Introduction
2.2.2 Demand-Side Analysis
2.2.2.1 Growth in GDP
2.2.2.2 Increased Food Product Demand of Continuously Growing Population
2.2.3 Supply-Side Analysis
2.2.3.1 Increasing Fruit Production & Processing
2.2.3.2 Change in Global Consumer Spending
2.2.3.3 Increasing Global Per Capita Income
2.3 Market Size Estimation
2.3.1 Bottom-Up Approach
2.3.2 Top-Down Approach
2.4 Market Breakdown & Data Triangulation
2.5 Research Assumptions & Limitations
2.5.1 Assumptions
2.5.2 Limitations
3 Executive Summary (Page No. - 32)
4 Premium Insights (Page No. - 36)
4.1 Extensive Market Opportunities in this Market
4.2 Non-Carbonated Concentrates Market, Flavor Segments ($Million)
4.3 Asia-Pacific: the Fastest Growing Market for Soft Drink Concentrate
4.4 Soft Drink Concentrates Market Share, By Country, 2013
4.5 Product Growth Matrix
4.6 Life Cycle Analysis, By Region
5 Market Overview (Page No. - 42)
5.1 Introduction
5.2 Evolution
5.3 Market Segmentation
5.3.1 Soft Drink Concentrates Market, By Application
5.3.2 Non-Carbonated Soft Drink Concentrates Market, By Flavor
5.3.3 Soft Drink Concentrates Market, By End Use
5.3.4 Soft Drink Concentrates Market, By Region
5.4 Market Dynamics
5.4.1 Drivers
5.4.1.1 Rising Global Population & Increasing Demand for Healthy Food
5.4.1.2 Economic Potential of Fruit Concentrates Due to Increased Fruit Production in the Market
5.4.1.3 Improvement in Operational Efficiency
5.4.2 Restraint
5.4.2.1 Increase in Demand for Nfc Juices
5.4.3 Opportunity
5.4.3.1 Increasing Disposable Income in Emerging Markets
5.4.4 Challenge
5.4.4.1 Hazard Prevention
6 Industry Trends (Page No. - 51)
6.1 Introduction
6.2 Supply Chain Analysis
6.3 Industry Insights
6.3.1 Fda, Efsa & Codex
6.3.2 Codex Alimentarius
6.4 Porter�s Five Forces Analysis
6.4.1 Intensity of Competitive Rivalry
6.4.2 Bargaining Power of Suppliers
6.4.3 Bargaining Power of Buyers
6.4.4 Threat From New Entrants
6.4.5 Threat of Substitutes
6.5 Strategic Benchmarking
6.5.1 Market Expansion Through Acquisitions
7 Regulations in the Soft Drink Concentrates Market (Page No. - 57)
7.1 Introduction
7.2 Soft Drink Tax Regulations
7.2.1 Soft Drink Tax
7.2.2 Exemptions
7.3 Fssai Regulations
7.3.1 Use of Lake Colors as Colorant in Foods
7.3.2 Use of Permitted Synthetic Food Colors Prohibited
7.3.3 Restriction on Use & Sale of Artificial Sweeteners
7.4 Usda � Cfr (Code of Federal Regulations)
7.4.1 Enforcing the Cfr Regulations
7.5 Regulations in Different Regions
7.5.1 Main European Regulations
7.5.2 Fiap (Food Improvement Agents Package) Regulations
7.6 Legislation & Consumer Demand
8 Soft Drink Concentrates Market, By Application (Page No. - 63)
8.1 Introduction
8.2 Carbonated
8.2.1 Carbonated Segment Holds Maximum Share in this Market
8.3 Non-Carbonated
9 Soft Drink Concentrates Market, By Flavor (Page No. - 69)
9.1 Introduction
9.2 Carbonated Soft Drink Concentrates
9.2.1 Cola
9.2.2 Non-Cola
9.3 Non-Carbonated Soft Drink Concentrates
9.3.1 Orange
9.3.2 Apple
9.3.3 Mixed Fruit
9.3.4 Grapes
9.3.5 Pineapple
9.3.6 Grapefruit
9.3.7 Mango
9.3.8 Others
10 Soft Drink Concentrates Market, By End Use (Page No. - 85)
10.1 Introduction
10.2 Mass Merchandise
10.3 Food Service
10.4 Fountain Machine
10.5 Others
11 Soft Drink Concentrates Market, By Region (Page No. - 91)
11.1 Introduction
11.2 Pest Analysis
11.2.1 Political Factors
11.2.1.1 Mandatory Nutrition Labeling
11.2.1.2 Rising Middle Class Population With High Purchasing Power
11.2.2 Economic Factors
11.2.3 Social Factors
11.2.3.1 Human Health Concerns
11.2.4 Technological Factors
11.2.4.1 R&D
11.3 North America
11.3.1 U.S.
11.3.2 Mexico
11.3.3 Canada
11.4 Europe
11.4.1 U.K.
11.4.2 Germany
11.4.3 France
11.4.4 Italy
11.4.5 Spain
11.4.6 The Netherlands
11.4.7 Greece
11.4.8 Russia
11.4.9 Poland
11.4.10 Rest of Europe
11.5 Asia-Pacific
11.5.1 China
11.5.2 Indonesia
11.5.3 Japan
11.5.4 India
11.5.5 Thailand
11.5.6 Australia
11.5.7 Rest of Asia-Pacific
11.6 Latin America
11.6.1 Brazil
11.6.2 Argentina
11.6.3 Rest of Latin America
11.7 RoW
11.7.1 African Countries
11.7.2 Others in RoW
12 Competitive Landscape (Page No. - 137)
12.1 Overview
12.2 Top Three Companies With Their Respective Market Share
12.3 Soft Drink Concentrates Market Share(Developments), By Company, 2009-2015
12.4 Competitive Situation & Trends
12.5 Expansions & Mergers
12.6 New Product Launches
12.7 Acquisitions
12.8 Agreements, Joint Ventures & Partnerships
13 Company Profiles (Page No. - 146)
(Company at A Glance, Recent Financials, Products & Services, Strategies & Insights, & Recent Developments)*
13.1 Introduction
13.2 Pepsico, Inc.
13.3 The Coca-Cola Company
13.4 Dr Pepper Snapple Group, Inc.
13.5 Monster Beverage Corporation
13.6 Cott Corporation
13.7 Dohler Group
13.8 Royal Cosun
13.9 David Berryman Limited
13.10 Big Red Inc.
13.11 Royal Crown Cola Company, Inc.
*Details on Company at A Glance, Recent Financials, Products & Services, Strategies & Insights, & Recent Developments Might Not Be Captured in Case of Unlisted Companies.
14 Appendix (Page No. - 175)
14.1 Insights of Industry Experts
14.2 Discussion Guide
14.3 Introducing RT: Real-Time Market Intelligence
14.4 Available Customizations
14.5 Related Reports
List of Tables (91 Tables)
Table 1 Impact of Key Drivers on this Market
Table 2 Impact of Restraining Factor on this Market
Table 3 Increasing Disposable Income in Emerging Markets to Boost Soft Drink Concentrates Market
Table 4 Preventing Accidents/Injuries is the Major Challenge
Table 5 Maximum Limit of Using Artificial Sweeteners in Soft Drink Concentrates
Table 6 Minimum Brix Level of Percentage of Juice From Concentrate
Table 7 Soft Drink Concentrates Market Size, By Application,2012-2019 ($Million)
Table 8 Carbonated Soft Drinks Concentrate Market Size, By Region,2012-2019 ($Million)
Table 9 Non-Carbonated Soft Drink Concentrates Market Size, By Region,2012-2019 ($Million)
Table 10 Carbonated Soft Drink Concentrates Market Size, By Flavor,2012-2019 ($Million)
Table 11 Cola Concentrate for Carbonated Soft Drinks Market Size, By Region, 2012 - 2019 ($Million)
Table 12 Non-Cola Concentrate for Carbonated Soft Drinks Market Size, By Region, 2012 - 2019 ($Million)
Table 13 Soft Drink Concentrates Market Size, By Flavor, 2012-2019 ($Million)
Table 14 Orange Soft Drink Concentrates Market Size, By Region,2012-2019 ($Million)
Table 15 Apple Soft Drink Concentrates Market Size, By Region,2012-2019 ($Million)
Table 16 Mixed Fruit Soft Drink Concentrates Market Size, By Region,2012-2019 ($Million)
Table 17 Grape Soft Drink Concentrates Market Size, By Region,2012-2019 ($Million)
Table 18 Pineapple Soft Drink Concentrates Market Size, By Region,2012-2019($Million)
Table 19 Grapefruit Soft Drinks Concentrate Market Size, By Region,2012-2019($Million)
Table 20 Mango Soft Drink Concentrates Market Size, By Region,2012-2019 ($Million)
Table 21 Other Soft Drink Concentrates Market Size, By Region,2012-2019 ($Million)
Table 22 Soft Drink Concentrates Market Size, By End Use, 2012-2019 ($Million)
Table 23 Mass Merchandise in Soft Drink Concentrates Market Size, By Region, 2012-2019 ($Million)
Table 24 Food Services in Soft Drink Concentrates Market Size, By Region,2012-2019 ($Million)
Table 25 Fountain Machines in Soft Drink Concentrates Market Size, By Region, 2012-2019 ($Million)
Table 26 Others in Soft Drink Concentrates Market Size, By Region,2012-2019 ($Million)
Table 27 Soft Drink Concentrates Market Size, By Region, 2012-2019 ($Million)
Table 28 North America: Soft Drink Concentrates Market Size, By Country,2012�2019 ($Million)
Table 29 North America: Market Size, By Application, 2012�2019 ($Million)
Table 30 North America: Carbonated Soft Drink Concentrates Market Size By Country, 2012�2019 ($Million)
Table 31 North America: Carbonated Soft Drink Concentrates Market Size, By Flavor, 2012 - 2019 ($Million)
Table 32 North America: Non-Carbonated Soft Drink Concentrates Market Size, By Country, 2012�2019 ($Million)
Table 33 North America: Non-Carbonated Soft Drink Concentrates Market Size, By Flavor, 2012�2019 ($Million)
Table 34 North America: Soft Drink Concentrates Market Size, By End Use,2012-2019 ($Million)
Table 35 U.S.: Soft Drink Concentrates Market Size, By Application,2012�2019 ($Million)
Table 36 Mexico: Soft Drink Concentrates Market Size, By Application,2012�2019 ($Million)
Table 37 Canada: Soft Drink Concentrates Market Size, By Application,2012�2019 ($Million)
Table 38 Europe: Soft Drink Concentrates Market Size, By Country,2012�2019 ($Million)
Table 39 Europe: Market Size, By Application,2012-2019 ($Million)
Table 40 Europe: Carbonated Soft Drink Concentrates Market Size, By Country, 2012�2019 ($Million)
Table 41 Europe: Carbonated Soft Drink Concentrates Market Size, By Flavor, 2012 - 2019 ($Million)
Table 42 Europe: Non-Carbonated Soft Drink Concentrates Market Size, By Country, 2012�2019 ($Million)
Table 43 Europe: Non-Carbonated Soft Drink Concentrates Market Size, By Flavor, 2012-2019 ($Million)
Table 44 Europe: Soft Drink Concentrates Market Size, By End Use,2012-2019 ($Million)
Table 45 U.K.: Soft Drink Concentrates Market Size, By Application,2012-2019 ($Million)
Table 46 Germany: Soft Drink Concentrates Market Size, By Application,2012-2019 ($Million)
Table 47 France: Soft Drink Concentrates Market Size, By Application,2012-2019 ($Million)
Table 48 Italy: Soft Drink Concentrates Market Size, By Application,2012-2019 ($Million)
Table 49 Spain: Soft Drink Concentrates Market Size, By Application,2012-2019 ($Million)
Table 50 The Netherlands: Soft Drink Concentrates Market Size, By Application, 2012-2019 ($Million)
Table 51 Greece: Soft Drink Concentrates Market Size, By Application,2012-2019 ($Million)
Table 52 Russia: Soft Drink Concentrates Market Size, By Application,2012-2019 ($Million)
Table 53 Poland: Soft Drink Concentrates Market Size, By Application,2012-2019 ($Million)
Table 54 Rest of Europe: Soft Drink Concentrates Market Size, By Application, 2012-2019 ($Million)
Table 55 Asia-Pacific: Soft Drink Concentrates Market Size, By Country,2012�2019 ($Million)
Table 56 Asia-Pacific: Market Size, By Application,2012�2019 ($Million)
Table 57 Asia-Pacific: Carbonated Soft Drink Concentrates Market Size, By Country, 2012�2019 ($Million)
Table 58 Asia-Pacific: Carbonated Soft Drink Concentrates Market Size, By Flavor, 2012 - 2019 ($Million)
Table 59 Asia-Pacific: Non-Carbonated Soft Drink Concentrates Market Size, By Country, 2012�2019 ($Million)
Table 60 Asia-Pacific: Non-Carbonated Soft Drink Concentrates Market Size, By Flavor, 2012�2019 ($Million)
Table 61 Asia-Pacific: Soft Drink Concentrates Market Size, By End Use,2012-2019 ($Million)
Table 62 China: Soft Drink Concentrates Market Size, By Application,2012�2019 ($Million)
Table 63 Indonesia: Soft Drink Concentrates Market Size, By Application,2012�2019 ($Million)
Table 64 Japan: Soft Drink Concentrates Market Size, By Application,2012�2019 ($Million)
Table 65 India: Soft Drink Concentrates Market Size, By Application,2012�2019 ($Million)
Table 66 Thailand: Soft Drink Concentrates Market Size, By Application,2012�2019 ($Million)
Table 67 Australia: Soft Drink Concentrates Market Size, By Application,2012�2019 ($Million)
Table 68 Rest of Asia-Pacific: Soft Drink Concentrates Market Size, By Application, 2012�2019 ($Million)
Table 69 Latin America: Soft Drink Concentrates Market Size, By Country,2012-2019 ($Million)
Table 70 Latin America: Market Size, By Application, 2012-2019 ($Million)
Table 71 Latin America: Carbonated Soft Drink Concentrates Market Size, By Country, 2012-2019 ($Million)
Table 72 Latin America: Carbonated Soft Drink Concentrates Market Size By Flavor, 2012 - 2019 ($Million)
Table 73 Latin America: Non-Carbonated Soft Drink Concentrates Market Size, By Country, 2012-2019 ($Million)
Table 74 Latin America: Non-Carbonated Soft Drink Concentrates Market Size, By Flavor,2012-2019 ($Million)
Table 75 Latin America: Soft Drink Concentrates Market Size, By End Use,2012-2019 ($Million)
Table 76 Brazil: Soft Drink Concentrates Market Size, By Application,2012-2019 ($Million)
Table 77 Argentina: Soft Drink Concentrates Market Size, By Application,2012-2019 ($Million)
Table 78 Rest of Latin America: Soft Drink Concentrates Market Size, By Application, 2012-2019 ($Million)
Table 79 RoW: Soft Drink Concentrates Market Size, By Country,2012-2019 ($Million)
Table 80 RoW: Market Size, By Application,2012-2019 ($Million)
Table 81 RoW: Carbonated Soft Drink Concentrates Market Size, By Country, 2012-2019 ($Million)
Table 82 RoW: Carbonated Soft Drink Concentrates Market Size, By Flavor,2012 - 2019 ($Million)
Table 83 RoW: Non-Carbonated Soft Drink Concentrates Market Size, By Country, 2012-2019 ($Million)
Table 84 RoW: Non-Carbonated Soft Drink Concentrates Market Size, By Flavor, 2012-2019 ($Million)
Table 85 RoW: Soft Drink Concentrates Market Size, By End Use,2012-2019 ($Million)
Table 86 African Countries: Soft Drink Concentrates Market Size, By Application, 2012-2019 ($Million)
Table 87 Others in RoW: Soft Drink Concentrates Market Size, By Application, 2012-2019 ($Million)
Table 88 Expansions & Mergers, 2014-2015
Table 89 New Product Launches, 2011-2013
Table 90 Acquisitions, 2010-2014
Table 91 Agreements, Joint Ventures & Partnerships, 2012-2014
List of Figures (72 Figures)
Figure 1 Soft Drink Concentrates Market
Figure 2 Soft Drink Concentrates Market Research Design
Figure 3 Key Data From Secondary Sources
Figure 4 Key Data From Primary Sources
Figure 5 Breakdown of Primary Interviews: By Region, Designation,& Company Type
Figure 6 Top 5 Economies Based on GDP are U.S., China, India, Japan, & Germany
Figure 7 Global Population Projected to Reach ~9.5 Billion By 2050
Figure 8 Market Size Estimation Methodology: Bottom-Up Approach
Figure 9 Market Size Estimation Methodology: Top-Down Approach
Figure 10 Market Breakdown & Data Triangulation
Figure 11 Assumptions of the Study
Figure 12 Limitations of the Study
Figure 13 Soft Drink Concentrates Market Growth Trend (2014 vs. 2019)
Figure 14 Non-Carbonated Concentrates: Most Attractive Segment for Investment During the Forecast Period
Figure 15 Asia-Pacific Market Projected to Register High Growth Rate, 2014�2019
Figure 16 Orange Flavor to Dominate the Global Non-Carbonated Soft Drink Concentrates Market, 2014�2019
Figure 17 Europe Held Maximum Market Share in Soft Drink Concentrates Market, 2013
Figure 18 Strong Growth Potential With Demand for Healthy Food,2014�2019 ($Million)
Figure 19 Gaining Market Significance for Orange & Apple Flavor Concentrates, 2014�2019 ($Million)
Figure 20 Growth Rate to Be High for Non-Carbonated Concentrates in Asia-Pacific From 2014 to 2019
Figure 21 Maximum Consumption in U.S. & Mexico, 2013
Figure 22 Non-Carbonated Segment of Soft Drink Concentrates Projected to Benefit the Market From 2014 to 2019
Figure 23 Asia-Pacific Showcases Strong Growth Potential During the Forecast Period
Figure 24 Soft Drink Concentrates Market Evolution
Figure 25 Soft Drink Concentrates Market, By Application
Figure 26 Non-Carbonated Soft Drink Concentrates Market, By Flavor
Figure 27 Soft Drink Concentrates Market, By Region
Figure 28 Rising Demand for Healthy Food Around the Globe Drives the Soft Drink Concentrates Market
Figure 29 Global Fruit Production From 2009 to 2013 (MT)
Figure 30 Porter�s Five Forces Analysis (2014): Quality Product & Cost-Effectiveness Intensified Industrial Rivalry
Figure 31 Recent Developments of Major Players in Soft Drink Concentrate Market
Figure 32 Non-Carbonated Concentrate is Expected to Be the Fastest Growing Segment in the Forecast Period(2014-2019)
Figure 33 Europe Held Maximum Share in Carbonated Soft Drink Concentrates Segment in 2014
Figure 34 Europe Dominated the Non-Carbonated Soft Drink Concentrates Segment in 2014
Figure 35 Orange Flavor Segment is Projected to Dominate the Non-Carbonated Soft Drinks Market From 2014 to 2019
Figure 36 Asia-Pacific to Grow at Highest CAGR in Orange Soft Drink Concentrates Market in 2014, ($Million)
Figure 37 North America Had Largest Share in Apple Soft Drink Concentrates Segment in 2014, ($Million)
Figure 38 Europe is Expected to Dominate the Mixed Fruit Soft Drink Concentrates Segment Throughout the Forecast Period ($Million)
Figure 39 Grape Soft Drink Concentrates Segment Dominated By Europe in 2014, Projected to Remain the Same Till 2019, ($Million)
Figure 40 Europe Held the Largest Share in Pineapple Soft Drink Concentrates Segment in 2014, ($Million)
Figure 41 North America Dominated the Grapefruit Soft Drink Concentrates Segment in 2014, ($Million)
Figure 42 North America Led the Mango Soft Drink Concentrates Segment in 2014, ($Million)
Figure 43 Asia-Pacific is Projected to Be the Fastest Growing Market for Other Soft Drink Concentrates By 2019, ($Million)
Figure 44 Mass Merchandise Segment is Expected to Dominate the Soft Drink Concentrates Market Throughout the Forecast Period(2014-2019)
Figure 45 Soft Drink Concentrates Market in China Showed Robust Growth Rate in 2014
Figure 46 North America: Soft Drink Concentrates Market Share, By Application, 2014-2019 ($Million)
Figure 47 European Soft Drink Concentrates Market Share, By Application,2014-2019 ($Million)
Figure 48 Germany is Expected to Dominate the Soft Drink Concentrates Market in Europe Throughout the Forecast Period(2014-2019)
Figure 49 Soft Drink Concentrates Market Comparison: Carbonated & Non-Carbonated, 2014-2019 ($Million)
Figure 50 China Would Continue to Dominate the Soft Drink Concentrates Market Throughout the Forecast Period(2014-2019) ($Million)
Figure 51 Carbonated Soft Drinks Segment to Dominate in Asia-Pacific Market, 2014-2019 ($Million)
Figure 52 Orange Segment is Expected to Dominate Non-Carbonated Soft Drink Flavors Market in Asia-Pacific From 2014 to 2019 ($Million)
Figure 53 Brazil to Dominate Soft Drink Concentrates Market in Latin America, 2014-2019 ($Million)
Figure 54 Orange Segment to Dominate Soft Drink Concentrates Market, in Latin America Throughout the Forecast Period(2014-2019)
Figure 55 Acquisitions & Agreements: Current Approach of Leading Soft Drink Concentrate Players
Figure 56 The Coca-Cola Company & Dr. Pepper Snapple Group Inc. has Equal Market Share Considering Their Developments
Figure 57 Portfolio Strengthening Through Acquisitions & Agreements
Figure 58 Agreements, Joint Ventures & Partnerships: Prominent Strategies to Meet Global Demand
Figure 59 Geographical Revenue Mix of Top 5 Market Players
Figure 60 Pepsico, Inc.: Company Snapshot
Figure 61 Pepsico, Inc.: SWOT Analysis
Figure 62 The Coca-Cola Company: Company Snapshot
Figure 63 The Coca-Cola Company: SWOT Analysis
Figure 64 Dr Pepper Snapple Group, Inc.: Company Snapshot
Figure 65 Dr Pepper Snapple Group, Inc.: SWOT Analysis
Figure 66 Monster Beverage Corporation: Company Snapshot
Figure 67 Monster Beverage Corporation: SWOT Analysis
Figure 68 Cott Corporation: Company Snapshot
Figure 69 Cott Corporation: SWOT Analysis
Figure 70 Dohler Group: Company Snapshot
Figure 71 Royal Cosun: Company Snapshot
Figure 72 David Berryman Limited: Company Snapshot


Growth opportunities and latent adjacency in Soft Drink Concentrates Market