Weapon Mounts Market Size, Share & Industry Growth Analysis Report by Mount Type (Turret, Coaxial, Fixed, Pintle/Pedestal, RWS, Swing Arm, Monopods, Bipods, Tripods), Platform (Ground, Naval, Airborne), Mode of Operation, Weapon Compatibility, and Geography- Global Forecast to 2025


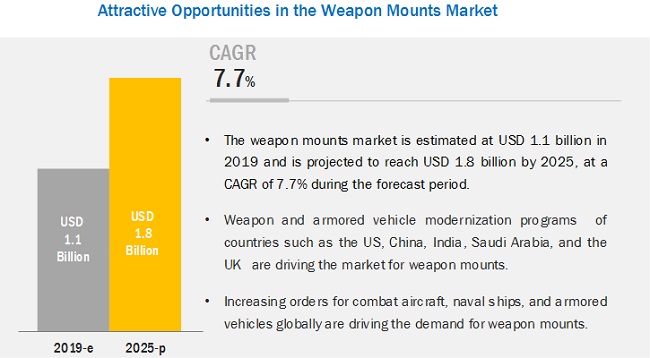
[236 Pages Report] The Weapon Mounts Market is expected to grow from $ 1.1 Billion in 2019 to $ 1.8 Billion by 2025, at a Compound Annual Growth Rate (CAGR) of 7.7% during the forecast period. Some factors that are expected to fuel the demand for Weapon Mounts Industry are the increased procurement and modernization programs by militaries globally and the demand for remote weapon stations and turrets for armored vehicles and naval ships, among others.
Based on the Platform, the Naval Segment of the Weapon Mounts Market Share is Projected to Grow at the Highest CAGR During the Forecast Period
Based on the platform, the naval segment of the weapon mounts market is projected to grow at the highest CAGR from 2019 to 2025. Multiple countries are modernizing their naval fleets to include remote weapon stations, new close-in weapon stations, and armaments. The demand for weapon mounts increases with the modernization of the naval fleet. Additionally, the increase in the procurement of naval ships such as destroyers, aircraft carriers, and corvettes, among others, by countries such as the US, Canada, India, China, and Japan, among others, is driving the market.
Based on Weapon Compatibility, the Automatic Cannons Segment is Expected to Lead the Weapon Mounts Market Share From 2019 to 2025
Based on weapon compatibility, the weapon mounts market is segmented into machine guns, automatic cannons, automatic rifles, Gatling guns, and sniper rifles. The automatic cannons segment is projected to lead the weapon mounts market during the forecast period due to the increase in armored vehicle procurement globally. Additionally, modernization programs to install remote weapon stations and turrets with advanced weapons are driving the weapon mounts market.
Based on the Mount Type, the Static Mounts Segment of the Weapon Mounts Market Share is Projected to Grow at the Highest CAGR From 2019 to 2025
Based on mount type, the weapon mounts market is segmented into static mounts and non-static mounts. The static mounts segment is projected to lead the market during the forecast period. Growth in this segment can be attributed to the demand for weapon mounts such as turrets and coaxial mounts. Additionally, the increase in demand for remote weapon stations for armored vehicles and naval ships is expected to drive the market for weapon mounts.
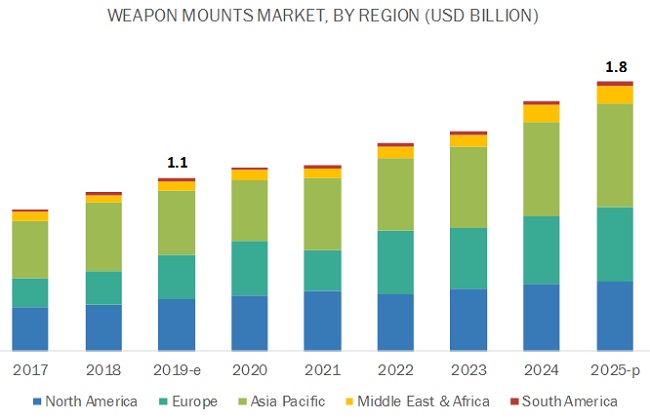
The Weapon Mounts Market in Asia Pacific is Projected to Account for the Largest Share of the Market From 2019 to 2025
Based on region, the weapon mounts market in Asia Pacific is projected to account for the largest share of the market during the forecast period due to the increased demand for weapon mounts for ground, naval, and airborne platforms.
Top Weapon Mounts Industry Companies - Key Market Players
The Weapon Mounts Companies are dominated by globally established players such as Kongsberg Gruppen (Norway), Raytheon Company (US), Elbit Systems (Israel), Saab AB (Sweden), BAE Systems (UK), Dillion Aero (US), AEI Systems Ltd. (UK), FN Herstal (Belgium), Capco LLC. (US), and ISTEC Services Ltd. (UK), among others. These players have adopted various growth strategies such as contracts, new product launches, acquisitions, partnerships, and collaborations to expand their presence in the weapon mounts market.
Scope of the Report
|
Report Attributes |
Details |
|
Estimated Market Size |
USD 1.1 billion in 2019 |
|
Projected Market Size |
USD 1.8 Billion in 2025 |
|
Growth Rate |
7.7% |
|
Growth Forecast Period |
2019–2025 |
|
On Demand Data Available |
2030 |
|
Segments Covered |
|
|
Region Covered |
|
| Market Leaders |
|
| Top Companies in North America |
|
|
Key Market Driver |
Increased procurement and modernization programs by militaries globally. |
|
Key Market Opportunity |
Increasing demand for remote weapon stations and turrets for armored vehicles and naval ships |
|
Largest Growing Region |
Asia Pacific |
|
Largest Market Share Segment |
Naval Segment |
|
Highest CAGR Segment |
Static Mounts Segment |
|
Largest Application Market Share |
Automatic Cannons Segment |
This research report categorizes the weapon mounts market based on mount type, platform, mode of operation, weapon compatibility, and region.
Based on Mount Type:
-
Static Mounts
- Turrets
- Coaxial mounts
- Fixed mounts
- Pintle/pedestal mounts
- Remote weapon station mounts
- And swing arm mounts
-
Non-static Mounts
- Monopods
- Bipods
- Tripods
Based on Mode of Operation:
- Manned
- Remotely Operated
Based on Platform:
-
Ground
-
Vehicle-mounted
- Main battle tanks
- Infantry fighting vehicles
- Armored personnel carriers
- Armored amphibious vehicles
- Light protected vehicles
- Self-propelled howitzers
- Armored mortar carriers
- Fixed Installation
- Dismounted soldiers
-
Vehicle-mounted
-
Naval
- Aircraft Carriers
- Destroyers
- Frigates
- Corvettes
- Offshore patrol vessels
-
Airborne
- Combat aircraft
- Attack helicopters
- Special mission aircraft
Based on Weapon Compatibility:
- Machine guns
- Automatic canons
- Automatic rifles
- Gatling guns
- Sniper rifles
Based on Region:
- North America
- Europe
- Asia Pacific
- Middle East
- South America
Key Questions Addressed by the Report
- What are your views on the growth perspective of the weapon mounts industry? What are the key dynamics such as drivers and opportunities, and trends that govern the market?
- What are the key sustainability strategies adopted by leading players operating in the weapon mounts?
- What are the new emerging technologies and use cases disrupting the weapon mounts market?
- What are the applications wherein weapon mounts play a significant role?
- What are the key industry trends and opportunities in the weapon mounts across different regions and their respective countries?
- Who are the key players and innovators in the ecosystem of weapon mounts?
- How is the competitive landscape changing in the client ecosystem, and how is it impacting the revenue of companies?
Frequently Asked Questions (FAQ):
What Are Some Drivers for the Weapon Mounts Market?
Some of the major drivers of the weapon mounts market include the ongoing modernization of naval vessels, the procurement of new aircraft, and the development of new armored vehicles fitted with remote weapon stations.
What Are the Opportunities Available for Weapon Mount Manufacturers?
Weapon mount manufacturers have opportunities to build lightweight, stabilized mounts for machine guns, and to supply mounts to various militaries who are procuring new sniper rifles and machine guns.
What Types of Companies Are Covered in the Report?
The weapon mounts market is categorized into two types of players, namely Tier 1 companies and Tier 2 & 3 companies. Both offer different types of weapon mounts, which vary in function, complexity, and price based on the weapon being mounted and the mode of operation.
Who Are the Major Tier 1 Players and Who Are the Major Tier 2 and 3 Players in the Weapon Mounts Market? What Growth Strategies Have They Implemented?
Major Tier 1 players include Rheinmetall AG, BAE Systems Inc., Kongsberg Gruppen AS, Elbit Systems Ltd., and Leonardo S.p.A. Major Tier 2 & 3 players include ISTEC Services Ltd., Military Systems Group, Dillon Aero, and FN Herstal, among others. Both Tiers of companies have resorted to contracting, bidding, and launching new products to grow.
What Emerging Trend Could Potentially Have a Huge Impact on the Weapon Mounts Market?
The use of weaponized drones for tactical warfare could potentially have a positive impact on the growth of the weapon mounts market as well as the type of mount used.
To speak to our analyst for a discussion on the above findings, click Speak to Analyst
 Exclusive indicates content/data unique to MarketsandMarkets and not available with any competitors.
Table of Contents
1 Introduction (Page No. - 26)
1.1 Objectives of the Study
1.2 Market Definition
1.2.1 Markets Covered
1.2.2 Regional Scope
1.2.3 Years Considered for the Study
1.3 Currency & Pricing
1.4 USD Exchange Rates
1.5 Limitations
1.6 Market Stakeholders
2 Research Methodology (Page No. - 30)
2.1 Research Data
2.1.1 Secondary Data
2.1.1.1 Key Data From Secondary Sources
2.2 Market Definition & Scope
2.2.1 Primary Data
2.2.1.1 Key Data From Primary Sources
2.2.1.2 Breakdown of Primaries
2.2.2 Segment Definitions
2.2.2.1 Weapon Mounts Market, By Mount Type
2.2.2.2 Weapon Mounts Market, By Mode of Operation
2.2.2.3 Weapon Mounts Market, By Weapon Compatibility
2.2.2.4 Weapon Mounts Market, By Platform
2.2.3 Exclusions
2.3 Market Size Estimation & Methodology
2.3.1 Top-Down Approach
2.4 Data Triangulation
2.4.1 Market Sizing & Forecasting
2.4.2 Assumptions of the Research Study
2.5 Limitations
3 Executive Summary (Page No. - 40)
4 Premium Insights (Page No. - 44)
4.1 Attractive Opportunities in Weapon Mounts Market
4.2 Ground Weapon Mounts Market, By Vehicle Type
4.3 Naval Weapon Mounts Market, By Vessel Type
4.4 Airborne Weapon Mounts Market, By Aircraft Type
4.5 Static Weapon Mounts Market, By Type
4.6 Non-Static Weapon Mounts Market, By Mount Type
4.7 Weapon Mounts Market, By Region
5 Market Overview (Page No. - 48)
5.1 Introduction
5.2 Roadmap of Weapon Mounts
5.3 Market Dynamics
5.3.1 Drivers
5.3.1.1 Increased Procurement of Armored Vehicles, Rotorcraft, Machine Guns, and Aircraft By Militaries Worldwide
5.3.1.2 Ongoing Modernization of Naval Platforms By Various Countries
5.3.1.3 Increasing Demand for Remote Weapon Stations for Military Applications
5.3.2 Restraints
5.3.2.1 High Durability of Weapon Mounts, Eliminating the Need for Replacement
5.3.2.2 Saturated Demand From Existing Platforms
5.3.3 Opportunities
5.3.3.1 Weapon Modernization Plans Across the World
5.3.3.2 Development of Highly Stabilized Mounts for Remotely Operated Weapon Systems
5.3.4 Challenges
5.3.4.1 High Technical Expertise Requirements for the Development of Weapon Mounts for Remote Operations
6 Industry Trends (Page No. - 54)
6.1 Introduction
6.2 Emerging Trends
6.2.1 Use of Remote-Controlled Weapon Stations
6.2.2 Armored Vehicles With Advanced Features for Urban Warfare
6.2.3 Weaponized Drones for Tactical Warfare
6.2.4 Improved Electromechanical Actuators
6.3 Innovations & Patent Registrations
7 Weapon Mounts Market, By Mount Type (Page No. - 57)
7.1 Introduction
7.2 Static Mounts
7.2.1 Turrets
7.2.1.1 Increase in Procurement of Armored Vehicles Drives the Market for Turrets
7.2.2 Coaxial Mounts
7.2.2.1 Wide-Scale Use in Conjunction With Turrets Drives the Market for Coaxial Mounts
7.2.3 Fixed Mounts
7.2.3.1 Global Increase in Procurement of Combat Aircraft Drives the Market for Fixed Weapon Mounts
7.2.4 Pintles/Pedestals
7.2.4.1 Low Cost of Mounting on Light Armored Vehicles Drives the Market for Pintles/Pedestal Mounts
7.2.5 Swing Arm Mounts
7.2.5.1 Need for More Flexibility in Firing Weapons Drives the Market for Swing Arm Weapon Mounts
7.2.6 Remote Weapon Stations
7.2.6.1 High Demand for Remote Weapon Stations for Main Battle Tanks Drives the Market
7.3 Non-Static Mounts
7.3.1 Monopods
7.3.1.1 Procurement Plans for Automatic Rifles Drive the Market for Monopods
7.3.2 Bipods
7.3.2.1 Demand for Sniper Rifles By Countries Deploying Troops in the Middle East Drives the Market for Bipods
7.3.3 Tripods
7.3.3.1 Increasing Use of Machine Guns to Provide Suppressing Fire Drives the Market for Tripods
8 Weapon Mounts Market, By Platform (Page No. - 65)
8.1 Introduction
8.2 Ground
8.2.1 Vehicle-Mounted
8.2.1.1 Increased Procurement of Armored Vehicles By Various Militaries Globally is Driving the Weapon Mounts Market
8.2.1.1.1 Main Battle Tanks (MBT)
8.2.1.1.2 Infantry Fighting Vehicles (IFV)
8.2.1.1.3 Armored Personnel Carriers (APC)
8.2.1.1.4 Armored Amphibious Vehicles (AAV)
8.2.1.1.5 Light Protected Vehicles (LPV)
8.2.1.1.6 Self-Propelled Howitzers (SPHS)
8.2.1.1.7 Armored Mortar Carriers (AMC)
8.2.2 Fixed Installation
8.2.2.1 Increase in Installation of Machine Guns for Border Protection Drives the Market
8.2.3 Dismounted Soldiers
8.2.3.1 Upgrades to Soldier Equipment Drive the Market for Dismounted Soldier Weapon Mounts
8.3 Naval
8.3.1 Aircraft Carriers
8.3.1.1 Upgrades and Modernization Programs of Aircraft Carriers Undertaken By Various Countries Drive the Market
8.3.2 Destroyers
8.3.2.1 Installation of New Weapons on Destroyers Drives the Market
8.3.3 Frigates
8.3.3.1 Increased Orders for Frigates By Countries Such as India, Russia, and Germany Drive the Market
8.3.4 Corvettes
8.3.4.1 Ongoing Upgrades to Corvettes of Countries Such as India, Israel, and Finland, Among Others, Drives the Market
8.3.5 Offshore Patrol Vessels (OPV)
8.3.5.1 Modernization Programs of OPVs Drive the Market
8.4 Airborne
8.4.1 Combat Aircraft
8.4.1.1 Increase in Procurement of Combat Aircraft By India, Malaysia, and Switzerland, Among Others, Drives the Weapon Mounts Market
8.4.2 Attack Helicopters
8.4.2.1 Increased Procurement of Attack Helicopters By India and South Korea, Among Others, Drives the Market
8.4.3 Special Mission Aircraft
8.4.3.1 Ongoing Procurement of Special Mission Aircraft Countries Such as Finland and Bulgaria, Among Others, Drives the Market
9 Weapon Mounts Market, By Mode of Operation (Page No. - 83)
9.1 Introduction
9.2 Manned
9.2.1 Rising Demand for Machine Guns and Sniper Rifles Drives the Market for Manned Weapon Mounts
9.3 Remotely Operated
9.3.1 Increased Use of Remote Weapon Stations Across All Platforms Drives the Market
10 Weapon Mounts Market, By Weapon Compatibility (Page No. - 87)
10.1 Introduction
10.2 Weapon Compatibility
10.2.1 Machine Guns
10.2.1.1 Increase in Demand for Remote Weapon Stations Drives the Market for Machine Gun Mounts
10.2.1.1.1 Light Machine Guns (LMG)
10.2.1.1.2 Medium Machine Guns (MMG)
10.2.1.1.3 Heavy Machine Guns (HMG)
10.2.2 Automatic Cannons
10.2.2.1 Wide-Scale Use of Automatic Cannons Drives the Market for Various Mounts
10.2.3 Automatic Rifles
10.2.3.1 Increase in Demand for Bipods Can Be Attributed to the Demand for Automatic Rifles
10.2.4 Gatling Guns
10.2.4.1 Need for Special Mounts for Aircraft-Mounted Gatling Guns Drives the Market
10.2.5 Sniper Rifles
10.2.5.1 Increasing Use of Sniper Rifles in Urban Warfare Drives the Market for Bipods
11 Regional Analysis (Page No. - 91)
11.1 Introduction
11.2 North America
11.2.1 US
11.2.1.1 Procurement of New Fighter Aircraft is Driving the Market in the US
11.2.2 Canada
11.2.2.1 Numerous Defense Procurement Projects for Land, Sea, and Air are Driving the Market
11.3 Europe
11.3.1 France
11.3.1.1 The Armored Vehicle Modernization Program is Expected to Impact the Market in France
11.3.2 Russia
11.3.2.1 Serial Production of T-90 and T-14 Armata Tanks, Among Others, Drives the Market for Weapon Mounts in Russia
11.3.3 UK
11.3.3.1 Orders for the New Family of Ajax Multi-Role Armored Vehicles in 2018-2019 Drives the Market in the UK
11.3.4 Germany
11.3.4.1 Modernization Programs for Naval, Airborne, and Land Fleets are Driving the Market in Germany
11.3.5 Italy
11.3.5.1 High Procurement Spending in 2019 is Expected to Drive the Market in Italy
11.3.6 Spain
11.3.6.1 Three Military Modernization Programs Planned Until 2032 is Expected to Impact the Weapon Mounts Market in Spain
11.3.7 Poland
11.3.7.1 Multi-Billion Military Modernization Program By Poland is Expected to Drive the Market
11.4 Asia Pacific
11.4.1 China
11.4.1.1 Major Expansion Reforms of Its Navy and Air Force are Driving the Market in China
11.4.2 India
11.4.2.1 Five-Year Modernization Plan of Its Armed Forces is Driving the Market in India
11.4.3 Japan
11.4.3.1 Increased Funding for the Acquisition of New Combat Aircraft is Driving the Market in Japan
11.4.4 South Korea
11.4.4.1 Multi-Billion Spending on Arms Purchase for Troops in 2020 is Driving the Market in South Korea
11.4.5 Australia
11.4.5.1 Procurement of New Military Capabilities From 2020–2028 is Expected to Drive the Market in Australia
11.5 The Middle East
11.5.1 Saudi Arabia
11.5.1.1 Multi-Billion Contracts With the US Drive the Weapon Mounts Market in Saudi Arabia
11.5.2 Turkey
11.5.2.1 Substantial Rise in Military Spending in 2018 has Driven the Market for Weapon Mounts in Turkey
11.5.3 Israel
11.5.3.1 Ongoing Procurement of Armored Vehicles and Combat Aircraft is Expected to Drive the Market in Israel
11.6 South America
11.6.1 Brazil
11.6.1.1 Short and Medium-Term Investments to Modernize Forces in Brazil is Expected to Drive the Market
11.6.2 Mexico
11.6.2.1 Procurement of Armored Vehicles and Weapons for Soldiers is Expected to Drive the Market in Mexico
12 Competitive Landscape (Page No. - 155)
12.1 Introduction
12.2 Competitive Analysis
12.3 Market Ranking Analysis, 2019
12.4 Competitive Leadership Mapping
12.4.1 Visionary Leaders
12.4.2 Innovators
12.4.3 Dynamic Differentiators
12.4.4 Emerging Companies
12.5 Strength of Product Portfolio
12.6 Business Strategy Excellence
12.7 Competitive Scenario
12.7.1 Contracts
12.7.2 New Product Launches
12.7.3 Acquisitions, Partnerships, and Collaborations
13 Company Profiles (Page No. - 163)
13.1 Dillon Aero
(Business Overview, Products/Services/Solutions Offered, Recent Developments, Growth Strategies (Organic and Inorganic), SWOT Analysis, and MnM View)*
13.2 AEI Systems LTD.
13.3 Military Systems Group, Inc.
13.4 Leonardo S.P.A.
13.5 Knds
13.6 FN Herstal
13.7 Ohio Ordnance Works, Inc.
13.8 Fjord Defense as
13.9 Crsystems Inc.
13.10 Capco LLC.
13.11 WE Platt
13.12 Kongsberg Defense & Aerospace
13.13 Rheinmetall AG
13.14 General Dynamics Ordnance and Tactical Systems
13.15 Engine Engineering Company
13.16 Cantine Armament Incorporated
13.17 Aselsan A.S.
13.18 Valhalla Turrets D.O.O.
13.19 Tmil Systems
13.20 Istec Services LTD.
13.21 Raytheon Company
13.22 Elbit Systems
13.23 SAAB AB
13.24 Electro Optic Systems
13.25 BAE Systems
13.26 Rafael Advanced Defense Systems LTD.
13.27 ST Engineering
13.28 China North Industries Corporation (Norinco)
13.29 IMI Systems
13.30 Jenoptik
13.31 Otokar as
13.32 Denel Vehicle Systems
13.33 Moog Inc.
13.34 Curtiss-Wright
*Details on Business Overview, Products/Services/Solutions Offered, Recent Developments, Growth Strategies (Organic and Inorganic), SWOT Analysis, and MnM View Might Not Be Captured in Case of Unlisted Companies.
14 Appendix (Page No. - 229)
14.1 Discussion Guide
14.2 Industry Experts
14.3 Knowledgestore: Marketsandmarkets™ Subscription Portal
14.4 Available Customizations
14.5 Related Reports
14.6 Author Details
List of Tables (208 Tables)
Table 1 Global Market Summation
Table 2 Assumptions for the Research Study
Table 3 Machine Gun Procurement By Militaries Worldwide
Table 4 Procurement Programs By Militaries Worldwide
Table 5 Ongoing Modernizations of Naval Platforms
Table 6 Expected Future Requirement for Remote Weapon Stations, By Country
Table 7 Boxer Armored Vehicle Armaments
Table 8 Types of Weaponized Drones
Table 9 Innovations & Patent Registrations, 2016–2019
Table 10 Weapon Mount Market Size, By Mount Type, 2017—2025 (USD Million)
Table 11 Static Weapon Mount Market Size, By Region, 2017—2025 (USD Million)
Table 12 Static Weapon Mount Market Size, By Type, 2017—2025 (USD Million)
Table 13 Examples of Gun Pod Units
Table 14 Swing Arm Mounts: Weapon Compatibility
Table 15 Non-Static Weapon Mount Market Size, By Region, 2017—2025 (USD Million)
Table 16 Non-Static Weapon Mount Market Size, By Type, 2017—2025 (USD Million)
Table 17 Top 10 Sniper Rifles Worldwide
Table 18 Weapon Mount Market Size, By Platform, 2017—2025 (USD Million)
Table 19 Ground Weapon Mount Market Size, By Type, 2017—2025 (USD Million)
Table 20 Ground Weapon Mount Market Size, By Region, 2017—2025 (USD Million)
Table 21 Vehicle-Mounted Weapon Mount Market Size, By Vehicle Type, 2017—2025 (USD Million)
Table 22 Weapon Mounts: Configurations for Armored Vehicles
Table 23 Global Fleet of Main Battle Tanks as of December 2019
Table 24 Global Fleet of Infantry Fighting Vehicles as of December 2019
Table 25 Global Fleet of Self-Propelled Howitzers as of December 2019
Table 26 Naval Weapon Mount Market Size, By Vessel Type, 2017—2025 (USD Million)
Table 27 Naval Weapon Mount Market Size, By Region, 2017—2025 (USD Million)
Table 28 Number of Aircraft Carriers, By Country, February 2020
Table 29 Number of Destroyers, By Country, February 2020
Table 30 Number of Frigates, By Country, February 2020
Table 31 Number of Corvettes, By Country, February 2020
Table 32 Number of OPVs, By Country, February 2020
Table 33 Airborne Weapon Mount Market Size, By Aircraft Type, 2017—2025 (USD Million)
Table 34 Airborne Weapon Mount Market Size, By Region, 2017—2025 (USD Million)
Table 35 Number of Fighter Aircraft, By Country, February 2020
Table 36 Number of Military Helicopters, By Country, February 2020
Table 37 Number of Special Mission Aircraft, By Country, February 2020
Table 38 Weapon Mount Market Size, By Mode of Operation, 2017—2025 (USD Million)
Table 39 Manned Weapon Mount Market Size, By Region, 2017—2025 (USD Million)
Table 40 Machine Gun Procurement Plans, By Country
Table 41 Sniper Rifle Procurement Plans, By Country
Table 42 Remotely Operated Weapon Mount Market Size, By Region, 2017—2025 (USD Million)
Table 43 Weapon Mount Market Size, By Weapon Compatibility, 2017—2025 (USD Million)
Table 44 North America: Weapon Mount Market Size, By Mount Type, 2017–2025 (USD Million)
Table 45 North America: Weapon Mount Market Size, By Platform, 2017–2025 (USD Million)
Table 46 North America: Weapon Mount Market Size, By Mode of Operation, 2017–2025 (USD Million)
Table 47 North America: Weapon Mount Market Size, By Weapon Compatibility, 2017–2025 (USD Million)
Table 48 North America: Ground Weapon Mount Market Size, By Type, 2017–2025 (USD Million)
Table 49 North America: Vehicle-Mounted Weapon Mount Market Size, By Vehicle Type, 2017–2025 (USD Million)
Table 50 North America: Naval Weapon Mount Market Size, By Vessel Type, 2017–2025 (USD Million)
Table 51 North America: Airborne Weapon Mount Market Size, By Aircraft Type, 2017–2025 (USD Million)
Table 52 North America: Weapon Mount Market Size, By Country, 2017–2025 (USD Million)
Table 53 US Contracts for Remote Weapon Stations, 2012-2017
Table 54 US: Weapon Mount Market Size, By Platform, 2017–2025 (USD Million)
Table 55 US: Weapon Mount Market Size, By Mode of Operation, 2017–2025 (USD Million)
Table 56 US: Weapon Mount Market Size, By Mount Type, 2017–2025 (USD Million)
Table 57 US: Vehicle-Mounted Weapon Mount Market Size, By Vehicle Type, 2017–2025 (USD Million)
Table 58 US: Naval Weapon Mount Market Size, By Vessel Type, 2017–2025 (USD Million)
Table 59 US: Airborne Weapon Mount Market Size, By Aircraft Type, 2017–2025 (USD Million)
Table 60 Canada: Weapon Mount Market Size, By Platform, 2017–2025 (USD Million)
Table 61 Canada: Weapon Mount Market Size, By Mode of Operation, 2017–2025 (USD Million)
Table 62 Canada: Weapon Mount Market Size, By Mount Type, 2017–2025 (USD Million)
Table 63 Canada: Vehicle-Mounted Weapon Mount Market Size, By Vehicle Type, 2017–2025 (USD Million)
Table 64 Canada: Naval Weapon Mount Market Size, By Vessel Type, 2017–2025 (USD Million)
Table 65 Canada: Airborne Weapon Mount Market Size, By Aircraft Type, 2017–2025 (USD Million)
Table 66 Europe: Weapon Mount Market Size, By Mount Type, 2017–2025 (USD Million)
Table 67 Europe: Weapon Mount Market Size, By Platform, 2017–2025 (USD Million)
Table 68 Europe: Ground Weapon Mount Market Size, By Type, 2017–2025 (USD Million)
Table 69 Europe: Vehicle-Mounted Weapon Mounts Size, By Vehicle Type, 2017–2025 (USD Million)
Table 70 Europe: Naval Weapon Mounts Size, By Vessel Type, 2017–2025 (USD Million)
Table 71 Europe: Airborne Weapon Mounts Size, By Aircraft Type, 2017–2025 (USD Million)
Table 72 Europe: Weapon Mounts Size, By Mode of Operation, 2017–2025 (USD Million)
Table 73 Europe: Weapon Mounts Size, By Weapon Compatibility, 2017–2025 (USD Million)
Table 74 Europe: Weapon Mounts Size, By Country, 2017–2025 (USD Million)
Table 75 France: Weapon Mounts Size, By Platform, 2017–2025 (USD Million)
Table 76 France: Weapon Mounts Size, By Mode of Operation, 2017–2025 (USD Million)
Table 77 France: Weapon Mounts Size, By Mount Type, 2017–2025 (USD Million)
Table 78 France: Vehicle-Mounted Weapon Mounts Size, By Vehicle Type, 2017–2025 (USD Million)
Table 79 France: Naval Weapon Mounts Size, By Vessel Type, 2017–2025 (USD Million)
Table 80 France: Airborne Weapon Mounts Size, By Aircraft Type, 2017–2025 (USD Million)
Table 81 Russia: Weapon Mounts Size, By Platform, 2017–2025 (USD Million)
Table 82 Russia: Weapon Mounts Size, By Mode of Operation, 2017–2025 (USD Million)
Table 83 Russia: Weapon Mounts Size, By Mount Type, 2017–2025 (USD Million)
Table 84 Russia: Vehicle-Mounted Weapon Mounts Size, By Vehicle Type, 2017–2025 (USD Million)
Table 85 Russia: Naval Weapon Mounts Size, By Vessel Type, 2017–2025 (USD Million)
Table 86 Russia: Airborne Weapon Mounts Size, By Aircraft Type, 2017–2025 (USD Million)
Table 87 UK: Equipment Plan Funding Allocations, 2018-2028
Table 88 UK: Weapon Mounts Size, By Platform, 2017–2025 (USD Million)
Table 89 UK Weapon Mounts Size, By Mode of Operation, 2017–2025 (USD Million)
Table 90 UK: Weapon Mounts Size, By Mount Type, 2017–2025 (USD Million)
Table 91 UK: Vehicle-Mounted Weapon Mounts Size, By Vehicle Type, 2017–2025 (USD Million)
Table 92 UK: Naval Weapon Mounts Size, By Vessel Type, 2017–2025 (USD Million)
Table 93 UK: Airborne Weapon Mounts Size, By Aircraft Type, 2017–2025 (USD Million)
Table 94 Germany: Weapon Mounts Size, By Platform, 2017–2025 (USD Million)
Table 95 Germany Weapon Mounts Size, By Mode of Operation, 2017–2025 (USD Million)
Table 96 Germany Weapon Mounts Size, By Mount Type, 2017–2025 (USD Million)
Table 97 Germany: Vehicle-Mounted Weapon Mounts Size, By Vehicle Type, 2017–2025 (USD Million)
Table 98 Germany: Naval Weapon Mounts Size, By Vessel Type, 2017–2025 (USD Million)
Table 99 Germany: Airborne Weapon Mounts Size, By Aircraft Type, 2017–2025 (USD Million)
Table 100 Italy: Weapon Mounts Size, By Platform, 2017–2025 (USD Million)
Table 101 Italy: Weapon Mounts Size, By Mode of Operation, 2017–2025 (USD Million)
Table 102 Italy: Weapon Mounts Size, By Mount Type, 2017–2025 (USD Million)
Table 103 Italy: Vehicle-Mounted Weapon Mounts Size, By Vehicle Type, 2017–2025 (USD Million)
Table 104 Italy: Naval Weapon Mounts Size, By Vessel Type, 2017–2025 (USD Million)
Table 105 Italy: Airborne Weapon Size, By Aircraft Type, 2017–2025 (USD Million)
Table 106 Spain: Weapon Mounts Size, By Platform, 2017–2025 (USD Million)
Table 107 Spain: Weapon Mounts Size, By Mode of Operation, 2017–2025 (USD Million)
Table 108 Spain: Weapon Mounts Size, By Mount Type, 2017–2025 (USD Million)
Table 109 Spain: Vehicle-Mounted Weapon Mounts Size, By Vehicle Type, 2017–2025 (USD Million)
Table 110 Spain: Naval Weapon Mounts Size, By Vessel Type, 2017–2025 (USD Million)
Table 111 Spain: Airborne Weapon Mounts Size, By Aircraft Type, 2017–2025 (USD Million)
Table 112 Poland: Weapon Mounts Size, By Platform, 2017–2025 (USD Million)
Table 113 Poland: Weapon Mounts Size, By Mode of Operation, 2017–2025 (USD Million)
Table 114 Poland: Weapon Mounts Size, By Mount Type, 2017–2025 (USD Million)
Table 115 Poland: Vehicle-Mounted Weapon Mounts Size, By Vehicle Type, 2017–2025 (USD Million)
Table 116 Poland: Naval Weapon Mounts Size, By Vessel Type, 2017–2025 (USD Million)
Table 117 Poland: Airborne Weapon Mounts Size, By Aircraft Type, 2017–2025 (USD Million)
Table 118 Asia Pacific: Weapon Mounts Size, By Mount Type, 2017–2025 (USD Million)
Table 119 Asia Pacific: Weapon Mounts Size, By Platform, 2017–2025 (USD Million)
Table 120 Asia Pacific: Ground Weapon Mounts Size, By Type, 2017–2025 (USD Million)
Table 121 Asia Pacific: Vehicle-Mounted Weapon Mounts Size, By Vehicle Type, 2017–2025 (USD Million)
Table 122 Asia Pacific: Naval Weapon Mounts Size, By Vessel Type, 2017–2025 (USD Million)
Table 123 Asia Pacific: Airborne Weapon Mounts Size, By Aircraft Type, 2017–2025 (USD Million)
Table 124 Asia Pacific: Weapon Mounts Size, By Mode of Operation, 2017–2025 (USD Million)
Table 125 Asia Pacific: Weapon Mounts Size, By Weapon Compatibility, 2017–2025 (USD Million)
Table 126 Asia Pacific: Weapon Mounts Size, By Country, 2017–2025 (USD Million)
Table 127 China: Weapon Mounts Size, By Platform, 2017–2025 (USD Million)
Table 128 China: Weapon Mounts Size, By Mode of Operation, 2017–2025 (USD Million)
Table 129 China: Weapon Mounts Size, By Mount Type, 2017–2025 (USD Million)
Table 130 China: Vehicle-Mounted Weapon Mounts Size, By Vehicle Type, 2017–2025 (USD Million)
Table 131 China: Naval Weapon Mounts Size, By Vessel Type, 2017–2025 (USD Million)
Table 132 China: Airborne Weapon Mounts Size, By Aircraft Type, 2017–2025 (USD Million)
Table 133 India: Weapon Mounts Size, By Platform, 2017–2025 (USD Million)
Table 134 India: Weapon Mounts Size, By Mode of Operation, 2017–2025 (USD Million)
Table 135 India: Weapon Mounts Size, By Mount Type, 2017–2025 (USD Million)
Table 136 India: Vehicle-Mounted Weapon Mounts Size, By Vehicle Type, 2017–2025 (USD Million)
Table 137 India: Naval Weapon Mounts Size, By Vessel Type, 2017–2025 (USD Million)
Table 138 India: Airborne Weapon Mounts Size, By Aircraft Type, 2017–2025 (USD Million)
Table 139 Japan: Weapon Mounts Size, By Platform, 2017–2025 (USD Million)
Table 140 Japan: Weapon Mounts Size, By Mode of Operation, 2017–2025 (USD Million)
Table 141 Japan: Weapon Mounts Size, By Mount Type, 2017–2025 (USD Million)
Table 142 Japan: Vehicle-Mounted Weapon Mounts Size, By Vehicle Type, 2017–2025 (USD Million)
Table 143 Japan: Naval Weapon Mounts Size, By Vessel Type, 2017–2025 (USD Million)
Table 144 Japan: Airborne Weapon Mounts Size, By Aircraft Type, 2017–2025 (USD Million)
Table 145 South Korea: Weapon Mounts Size, By Platform, 2017–2025 (USD Million)
Table 146 South Korea: Weapon Mounts Size, By Mode of Operation, 2017–2025 (USD Million)
Table 147 South Korea: Weapon Mounts Size, By Mount Type, 2017–2025 (USD Million)
Table 148 South Korea: Vehicle-Mounted Weapon Mounts Size, By Vehicle Type, 2017–2025 (USD Million)
Table 149 South Korea: Naval Weapon Mounts Size, By Vessel Type, 2017–2025 (USD Million)
Table 150 South Korea: Airborne Weapon Mounts Size, By Aircraft Type, 2017–2025 (USD Million)
Table 151 Australia: Weapon Mounts Size, By Platform, 2017–2025 (USD Million)
Table 152 Australia: Weapon Mounts Size, By Mode of Operation, 2017–2025 (USD Million)
Table 153 Australia: Weapon Mounts Size, By Mount Type, 2017–2025 (USD Million)
Table 154 Australia: Vehicle-Mounted Weapon Mounts Size, By Vehicle Type, 2017–2025 (USD Million)
Table 155 Australia: Naval Weapon Mounts Size, By Vessel Type, 2017–2025 (USD Million)
Table 156 Australia: Airborne Weapon Mounts Size, By Aircraft Type, 2017–2025 (USD Million)
Table 157 Middle East: Weapon Mounts Size, By Mount Type, 2017–2025 (USD Million)
Table 158 Middle East: Weapon Mounts Size, By Platform, 2017–2025 (USD Million)
Table 159 Middle East: Weapon Mounts Size, By Mode of Operation, 2017–2025 (USD Million)
Table 160 Middle East: Weapon Mounts Size, By Weapon Compatibility, 2017–2025 (USD Million)
Table 161 Middle East: Ground Weapon Mounts Size, By Type, 2017–2025 (USD Million)
Table 162 Middle East: Vehicle-Mounted Weapon Mounts Size, By Vehicle Type, 2017–2025 (USD Million)
Table 163 Middle East: Naval Weapon Mounts Size, By Vessel Type, 2017–2025 (USD Million)
Table 164 Middle East: Airborne Weapon Mounts Size, By Aircraft Type, 2017–2025 (USD Million)
Table 165 Middle East: Weapon Mounts Size, By Country, 2017–2025 (USD Million)
Table 166 Saudi Arabia: Weapon Mounts Size, By Platform, 2017–2025 (USD Million)
Table 167 Saudi Arabia: Weapon Mounts Size, By Mode of Operation, 2017–2025 (USD Million)
Table 168 Saudi Arabia: Weapon Mounts Size, By Mount Type, 2017–2025 (USD Million)
Table 169 Saudi Arabia: Vehicle-Mounted Weapon Mounts Size, By Vehicle Type, 2017–2025 (USD Million)
Table 170 Saudi Arabia: Naval Weapon Mounts Size, By Vessel Type, 2017–2025 (USD Million)
Table 171 Saudi Arabia: Airborne Weapon Mounts Size, By Aircraft Type, 2017–2025 (USD Million)
Table 172 Turkey: Weapon Mounts Size, By Platform, 2017–2025 (USD Million)
Table 173 Turkey: Weapon Mounts Size, By Mode of Operation, 2017–2025 (USD Million)
Table 174 Turkey: Weapon Mounts Size, By Mount Type, 2017–2025 (USD Million)
Table 175 Turkey: Vehicle-Mounted Weapon Mounts Size, By Vehicle Type, 2017–2025 (USD Million)
Table 176 Turkey: Naval Weapon Mounts Size, By Vessel Type, 2017–2025 (USD Million)
Table 177 Turkey: Airborne Weapon Mounts Size, By Aircraft Type, 2017–2025 (USD Million)
Table 178 Israel: Weapon Mounts Size, By Platform, 2017–2025 (USD Million)
Table 179 Israel: Weapon Mounts Size, By Mode of Operation, 2017–2025 (USD Million)
Table 180 Israel: Weapon Mounts Size, By Mount Type, 2017–2025 (USD Million)
Table 181 Israel: Vehicle-Mounted Weapon Mounts Size, By Vehicle Type, 2017–2025 (USD Million)
Table 182 Israel: Naval Weapon Mounts Size, By Vessel Type, 2017–2025 (USD Million)
Table 183 Israel: Airborne Weapon Mounts Size, By Aircraft Type, 2017–2025 (USD Million)
Table 184 South America: Weapon Mounts Size, By Mount Type, 2017–2025 (USD Million)
Table 185 South America: Weapon Mounts Size, By Platform, 2017–2025 (USD Million)
Table 186 South America: Weapon Mounts Size, By Mode of Operation, 2017–2025 (USD Million)
Table 187 South America: Weapon Mounts Size, By Weapon Compatibility, 2017–2025 (USD Million)
Table 188 South America: Ground Weapon Mounts Size, By Type, 2017–2025 (USD Million)
Table 189 South America: Vehicle-Mounted Weapon Mounts Size, By Vehicle Type, 2017–2025 (USD Million)
Table 190 South America: Naval Weapon Mounts Size, By Ship Type, 2017–2025 (USD Million)
Table 191 South America: Airborne Weapon Mounts Size, By Aircraft Type, 2017–2025 (USD Million)
Table 192 South America: Weapon Mounts Size, By Country, 2017–2025 (USD Million)
Table 193 Brazil: Weapon Mounts Size, By Platform, 2017–2025 (USD Million)
Table 194 Brazil: Weapon Mounts Size, By Mode of Operation, 2017–2025 (USD Million)
Table 195 Brazil: Weapon Mounts Size, By Mount Type, 2017–2025 (USD Million)
Table 196 Brazil: Vehicle-Mounted Weapon Mounts Size, By Vehicle Type, 2017–2025 (USD Million)
Table 197 Brazil: Naval Weapon Mounts Size, By Vessel Type, 2017–2025 (USD Million)
Table 198 Brazil: Airborne Weapon Mounts Size, By Aircraft Type, 2017–2025 (USD Million)
Table 199 Mexico: Weapon Mounts Size, By Platform, 2017–2025 (USD Million)
Table 200 Mexico: Weapon Mounts Size, By Mode of Operation, 2017–2025 (USD Million)
Table 201 Mexico: Weapon Mounts Size, By Mount Type, 2017–2025 (USD Million)
Table 202 Mexico: Vehicle-Mounted Weapon Mounts Size, By Vehicle Type, 2017–2025 (USD Million)
Table 203 Mexico: Naval Weapon Mounts Size, By Vessel Type, 2017–2025 (USD Million)
Table 204 Mexico: Airborne Weapon Mounts Size, By Aircraft Type, 2017–2025 (USD Million)
Table 205 Contracts, January 2015–January 2020
Table 206 New Product Launches, January 2015–January 2020
Table 207 Acquisitions, Partnerships, and Collaborations, January 2015–January 2020
Table 208 Mount Types and Weapon Compatibility
List of Figures (69 Figures)
Figure 1 Report Process Flow
Figure 2 Weapon Mounts Market: Research Design
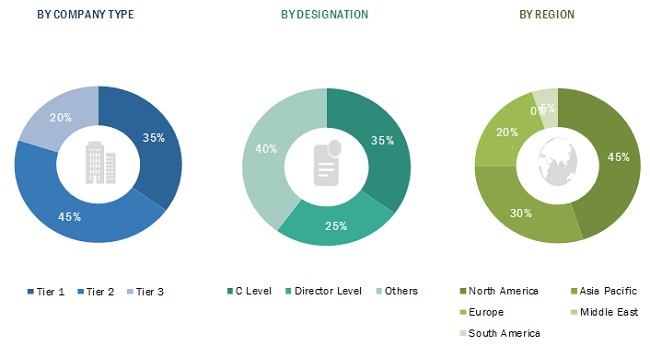
Figure 3 Breakdown of Primary Interviews: By Company Type, Designation, and Region
Figure 4 Market Size Estimation Methodology: Bottom-Up Approach
Figure 5 Market Size Estimation Methodology: Top-Down Approach
Figure 6 Data Triangulation
Figure 7 Static Mounts Segment Projected to Dominate the Weapon Mounts Market By Mount Type From 2019 to 2025
Figure 8 Remotely Operated Weapons Mount Segment Projected to Lead From 2019 to 2025
Figure 9 Automatic Cannons Segment Projected to have the Highest CAGR in the Weapon Mounts Market From 2019 to 2025
Figure 10 Naval Weapon Mounts Projected to Be the Largest Segment From 2019 to 2025
Figure 11 Weapon Mounts Market in the Middle East to Grow the Fastest From 2019 to 2025
Figure 12 Increase in Orders for Combat Aircraft, Armored Vehicles, and Naval Ships is One of the Major Drivers of the Weapon Mounts Market
Figure 13 Light Protected Vehicles Segment Expected to Grow at the Highest CAGR During Forecast Period
Figure 14 Corvettes Segment Expected to Grow at the Highest CAGR During Forecast Period
Figure 15 Combat Aircraft Segment Expected to Grow at the Highest CAGR During Forecast Period
Figure 16 Pintle/Pedestal Mounts Segment Expected to Grow at the Highest CAGR During Forecast Period
Figure 17 Tripods Segment Expected to Lead the Weapon Mounts Market During the Forecast Period
Figure 18 Weapon Mounts Market in the Middle East Projected to Grow at the Highest CAGR During Forecast Period
Figure 19 Use of Weapon Mounts on Armored Vehicles
Figure 20 Weapon Mounts Market Dynamics: Drivers, Restraints, Opportunities, and Challenges
Figure 21 Top 15 Military Spending Countries, 2018 (USD Billion)
Figure 22 Major Industry Trends
Figure 23 Static Mounts Segment is Projected to Grow at the Highest CAGR During the Forecast Period
Figure 24 The Naval Segment is Projected to Grow at the Highest CAGR During the Forecast Period
Figure 25 Manned Segment is Projected to Grow at the Highest CAGR During the Forecast Period
Figure 26 Automatic Cannons Segment is Projected to Grow at the Highest CAGR During the Forecast Period
Figure 27 Asia Pacific Estimated to Account for Largest Share of Weapon Mounts Market in 2019
Figure 28 North America Weapon Mounts Market Snapshot
Figure 29 US Defense Budget 2010-2018
Figure 30 US Modernization Budget Breakdown 2019 (USD Billion)
Figure 31 Canada Defense Budget 2010-2018
Figure 32 Europe Weapon Mounts Market Snapshot
Figure 33 France Defense Budget 2010-2018
Figure 34 Russia Defense Budget 2010-2018
Figure 35 UK Defense Budget 2010-2018
Figure 36 Germany Defense Budget 2010-2018
Figure 37 Italy Defense Budget 2010-2018
Figure 38 Spain Defense Budget 2010-2018
Figure 39 Poland Defense Budget 2010-2018
Figure 40 Asia Pacific Weapon Mounts Market Snapshot
Figure 41 China Defense Budget 2010-2018
Figure 42 India Defense Budget 2010-2018
Figure 43 Japan Defense Budget 2010-2018
Figure 44 South Korea Defense Budget 2010-2018
Figure 45 Australia Defense Budget 2010-2018
Figure 46 Middle East Weapon Mounts Market Snapshot
Figure 47 Saudi Arabia Defense Budget 2010-2018
Figure 48 Turkey Defense Budget 2010-2018
Figure 49 Israel Defense Budget 2010-2018
Figure 50 Brazil Defense Budget 2010-2018
Figure 51 Mexico Defense Budget 2010-2018
Figure 52 Rank Analysis of Key Players in the Weapon Mounts Market, 2019
Figure 53 Weapon Mounts Competitive Leadership Mapping, 2018
Figure 54 Turret Systems Competitive Leadership Mapping, 2018
Figure 55 Leonardo S.P.A.: Company Snapshot
Figure 56 Leonardo S.P.A.: Business Strategy and Right to Win Factor
Figure 57 Rheinmetall AG: Company Snapshot
Figure 58 Rheinmetall AG: Business Strategy and Right to Win Factor
Figure 59 Aselsan A.S.: Company Snapshot
Figure 60 Aselsan A.S.: Business Strategy and Right to Win Factor
Figure 61 Raytheon Company: Company Snapshot
Figure 62 Elbit Systems: Company Snapshot
Figure 63 SAAB AB: Company Snapshot
Figure 64 Electro Optic Systems: Company Snapshot
Figure 65 BAE Systems: Company Snapshot
Figure 66 ST Engineering: Company Snapshot
Figure 67 Jenoptik: Company Snapshot
Figure 68 Moog Inc.: Company Snapshot
Figure 69 Curtiss-Wright: Company Snapshot
Extensive secondary research was undertaken to collect information on the weapon mounts market, its adjacent markets, and its parent market. The next step was to validate these findings, assumptions, and sizing with industry experts across the value chain through primary research. Both, the demand- and supply-side analyses were employed to estimate the overall size of the market. Thereafter, the market breakdown and data triangulation procedures were used to estimate the market sizes of different segments and subsegments.
Secondary Research
In the secondary research process, various sources such as Statista, World Bank, Global Firepower, Defense IQ, Factiva, Bloomberg, BusinessWeek, SEC filings, annual reports, press releases & investor presentations of companies, certified publications, and articles by recognized authors were referred to for identifying and collecting information on the weapon mounts market.
Primary Research
The weapon mounts market comprises several stakeholders, such as raw material suppliers, processors, end-product manufacturers, and integratory and regulatory organizations in its supply chain. The demand side of this market is characterized by the military forces of different countries. The supply side is characterized by technologically advanced hardware manufacturers for weapon mounts catering to the ground, naval, and airborne platforms.
Following is the breakdown of the primary respondents that were interviewed to obtain qualitative and quantitative information about the weapon mounts market.
To know about the assumptions considered for the study, download the pdf brochure
Market Size Estimation
Both, the top-down and bottom-up approaches were used to estimate and validate the total size of the weapon mounts market. These methods were also used extensively to estimate the size of various segments and subsegments of the market. The research methodology used to estimate the market size included the following.
- Key players in the industry and market were identified through extensive secondary research of their product matrix, their geographical presence, and developments undertaken by them.
- All percentage shares, splits, and breakdowns were determined using secondary sources and verified through primary sources.
Data Triangulation
After arriving at the overall size of the weapon mounts market using the market size estimation processes explained above, the market was split into several segments and subsegments. To complete the overall market engineering process and arrive at the exact statistics of each market segment and subsegment, the data triangulation and market breakdown procedures were employed, wherever applicable. The data was triangulated by studying various factors and trends from the demand as well as supply sides of the weapon mounts market.
Report Objectives
- To define, describe, and forecast the size of the weapon mounts market based on mount type, platform, weapon compatibility, mode of operation, and region
- To identify and analyze key drivers, restraints, opportunities, and challenges influencing the growth of the markets
- To identify trends, market trends, and technology trends currently prevailing in the market
- To analyze micromarkets1 with respect to individual technological trends, prospects, and their contribution to the overall market
- To forecast the size of segments of the weapons mounts market based on five regions, namely, North America, Europe, Asia Pacific, Middle East, and South America, along with major countries in each region
- To provide a detailed competitive landscape of the market and analyze competitive growth strategies such as contracts, new product launches, acquisitions, partnerships, and collaborations adopted by key players in the market
- To identify detailed financial positions, key products, unique selling points, and key developments of leading companies in the market
- To strategically profile key players and comprehensively analyze their market ranking and core competencies2
Available Customizations
With the given market data, MarketsandMarkets offers customizations according to the specific requirements of companies.
Product Analysis
- Product matrix, which gives a detailed comparison of the product portfolio of each company
Company Information
- Detailed analysis and profiles of additional market players (up to 5)


Growth opportunities and latent adjacency in Weapon Mounts Market