Wearable Computing Market by Application (Fitness and Wellness, Medical and Healthcare, Enterprise and Industrial, Infotainment, and Others), by Technology (Computing, Display, Networking, and Others), & Geography - Global Forecast to 2020


The total wearable computing market is expected to reach up to $34.61 Billion by 2020, growing at a CAGR of 20.7% between 2015 and 2020.
Wearable computers or products are small electronic devices worn by users which enable mobile computing and wireless networking. Wearable technology is poised to revolutionize the way humans interact with the world around them. Wearable products comprise smart devices equipped with microchips, sensors, and wireless communication capabilities. These devices collect data, track activities, and provide customized experiences to user�s needs and desires.
The wearable computing market in this report is segmented into fitness and wellness, medical and healthcare, enterprise and industrial, infotainment, and other applications. The infotainment application is expected to grow at the highest value of $16.7 Billion by 2020. The increasing adoption of wearable devices such as smartwatches and augmented devices in the consumer market is contributing to the growth of the wearable market.
The wearable computing market by geography is categorized into four regions including the Americas, Europe, Asia-Pacific (APAC), and Rest of the World (RoW). During the forecast period between 2015 and 2020, APAC region is expected to grow at the highest CAGR with 33.9% mainly due to the rapid expansion of Chinese economy as its government is planning to modernize its economic infrastructure.
On the other hand, the factors that slow down the growth of the wearable computing market are the high initial prices for various products including activity trackers, smartwatches, and smart glasses among others. Thus, the wearable device is limited to only high-end consumer space in most of the products.
This report profiles all the major companies involved in the wearable computing market such as Adidas AG (Germany), Apple, Inc. (U.S.), Fitbit, Inc. (U.S.), Pebble Technology Corporation (U.S.), Garmin Ltd. (U.S.), Jawbone (U.S.), LG Electronics Inc. (South Korea), Motorola Mobility Holdings, Inc. (U.S.), Sony Corporation (Japan), Samsung Electronics Co., Ltd. (South Korea) and Zephyr Technology Corporation (U.S.)., among others.
Scope of the report:
This report categorizes the global wearable computing market for wearable computing on the basis of application, technology, and geography.
Market segmentation by application:
The wearable computing market on the basis of application is segmented into Fitness and Wellness, Medical and Healthcare, Enterprise and Industrial, Infotainment, and Others. These applications are further classified into various products.
Market segmentation by technology:
The wearable computing market on the basis of technology is segmented into various computing technologies, display technologies, networking technologies, and others.
Market segmentation by geography:
The geographic analysis covers the Americas, Europe, Asia-Pacific, and rest of the world (RoW). The cross segmentation data included in the report provides an in-depth insight into the regional markets.
This report on the wearable computing market is aimed towards analyzing the major industry segments such as fitness and wellness, medical and healthcare, enterprise and industrial, and infotainment industries for the same.
The factors such as, increasing adoption of smartwatches, activity trackers and new product launches are driving the wearable computing market. The growth of wearable computing market is driven by increasing number of applications and growing investments in the wearable market. This report profiles all the major companies involved in the wearable market such as Apple, Inc. (U.S.), Fitbit, Inc. (U.S.), Pebble Technology Corporation (U.S.), Garmin Ltd. (U.S.), Jawbone (U.S.), LG Corporation (South Korea), Motorola Mobility Holdings, Inc. (U.S.), Sony Corporation (Japan), and Samsung Electronics Co., Ltd. (South Korea) among others.
The wearable computing market has been classified based on application, technology, and geography. In terms of application, the market has been segmented into fitness and wellness, medical and healthcare, enterprise and industrial, infotainment, and others. These applications are further categorized into major products such as, wristbands, smart clothing, foot wear, continuous glucose monitors, drug delivery products, ECG monitors, hand-worn terminals, smartwatches, and augmented realty devices among others. In terms of technology, the market has been segmented into computing, display, networking, and other technologies. The growth of the market in the APAC region can be attributed to the increasing adoption of these products in multiple application areas.
Wearable Computing Market (2013 - 2020)
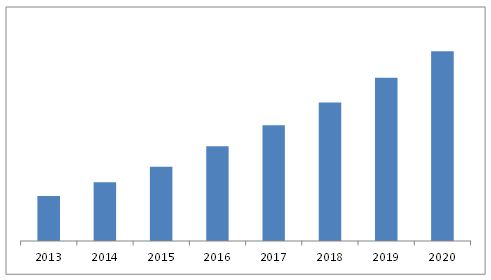
Source: MarketsandMarkets Analysis
 Exclusive indicates content/data unique to MarketsandMarkets and not available with any competitors.
Table of Contents
1 Introduction (Page No. - 15)
1.1 Study Objectives
1.2 Market Definition
1.3 Study Scope
1.3.1 Markets Covered
1.3.2 Years Considered for the Study
1.4 Currency
1.5 Limitations
1.6 Stakeholders
2 Research Methodology (Page No. - 18)
2.1 Research Data
2.1.1 Secondary Data
2.1.1.1 Key Data From Secondary Sources
2.1.2 Primary Data
2.1.2.1 Key Data From Primary Sources
2.1.2.2 Key Industry Insights
2.1.2.3 Breakdown of Primaries Interviews: By Company Type, Designation, and Region
2.2 Factor Analysis
2.2.1 Introduction
2.2.2 Demand-Side Analysis
2.2.2.1 Growing Demand for Wearable Devices
2.2.3 Supply-Side Analysis
2.2.3.1 Increase in the Number of Product Launches in the Market
2.2.3.2 Growing Usage of Wearable Devices in Military
2.3 Market Size Estimation
2.3.1 Bottom-Up Approach
2.3.2 Top-Down Approach
2.4 Market Breakdown and Data Triangulation
2.5 Assumptions
3 Executive Summary (Page No. - 29)
4 Premium Insights (Page No. - 35)
4.1 Attractive Market Opportunities in Wearable Computing
4.2 Market: By Application
4.3 Market in the Asia-Pacific Region
4.4 Wearable Computing Fitness and Wellness Application Market, By Geography
4.5 Life Cycle Analysis, By Geography
5 Market Overview (Page No. - 39)
5.1 Market Segmentation
5.1.1 Market, By Application
5.1.2 Market, By Technology
5.1.3 Market, By Geography
5.2 Market Evolution
5.3 Market Dynamics
5.3.1 Drivers
5.3.1.1 Increasing Adoption of Smartwatches and Wristbands in Consumer Market
5.3.1.2 Rising Focus Towards Communication, Networking, and Recognition Technologies for Wearables
5.3.1.3 Growing Popularity of Internet of Things
5.3.1.4 Increasing Popularity of Wearable Health and Medical Devices.
5.3.2 Restraints
5.3.2.1 High Initial Price Range of Body and Eye Wear
5.3.2.2 Power Consumption and Limited Battery Life
5.3.2.3 Social Acceptance Factor
5.3.3 Opportunities
5.3.3.1 Penetration of Smart Clothing in the European Region With Increased Funding
5.3.3.2 Development of Key Enabling Technologies
5.3.3.3 Increasing Adoption of Wearables in Multiple Application Areas
5.3.4 Challenges
5.3.4.1 Technical Difficulties
5.3.4.2 Device Protection and Thermal Consideration
5.3.5 Burning Issue
5.3.5.1 Unaddressed Regulatory Issues
5.3.6 Winning Imperative
5.3.6.1 Investment From Major Players Such as Google, Microsoft, Apple, Motorola, and Various Fitness Devices Manufacturers
6 Industry Trends (Page No. - 52)
6.1 Introduction
6.2 Value Chain Analysis
6.3 Porter�s Five Forces Analysis
6.3.1 Intensity of Competitive Rivalry
6.3.2 Threat of Substitutes
6.3.3 Bargaining Power of Buyers
6.3.4 Bargaining Power of Suppliers
6.3.5 Threat of New Entrants
6.4 Strategic Benchmarking
6.4.1 Technology Integration and Product Enhancement
7 Wearable Computing Market, By Application (Page No. - 62)
7.1 Introduction
7.2 Fitness and Wellness Application
7.2.1 Wristbands
7.2.2 Smart Clothing
7.2.3 Footwear
7.2.4 Others
7.3 Medical and Healthcare
7.3.1 Continuous Glucose Monitors
7.3.2 Drug Delivery Products
7.3.3 ECG Monitoring
7.3.4 Others
7.4 Enterprise and Industrial
7.4.1 Hand-Worn Terminals
7.4.2 Others
7.5 Infotainment
7.5.1 Smartwatches
7.5.2 Augmented Reality Devices
7.5.2.1 Head-Up Displays
7.5.2.2 Head-Mounted Displays
7.5.2.3 Smart Glasses
7.6 Others
8 Wearable Computing Market, By Technology (Page No. - 90)
8.1 Introduction
8.1.1 Computing Technologies
8.1.1.1 Wearable Computers
8.1.2 Display Technologies
8.1.2.1 Virtual Reality
8.1.2.2 Augmented Reality
8.1.3 Networking Technologies
8.1.3.1 Bluetooth
8.1.3.2 Wi-Fi
8.1.3.3 Others
8.1.4 Other Technologies
9 Geographic Analysis (Page No. - 96)
9.1 Introduction
9.2 The Americas
9.2.1 U.S.
9.2.2 Canada
9.2.3 Mexico
9.3 Europe
9.3.1 U.K.
9.3.2 Germany
9.3.3 France
9.3.4 Rest of Europe
9.4 Asia-Pacific
9.4.1 China
9.4.2 Japan
9.4.3 South Korea
9.4.4 India
9.4.5 Rest of APAC
9.5 Rest of the World (RoW)
9.5.1 Middle East
9.5.2 Africa
10 Competitive Landscape (Page No. - 127)
10.1 Overview
10.2 Market Ranking for Wearable Computing Market, 2014
10.3 Competitive Scenario
10.4 Recent Developments
10.4.1 New Product Launches
10.4.2 Partnerships, Agreements, and Contracts & Collaborations
10.4.3 Mergers and Acquisitions
11 Company Profiles (Page No. - 134)
(Overview, Products and Services, Financials, Strategy & Development)*
11.1 Introduction
11.2 Adidas AG
11.3 Apple Inc.
11.4 Boston Scientific Corporation
11.5 Fitbit Inc.
11.6 Garmin, Ltd.
11.7 Jawbone
11.8 LG Electronics, Inc.
11.9 Motorola Mobility Holdings, Inc.
11.10 Nike, Inc.
11.11 Pebble Technology, Corporation
11.12 Samsung Electronics Co., Ltd
11.13 Sony Corporation
11.14 Zephyr Technology Corporation
*Details on Overview, Products and Services, Financials, Strategy & Development Might Not Be Captured in Case of Unlisted Companies.
12 Appendix (Page No. - 164)
12.1 Insights of Industry Experts
12.2 Discussion Guide
12.3 Introducing RT: Real Time Market Intelligence
12.4 Available Customizations
12.5 Related Reports
List of Tables (71 Tabls)
Table 1 Adoption of Smartwatches and Wristbands in the Consumer Market Propels the Growth of Market
Table 2 High Initial Price S Act as A Hindrance to the Market
Table 3 Penetration of Smart Clothing in the European Region With Increased Funding, is A Huge Opportunity for the Market
Table 4 List of Projects Funded By the European Union
Table 5 The Porter�s Five Forces Analysis: High Degree of Competition is Likely to Have Maximum Impact on the Overall Market,2014
Table 6 Wearable Computing Market, By Application, 2013 � 2020 ($Million)
Table 7 Market, By Application, 2013 � 2020 (Million Units)
Table 8 Wearable Fitness & Wellness Computing Application Market, 2013 � 2020 ($Million)
Table 9 Wearable Fitness & Wellness Computing Application Market, 2013 � 2020 (Million Units)
Table 10 Wearable Fitness & Wellness Computing Market, By Geography, 2013 � 2020 ($Million)
Table 11 Wearable Fitness & Wellness Computing Market, By Geography, 2013 � 2020 (Million Units)
Table 12 Wearable Medical & Healthcare Application Market, 2013 � 2020 ($Million)
Table 13 Wearable Medical & Healthcare Application Market, 2013 � 2020 (Thousand Units)
Table 14 Wearable Medical & Healthcare Application Market, By Geography, 2013 � 2020 ($Million)
Table 15 Wearable Medical & Healthcare Application Market, By Geography, 2013 � 2020 (Thousand Units)
Table 16 Wearable Enterprise & Industrial Application Market, 2013 � 2020 ($Million)
Table 17 Wearable Enterprise & Industrial Application Market, 2013 � 2020 (Thousand Units)
Table 18 Wearable Enterprise & Industrial Market, By Geography, 2013 � 2020 ($Million)
Table 19 Wearable Enterprise & Industrial Market, By Geography, 2013 � 2020 (Thousand Units)
Table 20 Wearable Infotainment Application Market, 2013 � 2020 ($Million)
Table 21 Wearable Infotainment Application Market, 2013 � 2020 (Million Units)
Table 22 Wearable Infotainment Application Market, By Augmented Reality Devices, 2013 � 2020 ($Million)
Table 23 Wearable Infotainment Application Market, By Augmented Reality Devices, 2013 � 2020 (Thousand Units)
Table 24 Wearable Infotainment Application Market, By Geography, 2013 � 2020 ($Million)
Table 25 Wearable Infotainment Application Market, By Geography, 2013 � 2020 (Million Units)
Table 26 Wearable Computing Others Application Market, 2013 � 2020 ($Million)
Table 27 Wearable Computing Others Application Market, 2013 � 2020 (Million Units)
Table 28 Wearable Computing Others Application Market, By Geography, 2013 � 2020 ($Million)
Table 29 Wearable Computing Others Application Market, By Geography, 2013 � 2020 (Thousand Units)
Table 30 Market, By Geography, 2013 � 2020 ($Million)
Table 31 Market, By Geography, 2013 � 2020 (Million Units)
Table 32 The Americas Market, By Region, 2013 � 2020 ($Million)
Table 33 The Americas Market, By Region, 2013 � 2020 (Million Units)
Table 34 The Americas Market, By Country, 2013 � 2020 ($Million)
Table 35 The Americas Market, By Country, 2013 � 2020 (Million Units)
Table 36 The Americas Market, By Application, 2013 � 2020 ($Million)
Table 37 The Americas Market, By Application, 2013 � 2020 (Million Units)
Table 38 The Americas Market, By Fitness & Wellness Application, 2013 � 2020 ($Million)
Table 39 The Americas Market, By Medical & Healthcare Application, 2013 � 2020 ($Million)
Table 40 The Americas Market, By Enterprise & Industrial Application, 2013 � 2020 ($Million)
Table 41 The Americas Market, By Infotainment Application, 2013 � 2020 ($Million)
Table 42 The Americas Market, By Others Application, 2013 � 2020 ($Million)
Table 43 Europe Market, By Country, 2013 � 2020 ($Million)
Table 44 Europe Market, By Country, 2013 � 2020 (Million Units)
Table 45 Europe Market, By Application, 2013 � 2020 ($Million)
Table 46 Europe Market, By Application, 2013 � 2020 (Thousand Units)
Table 47 Europe Market, By Fitness & Wellness Application, 2013 � 2020 ($Million)
Table 48 Europe Market, By Medical & Healthcare Application, 2013 � 2020 ($Million)
Table 49 Europe Market, By Enterprise & Industrial Application, 2013 � 2020 ($Million)
Table 50 Europe Market, By Infotainment Application, 2013 � 2020 ($Million)
Table 51 Europe Market, By Others Application, 2013 � 2020 ($Million)
Table 52 APAC Market, By Country, 2013 � 2020 ($Million)
Table 53 APAC Market, By Country, 2013 � 2020 (Million Units)
Table 54 APAC Market, By Application, 2013 � 2020 ($Million)
Table 55 APAC Market, By Application, 2013 � 2020 (Thousand Units)
Table 56 APAC Market, By Fitness & Wellness Application, 2013 � 2020 ($Million)
Table 57 APAC Market, By Medical & Healthcare Application, 2013 � 2020 ($Million)
Table 58 APAC Market, By Enterprise & Industrial Application, 2013 � 2020 ($Million)
Table 59 APAC Market, By Infotainment Application, 2013 � 2020 ($Million)
Table 60 APAC Market, By Others Application, 2013 � 2020 ($Million)
Table 61 RoW Market, By Region, 2013 � 2020 ($Million)
Table 62 RoW Market, By Region, 2013 � 2020 (Million Units)
Table 63 RoW Market, By Application, 2013 � 2020 ($Million)
Table 64 RoW Market, By Application, 2013 � 2020 (Thousand Units)
Table 65 RoW Market, By Fitness & Wellness Application, 2013 � 2020 ($Million)
Table 66 RoW Market, By Medical & Healthcare Application, 2013 � 2020 ($Million)
Table 67 RoW Market, By Enterprise & Industrial Application, 2013 � 2020 ($Million)
Table 68 RoW Market, By Infotainment Application, 2013 � 2020 ($Million)
Table 69 RoW Market, By Others Application, 2013 � 2020 ($Million)
Table 70 Market Ranking of the Top 5 Players in the Market, 2014
Table 71 New Product Launches, 2013-2015
List of Figures (84 Figures)
Figure 1 Research Design
Figure 2 Wearable Devices Market Size, 2010-2012
Figure 3 Product Launches in the Market, 2013-2015
Figure 4 Market Size Estimation Methodology: Bottom-Up Approach
Figure 5 Market Size Estimation Methodology: Top-Down Approach
Figure 6 Assumptions for the Research Study
Figure 7 Infotainment Application Accounted for the Maximum Market Share in Market in 2014
Figure 8 Smartwatches Segment is Expected to Witness Higher Growth Rate in Comparison to Augmented Reality Devices Segment
Figure 9 Hand-Worn Terminals Segment is Estimated to Account for the Highest Market Value in the Enterprise and Industrial Application During the Forecast Period
Figure 10 APAC Region Market Analysis, By Country, 2014
Figure 11 Global Market Share, By Geography, 2014
Figure 12 Increasing Adoption of Smartwatches, Fitness Bands, and Smart Clothing Provide Opportunities in Wearable Computing
Figure 13 The Enterprise and Industrial Segment is Expected to Grow at the Highest CAGR During the Forecast Period
Figure 14 Wristbands Market for Wearable Computing is Estimated to Capture the Lion�s Share in the Emerging Asia-Pacific Market, 2015
Figure 15 APAC is Projected to Grow at the Highest CAGR as Compared to Other Regions From 2015 to 2020
Figure 16 The Market is in Growing Stage in the APAC Region, 2015
Figure 17 Wearable Computing Market: Segmentation
Figure 18 By Application
Figure 19 By Technology
Figure 20 By Geography
Figure 21 Evolution of the Market
Figure 22 Market Dynamics: Overview
Figure 23 Smartwatch Shipments By Company, 2014
Figure 24 Share of Americans, Who Owned Different Medical and Health Wearable Devices in 2014
Figure 25 Average Market Prices for Various Wearable Devices
Figure 26 Life Cycle of Wearable Products, 2014
Figure 27 Value Chain Analysis: Major Value is Added During the Assembly and Distribution Phases
Figure 28 The Porter�s Five Forces Analysis:
Figure 29 Market: Porter�s Five Forces Analysis
Figure 30 Intensity of Competitive Rivalry: High Competition in the Market Due to the New Product Launches and Innovations
Figure 31 Threat of Substitutes Will Be High Due to Availability of Substitute Products
Figure 32 Bargaining Power of Buyers: As the Adoption Rate of Buyers is High, They Will Have A High Bargaining Power
Figure 33 Bargaining Power of Suppliers: Technological Factors in Wearables Will Drive the Market for Suppliers During the Forecast Period
Figure 34 Threat of New Entrants: With Innovative Product Developments New Entrants are Likely to Enter This Market
Figure 35 Strategic Benchmarking: Key Players Largely Adopted Organic Growth Strategies Such as New Product Launches
Figure 36 Segmentation of the Market: By Application
Figure 37 Infotainment Application: Largest Market Share in the Market Between 2014 and 2020
Figure 38 Segmentation of the Market: By Fitness and Wellness Application
Figure 39 Smart Clothing is Expected to Grow at the Highest CAGR in Fitness and Wellness Application Market From 2014 to 2020
Figure 40 The Americas: Expected to Grow at A Highest Market Value in the Fitness and Wellness Market Between 2014 and 2020
Figure 41 Segmentation of the Market: By Medical and Healthcare Application
Figure 42 ECG Monitors: Expected to Grow at the Highest CAGR in the Medical and Healthcare Application Market Between 2014 and 2020
Figure 43 The Americas: Expected to Grow at the Highest Market Value in the Medical and Healthcare Application Market Between 2014 and 2020
Figure 44 Segmentation of the Market: By Enterprise and Industrial Application
Figure 45 Hand-Worn Terminals Segment is Expected to Grow at the Highest Market Value in the Enterprise and Industrial Market From 2014 to 2020
Figure 46 APAC Region is Expected to Grow at the Highest Rate in the Enterprise and Industrial Application Market Between 2014 and 2020
Figure 47 Segmentation of the Market: By Infotainment Application
Figure 48 Segmentation of the Wearable Computing Augmented Reality Devices
Figure 49 Smartwatches are Projected to Increase at the Highest CAGR in the Infotainment Application Market Between 2014 and 2020
Figure 50 Smart Glasses are Expected to Grow at the Highest Market Value in the Augmented Reality Devices Market From 2014 to 2020
Figure 51 The Americas are Expected to Grow at the Highest Market Value Between 2014 and 2020 in the Infotainment Application Market
Figure 52 Segmentation of the Market: By Other Application
Figure 53 Ties and Collars Segment is Projected to Grow at the Highest Market Value in Others Application Market Between 2014 and 2020
Figure 54 The Americas are Projected to Grow at the Highest Market Value in Others Application Market From 2014 to 2020
Figure 55 Segmentation of the Market: By Technology
Figure 56 Segmentation of the Display Technology
Figure 57 Segmentation of the Networking Technology
Figure 58 Wearable Computing Market, By Region
Figure 59 Geographic Snapshot (2014) - APAC Region is Estimated to Register the Highest Growth Rate During the Forecast Period
Figure 60 Among All Countries, the U.S. is Considered to Dominate in the Market Between 2014 and 2020
Figure 61 The Americas Market Snapshot: The Market Would Be Driven By the Growing Demand From Medical and Healthcare Applications During the Forecast Period
Figure 62 Segmentation: Americas
Figure 63 Europe Market Snapshot: The Demand for Wearable Computing Would Be Driven By Wide Opportunities Coming Up in the Various Application Markets
Figure 64 Segmentation: Europe
Figure 65 APAC Market Snapshot: The Demand Would Be Driven By the Presence of Various Major Players in the Region and the Growing Regional Economy
Figure 66 Segmentation: APAC
Figure 67 Segmentation: RoW
Figure 68 Key Growth Strategies Adopted By the Top Companies Between 2012 and 2015
Figure 69 Market Evaluation Framework: New Product Launches Fuelled Growth and Innovation in 2013 and 2014
Figure 70 Battle for Market Share: New Product Launches Was the Key Strategy
Figure 71 Geographic Revenue Mix of Major Market Players
Figure 72 Adidas AG: Company Snapshot
Figure 73 Apple Inc.: Company Snapshot
Figure 74 Boston Scientific Corp.: Company Snapshot
Figure 75 Garmin Ltd.: Company Snapshot
Figure 76 Garmin, Ltd.: SWOT Analysis
Figure 77 LG Electronics Inc.: Company Snapshot
Figure 78 LG Electronics, Inc.: SWOT Analysis
Figure 79 Motorola Mobility Holdings, Inc.: SWOT Analysis
Figure 80 Nike, Inc.: Company Snapshot
Figure 81 Pebble Technology Corp.: SWOT Analysis
Figure 82 Samsung Electronics Co., Ltd.: Company Snapshot
Figure 83 Samsung Electronics Co., Ltd.: SWOT Analysis
Figure 84 Sony Corporation: Company Snapshot


Growth opportunities and latent adjacency in Wearable Computing Market