Solid Sulphur Market by Manufacturing Process - Application (Fertilizer, Chemical Processing, Metal Manufacturing), Region (North America, Europe, Central Europe, APAC, Middle East & Africa, South America) - Global Forecast to 2025


Updated on : June 18, 2024
Solid Sulphur Market
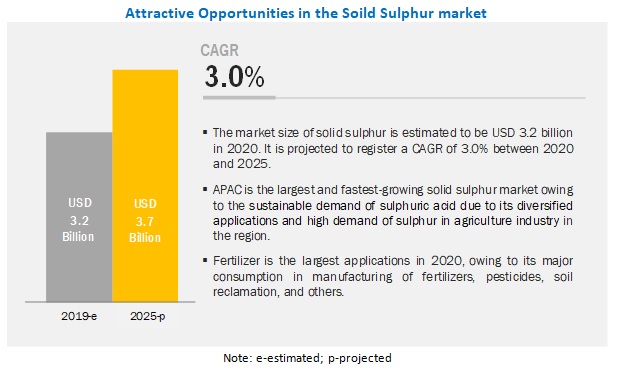
The solid sulphur market was valued at USD 3.2 billion in 2020 and is projected to reach USD 3.7 billion by 2025, growing at 3.0% cagr from 2020 to 2025. The market is driven majorly by its huge consumption in fertilizer, chemical processing, and metal manufacturing.
Solid Sulphur Market Dynamics
Fertilizer segment is largest and fastest-growing application of solid sulphur
The fertilizer segment is the largest and the fastest-growing application of solid sulphur. Sulphur is a high purity chemical used in the making of fertilizers, vulcanization of rubber, and chemical processing.
Growth in demand for solid sulphur majorly driven by huge consumption in agriculture sector.
The solid sulphur market size is estimated to be USD 3,268.7 million in 2020 and is projected to reach USD 3,789.3 million by 2025, at a CAGR of 3.0 %. The high growth witnessed in the fertilizers market in the developing economies of APAC is a key factor driving the solid sulphur market. APAC is the fastest-growing market for fertilizer. With the boost in the economy, the APAC market is witnessing high growth with respect to chemicals and materials, thus fueling the solid sulphur market. However, the high cost of extraction through mining is a restrain.
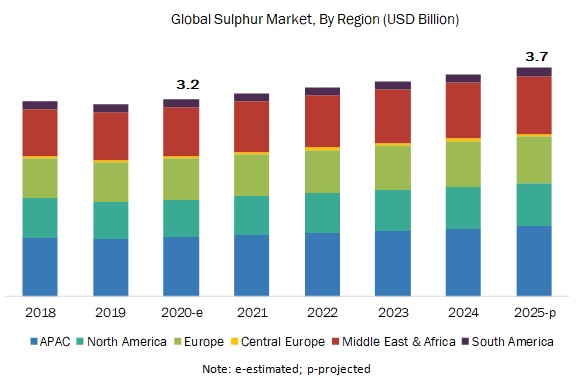
APAC is largest and fastest-growing market for solid sulphur
APAC is projected to register the fastest growth during the forecast period. China is expected to be one of the major markets for solid sulphur. The growing demand from fertilizers and chemical processing applications is expected to drive the market in China during the forecast period.
Solid Sulphur Market Players
Abu Dhabi National Oil Company (UAE), Marathon Petroleum Corporation (US), Qatar Petroleum (Qatar), Gazprom (Russia), Saudi Aramco (Saudi Arabia), and Chemtrade Logistics (Canada) are the key players operating in the solid sulphur market.
These companies have adopted several growth strategies to strengthen their position in the market. Expansion and merger & acquisition are the key growth strategies adopted by these leading players to enhance their product offering and regional presence and meet the growing demand for solid sulphur in emerging economies.
Solid Sulphur Market Report Scope
|
Report Metric |
Details |
|
Market size available for years |
2018–2025 |
|
Base year |
2019 |
|
Forecast period |
2020–2025 |
|
Units considered |
Value (USD), Volume (Kiloton) |
|
Segments |
Manufacturing Process, Application, and Region |
|
Regions covered |
APAC, Europe, Central Europe, North America, Middle East & Africa, and South America |
|
Companies profiled |
Abu Dhabi National Oil Company (UAE), Marathon Petroleum Corporation (US), Qatar Petroleum (Qatar), Gazprom (Russia), and Saudi Aramco (Saudi Arabia) Total 25 major solid sulphur market players are covered. |
This research report categorizes the solid sulphur market based on manufacturing process, application, and region.
Solid Sulphur Market by Manufacturing Process:
- Frasch Process
- Claus Process
Solid Sulphur Market by Application:
Solid Sulphur Market by Region:
- APAC
- Europe
- Central Europe
- North America
- Middle East & Africa
- South America
Recent Developments
- In March 2020, ADNOC (Abu Dhabi) invested to increase its oil production capacity from 3 to 4 million barrels of oil per day by April 2020 to respond to the current market condition. This expansion will increase the sulphur production from oil refineries and serve the growing demand for sulphur in the Middle East & Africa, APAC, and Europe.
- In February 2020, ADNOC invested USD 1.65 billion in the construction of the Dalma Gas Development project in Dalma (Abu Dhabi), which will have a production capacity of 340 million standard cubic feet of natural gas per day. This increase in natural gas production will increase the production of sulphur, which will serve the domestic demand of sulphur.
- In April 2019, Marathon Petroleum Corporation (MPC) made a definitive purchase agreement with NOCO Incorporated (New York, US) to acquire 33 express NOCO retail stores and 900,000 barrels capacity light weight and asphalt terminal.
- In November 2019, QP will combine SEEF Limited’s (Doha, Qatar) operations with its refining operations by the end of 2020. With this acquisition, QP aims to strengthen its position in the downstream operations in the oil & gas industry in the Middle East & Africa region.
Critical questions the report answers:
- What are the upcoming hot bets for the solid sulphur market?
- What are the market dynamics for the different applications of solid sulphur?
- What are the market dynamics for different manufacturing processes of solid sulphur?
- Who are the major manufacturers of solid sulphur?
- What are the significant factors which will impact the market growth during the forecast period?
To speak to our analyst for a discussion on the above findings, click Speak to Analyst
 Exclusive indicates content/data unique to MarketsandMarkets and not available with any competitors.
TABLE OF CONTENTS
1 INTRODUCTION (Page No. - 18)
1.1 OBJECTIVES OF THE STUDY
1.2 MARKET DEFINITION
1.3 MARKET SCOPE
1.3.1 SOLID SULPHUR: MARKET SEGMENTATION
1.3.2 YEARS CONSIDERED FOR THE STUDY
1.4 CURRENCY
1.5 UNIT CONSIDERED
1.6 LIMITATIONS
1.7 STAKEHOLDERS
2 RESEARCH METHODOLOGY (Page No. - 22)
2.1 RESEARCH DATA
2.2 BASE NUMBER CALCULATION
2.2.1 SUPPLY SIDE APPROACH 1
2.2.2 SUPPLY SIDE APPROACH 2
2.3 MARKET SIZE ESTIMATION
2.3.1 MARKET SIZE ESTIMATION METHODOLOGY: BOTTOM-UP APPROACH
2.3.2 MARKET SIZE ESTIMATION METHODOLOGY: TOP-DOWN APPROACH
2.3.3 SECONDARY DATA
2.4 PRIMARY DATA
2.4.1.1 Key data from primary sources
2.4.1.2 Key industry insights
2.4.1.3 Breakdown of primary interviews
2.5 ASSUMPTIONS
2.6 LIMITATIONS
3 EXECUTIVE SUMMARY (Page No. - 31)
4 PREMIUM INSIGHTS (Page No. - 34)
4.1 ATTRACTIVE OPPORTUNITIES IN THE SOLID SULPHUR MARKET
4.2 SOLID SULPHUR MARKET GROWTH, BY MANUFACTURING PROCESS
4.3 SOLID SULPHUR MARKET, BY APPLICATION AND REGION
4.4 SOLID SULPHUR MARKET, BY APPLICATION
5 MARKET OVERVIEW (Page No. - 36)
5.1 INTRODUCTION
5.2 MARKET DYNAMICS
5.2.1 DRIVERS
5.2.1.1 Sustainable demand for sulphuric acid in various applications
5.2.1.2 High demand for sulphur in agriculture sector
5.2.2 RESTRAINTS
5.2.2.1 High cost of extraction of sulphur by mining process
5.2.3 OPPORTUNITIES
5.2.3.1 Increasing opportunities in APAC region
5.2.4 CHALLENGES
5.2.4.1 Difficulty in transportation of sulphur
5.3 INDUSTRY TRENDS
5.3.1 PORTER’S FIVE FORCES ANALYSIS
5.3.2 BARGAINING POWER OF SUPPLIERS
5.3.3 THREAT OF NEW ENTRANTS
5.3.4 THREAT OF SUBSTITUTES
5.3.5 BARGAINING POWER OF BUYERS
5.3.6 INTENSITY OF COMPETITIVE RIVALRY
6 SOLID SULPHUR MARKET: BY MANUFACTURING PROCESS (Page No. - 42)
6.1 INTRODUCTION
6.2 CLAUS PROCESS
6.2.1 CLAUS SULPHUR RECOVERY PROCESS RECOVERS 95-98% OF SULPHUR FROM OIL & GAS REFINING PROCESS
6.3 FRASCH PROCESS
6.3.1 SULPHUR EXTRACTED FROM UNDERGROUND DEPOSITS THROUGH FRASCH PROCESS CAN BE 99.8% PURE
6.4 OTHERS
7 SOLID SULPHUR MARKET: BY APPLICATION (Page No. - 49)
7.1 INTRODUCTION
7.2 FERTILIZER
7.2.1 MASSIVE DEMAND FOR FERTILIZER IN DEVELOPING COUNTRIES DRIVING USE OF SOLID SULPHUR
7.3 CHEMICAL PROCESSING
7.3.1 DEMAND FOR SULPHUR INCREASING IN VARIOUS CHEMICALS INDUSTRIES
7.4 METAL MANUFACTURING
7.4.1 GROWING DEMAND FOR CONSTRUCTION MATERIAL DRIVING THE SOLID SULPHUR MARKET IN METAL MANUFACTURING
7.5 RUBBER PROCESSING
7.5.1 INCREASING PRODUCTION OF RUBBER IN APAC TO BOOST THE MARKET
7.6 OTHERS
7.6.1 GROWTH IN PHARMA AND EXPLOSIVES INDUSTRIES TO BOOST THE DEMAND FOR SOLID SULPHUR IN THE OTHERS SEGMENT
8 SOLID SULPHUR MARKET: BY REGION (Page No. - 61)
8.1 INTRODUCTION
8.2 APAC
8.2.1 CHINA
8.2.1.1 Growing demand for fertilizer will boost the demand for solid sulphur in China
8.2.2 INDIA
8.2.2.1 Growth fertilizer, chemical processing, and metal manufacturing sectors driving consumption of solid sulphur
8.2.3 JAPAN
8.2.3.1 Growing agriculture sector fueling the solid sulphur market
8.2.4 SOUTH KOREA
8.2.4.1 Growing electronic and semiconductor industries in South Korea is expected to stimulate the demand for solid sulphur
8.2.5 REST OF APAC
8.2.5.1 Growth in agrochemicals will play a pivotal role in driving the demand for solid sulphur
8.3 NORTH AMERICA
8.3.1 US
8.3.1.1 Growing development in oil & gas refining industry is boosting the market
8.3.2 CANADA
8.3.2.1 Rising demand from chemical industry to stimulate the growth of the market
8.3.3 MEXICO
8.4 EUROPE
8.4.1 RUSSIA
8.4.1.1 Russia has largest crude oil and metal ores deposits in Europe
8.4.2 SPAIN
8.4.2.1 Spain is third-largest market for solid sulphur market in Europe
8.4.3 GERMANY
8.4.3.1 Germany-based major players shifting focus towards APAC countries
8.4.4 NETHERLANDS
8.4.4.1 Netherlands is home to 19 of the top 25 chemical companies
8.4.5 REST OF EUROPE
8.4.5.1 Rest of Europe holds second-largest share of the solid sulphur market in 2019
8.5 CENTRAL EUROPE
8.5.1 POLAND
8.5.1.1 Increasing demand for sulphuric acid in various industries driving the solid sulphur market
8.5.2 BULGARIA
8.5.2.1 Growth in chemical industry to boost the solid sulphur market
8.5.3 REST OF CENTRAL EUROPE
8.5.3.1 Fertilizer application drives the solid sulphur market in Rest of Central Europe
8.6 MIDDLE EAST & AFRICA
8.6.1 SAUDI ARABIA
8.6.1.1 PRESENCE OF NUMEROUS PETROLEUM REFINERIES FUELING THE MARKET GROWTH
8.6.2 QATAR
8.6.2.1 DEVELOPMENT OF LARGE GAS DEPOSITS IN THE NORTH FIELD OF THE COUNTRY HAS INCREASED SULPHUR PRODUCTION
8.6.3 UAE
8.6.3.1 EXPANSION OF TRADE AND INCREASING POPULATION BOOSTING THE MARKET IN THE COUNTRY
8.6.4 REST OF MIDDLE EAST & AFRICA
8.7 SOUTH AMERICA
8.7.1 BRAZIL
8.7.1.1 RISE IN GOVERNMENT SUPPORT AND TECHNOLOGICAL ADVANCEMENTS BOOSTING THE MARKET IN THE COUNTRY
8.7.2 CHILE
8.7.2.1 CONSUMPTION OF PHOSPHATE FERTILIZERS TO BOOST THE SOLID SULPHUR MARKET
8.7.3 PERU
8.7.3.1 GROWING PETROLEUM SECTOR BOOSTING THE MARKET FOR SOLID SULPHUR
8.7.4 REST OF SOUTH AMERICA
9 COMPETITIVE LANDSCAPE (Page No. - 116)
9.1 OVERVIEW
9.2 MARKET RANKING ANALYSIS
9.3 COMPETITIVE SCENARIO
9.3.1 EXPANSIONS
9.3.2 MERGER & ACQUISITIONS
9.3.3 AGREEMENTS & JOINT VENTURES
10 COMPANY PROFILES (Page No. - 123)
10.1 ABU DHABI NATIONAL OIL COMPANY (ADNOC)
10.1.1 BUSINESS OVERVIEW
10.1.2 PRODUCTS OFFERED
10.1.3 RECENT DEVELOPMENTS
10.1.4 SWOT ANALYSIS: ADNOC
10.1.5 WINNING IMPERATIVES
10.1.6 CURRENT FOCUS AND STRATEGIES
10.1.7 THREAT FROM COMPETITION
10.1.8 ADNOC’S RIGHT TO WIN
10.2 MARATHON PETROLEUM CORPORATION (MPC)
10.2.1 BUSINESS OVERVIEW
10.2.2 PRODUCTS OFFERED
10.2.3 RECENT DEVELOPMENTS
10.2.4 SWOT ANALYSIS
10.2.5 WINNING IMPERATIVES
10.2.6 CURRENT FOCUS AND STRATEGIES
10.2.7 THREAT FROM COMPETITION
10.2.8 MPC’S RIGHT TO WIN
10.3 QATAR PETROLEUM (QP)
10.3.1 BUSINESS OVERVIEW
10.3.2 PRODUCTS OFFERED
10.3.3 RECENT DEVELOPMENTS
10.3.4 SWOT ANALYSIS: QATAR PETROLEUM (QP)
10.3.5 WINNING IMPERATIVES
10.3.6 CURRENT FOCUS AND STRATEGIES
10.3.7 THREAT FROM COMPETITION
10.3.8 RIGHT TO WIN
10.4 GAZPROM
10.4.1 BUSINESS OVERVIEW
10.4.2 PRODUCTS OFFERED
10.4.3 RECENT DEVELOPMENTS
10.4.4 SWOT ANALYSIS: GAZPROM
10.4.5 WINNING IMPERATIVES
10.4.6 CURRENT FOCUS AND STRATEGIES
10.4.7 THREAT FROM COMPETITION
10.4.8 RIGHT TO WIN
10.5 SAUDI ARAMCO
10.5.1 BUSINESS OVERVIEW
10.5.2 SWOT ANALYSIS
10.5.3 WINNING IMPERATIVES
10.5.4 CURRENT FOCUS AND STRATEGIES
10.5.5 THREAT FROM COMPETITORS
10.5.6 RIGHT TO WIN
10.6 REPSOL
10.6.1 BUSINESS OVERVIEW
10.6.2 PRODUCTS OFFERED
10.6.3 RECENT DEVELOPMENTS
10.6.4 MNM VIEW
10.7 CHEMTRADE LOGISTICS INCOME FUND
10.7.1 BUSINESS OVERVIEW
10.7.2 PRODUCTS OFFERED
10.7.3 MNM VIEW
10.8 VALERO ENERGY CORPORATION
10.8.1 PRODUCTS OFFERED
10.8.2 RECENT DEVELOPMENTS
10.8.3 MNM VIEW
10.9 MOTIVA ENTERPRISES LLC.
10.9.1 BUSINESS OVERVIEW
10.9.2 PRODUCTS OFFERED
10.9.3 MNM VIEW
10.10 ENERSUL LIMITED PARTNERSHIP
10.10.1 BUSINESS OVERVIEW
10.10.2 PRODUCTS OFFERED
10.10.3 MNM VIEW
10.11 OTHER COMPANIES
10.11.1 GEORGIA GULF SULFUR CORPORATION
10.11.2 KUWAIT PETROLEUM CORPORATION (KPC)
10.11.3 PBF ENERGY
10.11.4 PETROBRAS
10.11.5 AGLOBIS
10.11.6 H.J. BAKER & BRO., LLC.
10.11.7 PHILLIPS 66 COMPANY
10.11.8 EXXON MOBIL CORP.
10.11.9 SUNCOR ENERGY.
11 APPENDIX (Page No. - 154)
11.1 DISCUSSION GUIDE
11.2 KNOWLEDGE STORE: MARKETSANDMARKETS’ SUBSCRIPTION PORTAL
11.3 AVAILABLE CUSTOMIZATIONS
11.4 RELATED REPORTS
11.5 AUTHOR DETAILS
LIST OF TABLES (110 Tables)
TABLE 1 SOLID SULPHUR MARKET SIZE, BY PROCESS, 2018—2025 (USD MILLION)
TABLE 2 SOLID SULPHUR MARKET SIZE, BY PROCESS, 2018—2025 (KILOTON)
TABLE 3 CLAUS PROCESS MARKET SIZE, BY REGION, 2018—2025 (USD MILLION)
TABLE 4 CLAUS PROCESS MARKET SIZE, BY REGION, 2018—2025 (KILOTON)
TABLE 5 FRASCH PROCESS MARKET SIZE, BY REGION, 2017—2024 (USD MILLION)
TABLE 6 FRASCH PROCESS MARKET SIZE, BY REGION, 2017—2024 (KILOTON)
TABLE 7 OTHER (PYRITES AND ORES) PROCESSES MARKET SIZE, BY REGION, 2018—2025 (USD MILLION)
TABLE 8 OTHER (PYRITES AND ORES) PROCESSES MARKET SIZE, BY REGION, 2018—2025 (KILOTON)
TABLE 9 SOLID SULPHUR MARKET SIZE, BY APPLICATION, 2018—2025 (KILOTON)
TABLE 10 SOLID SULPHUR MARKET SIZE, BY APPLICATION, 2018—2025 (USD MILLION)
TABLE 11 SOLID SULPHUR MARKET SIZE, BY APPLICATION, 2018—2025 (KILOTON)
TABLE 12 SOLID SULPHUR MARKET SIZE IN FERTILIZER, BY REGION, 2018—2025 (USD MILLION)
TABLE 13 SOLID SULPHUR MARKET SIZE IN FERTILIZER, BY REGION, 2018—2025 (KILOTON)
TABLE 14 SOLID SULPHUR MARKET SIZE IN CHEMICAL PROCESSING, BY REGION, 2018—2025 (USD MILLION)
TABLE 15 SOLID SULPHUR MARKET SIZE IN CHEMICAL PROCESSING, BY REGION, 2018—2025 (KILOTON)
TABLE 16 SOLID SULPHUR MARKET SIZE IN METAL MANUFACTURING, BY REGION, 2018—2025 (USD MILLION)
TABLE 17 SOLID SULPHUR MARKET SIZE IN METAL MANUFACTURING, BY REGION, 2018—2025 (KILOTON)
TABLE 18 SOLID SULPHUR MARKET SIZE IN RUBBER PROCESSING, BY REGION, 2018—2025 (USD MILLION)
TABLE 19 SOLID SULPHUR MARKET SIZE IN RUBBER PROCESSING, BY REGION, 2018—2025 (KILOTON)
TABLE 20 SOLID SULPHUR MARKET SIZE IN OTHER APPLICATIONS, BY REGION, 2018—2025 (USD MILLION)
TABLE 21 SOLID SULPHUR MARKET SIZE IN OTHER APPLICATIONS, BY REGION, 2018—2025 (KILOTON)
TABLE 22 SOLID SULPHUR MARKET SIZE, BY REGION, 2018–2025 (KILOTON)
TABLE 23 SOLID SULPHUR MARKET SIZE, BY REGION, 2017–2024 (USD MILLION)
TABLE 24 APAC: SOLID SULPHUR MARKET SIZE, BY COUNTRY, 2018–2025 (USD MILLION)
TABLE 25 APAC: SOLID SULPHUR MARKET SIZE, BY COUNTRY, 2018–2025 (KILOTON)
TABLE 26 APAC: SOLID SULPHUR MARKET SIZE, BY MANUFACTURING PROCESS, 2018–2025 (USD MILLION)
TABLE 27 APAC: SOLID SULPHUR MARKET SIZE, BY MANUFACTURING PROCESS, 2018–2025 (KILOTON)
TABLE 28 APAC: SOLID SULPHUR MARKET SIZE, BY APPLICATION, 2018–2025 USD MILLION)
TABLE 29 APAC: SOLID SULPHUR MARKET SIZE, BY APPLICATION, 2018–2025 (KILOTON)
TABLE 30 CHINA: SOLID SULPHUR MARKET SIZE, BY APPLICATION, 2018–2025 (USD MILLION)
TABLE 31 CHINA: SOLID SULPHUR MARKET SIZE, BY APPLICATION, 2018–2025 (KILOTON)
TABLE 32 INDIA: SOLID SULPHUR MARKET SIZE, BY APPLICATION, 2018–2025 (USD MILLION)
TABLE 33 INDIA: SOLID SULPHUR MARKET SIZE, BY APPLICATION, 2018–2025 (KILOTON)
TABLE 34 JAPAN: SOLID SULPHUR MARKET SIZE, BY APPLICATION, 2018–2025 (USD MILLION)
TABLE 35 JAPAN: SOLID SULPHUR MARKET SIZE, BY APPLICATION, 2018–2025 (KILOTON)
TABLE 36 SOUTH KOREA: SOLID SULPHUR MARKET SIZE, BY APPLICATION, 2018–2025 (USD MILLION)
TABLE 37 SOUTH KOREA: SOLID SULPHUR MARKET SIZE, BY APPLICATION, 2018–2025 (KILOTON)
TABLE 38 REST OF APAC: SOLID SULPHUR MARKET SIZE, BY APPLICATION, 2018–2025 (USD MILLION)
TABLE 39 REST OF APAC: SOLID SULPHUR MARKET SIZE, BY APPLICATION, 2018–2025 (KILOTON)
TABLE 40 NORTH AMERICA: SOLID SULPHUR MARKET SIZE, BY COUNTRY, 2018–2025 (USD MILLION)
TABLE 41 NORTH AMERICA: SOLID SULPHUR MARKET SIZE, BY COUNTRY, 2018–2025 (KILOTON)
TABLE 42 NORTH AMERICA: SOLID SULPHUR MARKET SIZE, BY MANUFACTURING PROCESS, 2018–2025 (USD MILLION)
TABLE 43 NORTH AMERICA: SOLID SULPHUR MARKET SIZE, BY MANUFACTURING PROCESS, 2018–2025 (KILOTON)
TABLE 44 NORTH AMERICA: SOLID SULPHUR MARKET SIZE, BY APPLICATION, 2018–2025 (USD MILLION)
TABLE 45 NORTH AMERICA: SOLID SULPHUR MARKET SIZE, BY APPLICATION, 2018–2025 (KILOTON)
TABLE 46 US: SOLID SULPHUR MARKET SIZE, BY APPLICATION, 2018–2025 (USD MILLION)
TABLE 47 US: SOLID SULPHUR MARKET SIZE, BY APPLICATION, 2018–2025 (KILOTON)
TABLE 48 CANADA: SOLID SULPHUR MARKET SIZE, BY APPLICATION, 2018–2025 (USD MILLION)
TABLE 49 CANADA: SOLID SULPHUR MARKET SIZE, BY APPLICATION, 2018–2025 (KILOTON)
TABLE 50 MEXICO: SOLID SULPHUR MARKET SIZE, BY APPLICATION, 2018–2025 (USD MILLION)
TABLE 51 MEXICO: SOLID SULPHUR MARKET SIZE, BY APPLICATION, 2018–2025 (KILOTON)
TABLE 52 EUROPE: SOLID SULPHUR MARKET SIZE, BY COUNTRY, 2018–2025 (USD MILLION)
TABLE 53 EUROPE: SOLID SULPHUR MARKET SIZE, BY COUNTRY, 2018–2025 (KILOTON)
TABLE 54 EUROPE: SOLID SULPHUR MARKET SIZE, BY MANUFACTURING PROCESS, 2018–2025, (USD MILLION)
TABLE 55 EUROPE: SOLID SULPHUR MARKET SIZE, BY MANUFACTURING PROCESS, 2018–2025, (KILOTON)
TABLE 56 EUROPE: SOLID SULPHUR MARKET SIZE, BY APPLICATION, 2018–2025, (USD MILLION)
TABLE 57 EUROPE: SOLID SULPHUR MARKET SIZE, BY APPLICATION, 2018–2025, (KILOTON)
TABLE 58 RUSSIA : SOLID SULPHUR MARKET SIZE, BY APPLICATION, 2018–2025 (USD MILLION)
TABLE 59 RUSSIA: SOLID SULPHUR MARKET SIZE, BY APPLICATION, 2018–2025 (KILOTON)
TABLE 60 SPAIN: SOLID SULPHUR MARKET SIZE, BY APPLICATION, 2018–2025 (USD MILLION)
TABLE 61 SPAIN: SOLID SULPHUR MARKET SIZE, BY APPLICATION, 2018–2025 KILOTON)
TABLE 62 GERMANY: SOLID SULPHUR MARKET SIZE, BY APPLICATION, 2018–2025 (USD MILLION)
TABLE 63 GERMANY: SOLID SULPHUR MARKET SIZE, BY APPLICATION, 2018–2025 (KILOTON)
TABLE 64 NETHERLANDS: SOLID SULPHUR MARKET SIZE, BY APPLICATION, 2018–2025 (USD MILLION)
TABLE 65 NETHERLANDS: SOLID SULPHUR MARKET SIZE, BY APPLICATION, 2018–2025 (KILOTON)
TABLE 66 REST OF EUROPE: SOLID SULPHUR MARKET SIZE, BY APPLICATION, 2018–2025 (USD MILLION)
TABLE 67 REST OF EUROPE: SOLID SULPHUR MARKET SIZE, BY APPLICATION, 2018–2025 (KILOTON)
TABLE 68 CENTRAL EUROPE: SOLID SULPHUR MARKET SIZE, BY COUNTRY, 2018–2025 (USD MILLION)
TABLE 69 CENTRAL EUROPE: SOLID SULPHUR MARKET SIZE, BY COUNTRY, 2018–2025 (KILOTON)
TABLE 70 CENTRAL EUROPE: SOLID SULPHUR MARKET SIZE, BY MANUFACRURING PROCESS, 2018–2025 (USD MILLION)
TABLE 71 CENTRAL EUROPE: SOLID SULPHUR MARKET SIZE, BY MANUFACTURING PROCESS, 2018–2025 (KILOTON)
TABLE 72 CENTRAL EUROPE: SOLID SULPHUR MARKET SIZE, BY APPLICATION, 2018–2025 (USD MILLION)
TABLE 73 CENTRAL EUROPE: SOLID SULPHUR MARKET SIZE, BY APPLICATION, 2018–2025 (KILOTON)
TABLE 74 POLAND: SOLID SULPHUR MARKET SIZE, BY APPLICATION, 2018–2025 (USD MILLION)
TABLE 75 POLAND: SOLID SULPHUR MARKET SIZE, BY APPLICATION, 2018–2025 (KILOTON)
TABLE 76 BULGARIA: SOLID SULPHUR MARKET SIZE, BY APPLICATION, 2018–2025 (USD MILLION)
TABLE 77 BULGARIA: SOLID SULPHUR MARKET SIZE, BY APPLICATION, 2018–2025 (KILOTON)
TABLE 78 REST OF CENTRAL EUROPE: SOLID SULPHUR MARKET SIZE, BY APPLICATION, 2018–2025 (USD MILLION)
TABLE 79 REST OF CENTRAL EUROPE: SOLID SULPHUR MARKET SIZE, BY APPLICATION, 2018–2025 (KILOTON)
TABLE 80 MIDDLE EAST & AFRICA: SOLID SULPHUR MARKET SIZE, BY COUNTRY, 2018–2025 (USD MILLION)
TABLE 81 MIDDLE EAST & AFRICA: SOLID SULPHUR MARKET SIZE, BY COUNTRY, 2018–2025 (KILOTON)
TABLE 82 MIDDLE EAST & AFRICA: SOLID SULPHUR MARKET SIZE, BY MANUFACTURING PROCESS, 2018–2025 (USD MILLION)
TABLE 83 MIDDLE EAST & AFRICA: SOLID SULPHUR MARKET SIZE, BY MANUFACTURING PROCESS, 2018–2025 (KILOTON)
TABLE 84 MIDDLE EAST & AFRICA: SOLID SULPHUR MARKET SIZE, BY APPLICATION, 2018–2025 (USD MILLION)
TABLE 85 MIDDLE EAST & AFRICA: SOLID SULPHUR MARKET SIZE, BY APPLICATION, 2018–2025 (KILOTON)
TABLE 86 SAUDI ARABIA: SOLID SULPHUR MARKET SIZE, BY APPLICATION, 2018–2026 (USD MILLION)
TABLE 87 SAUDI ARABIA: SOLID SULPHUR MARKET SIZE, BY APPLICATION, 2018–2026 (KILOTON)
TABLE 88 QATAR: SOLID SULPHUR MARKET SIZE, BY APPLICATION, 2018–2025 (USD MILLION)
TABLE 89 QATAR: SOLID SULPHUR MARKET SIZE, BY APPLICATION, 2018–2025 (KILOTON)
TABLE 90 UAE: SOLID SULPHUR MARKET SIZE, BY APPLICATION, 2018–2025 (USD MILLION)
TABLE 91 UAE: SOLID SULPHUR MARKET SIZE, BY APPLICATION, 2018–2025 (KILOTON)
TABLE 92 REST OF MIDDLE EAST & AFRICA: SOLID SULPHUR MARKET SIZE, BY APPLICATION, 2018–2025 (USD MILLION)
TABLE 93 REST OF MIDDLE EAST & AFRICA: SOLID SULPHUR MARKET SIZE, BY APPLICATION, 2018–2025 (KILOTON)
TABLE 94 SOUTH AMERICA: SOLID SULPHUR MARKET SIZE, BY COUNTRY, 2018–2025 (USD MILLION)
TABLE 95 SOUTH AMERICA: SOLID SULPHUR MARKET SIZE, BY COUNTRY, 2018–2025 (KILOTON)
TABLE 96 SOUTH AMERICA: SOLID SULPHUR MARKET SIZE, BY MANUFACTURING PROCESS, 2018–2025 (USD MILLION)
TABLE 97 SOUTH AMERICA: SOLID SULPHUR MARKET SIZE, BY MANUFACTURING PROCESS, 2018–2025 (KILOTON)
TABLE 98 SOUTH AMERICA: SOLID SULPHUR MARKET SIZE, BY APPLICATION, 2018–2025 (USD MILLION)
TABLE 99 SOUTH AMERICA: SOLID SULPHUR MARKET SIZE, BY APPLICATION, 2018–2025 (KILOTON)
TABLE 100 BRAZIL: SOLID SULPHUR MARKET SIZE, BY APPLICATION, 2018–2025 (USD MILLION)
TABLE 101 BRAZIL: SOLID SULPHUR MARKET SIZE, BY APPLICATION, 2018–2025 (KILOTON)
TABLE 102 CHILE: SOLID SULPHUR MARKET SIZE, BY APPLICATION, 2018–2025 (USD MILLION)
TABLE 103 CHILE: SOLID SULPHURMARKET SIZE, BY APPLICATION, 2018–2025 (KILOTON)
TABLE 104 PERU: SOLID SULPHUR MARKET SIZE, BY APPLICATION, 2018–2025 (USD MILLION)
TABLE 105 PERU: SOLID SULPHUR MARKET SIZE, BY APPLICATION, 2018–2025 (KILOTON)
TABLE 106 REST OF SOUTH AMERICA: SOLID SULPHUR MARKET SIZE, BY APPLICATION, 2018–2025 (USD MILLION)
TABLE 107 REST OF SOUTH AMERICA: SOLID SULPHUR MARKET SIZE, BY APPLICATION, 2018–2025 (KILOTON)
TABLE 108 EXPANSIONS, 2017-2020
TABLE 109 MERGER & ACQUISITIONS, 2017–2020
TABLE 110 AGREEMENTS & JOINT VENTURES, 2017–2020
LIST OF FIGURES (43 Figures)
FIGURE 1 FERTILIZER TO BE THE LARGEST END USER OF SOLID SULPHUR
FIGURE 2 CLAUS PROCESS IS LARGEST AND FASTEST-GROWING SEGMENT IN SOLID SULPHUR MARKET
FIGURE 3 APAC ACCOUNTED FOR THE LARGEST MARKET SHARE IN 2019
FIGURE 4 FERTILIZER APPLICATION TO DRIVE THE DEMAND FOR SOLID SULPHUR MARKET DURING FORECAST PERIOD
FIGURE 5 CLAUS PROCESS TO BE THE LARGEST PROCESS
FIGURE 6 APAC WAS THE LARGEST MARKET IN 2019
FIGURE 7 FERTILIZER TO BE THE LARGEST APPLICATION
FIGURE 8 FACTORS GOVERNING THE GLOBAL SOLID SULPHUR MARKET
FIGURE 9 SOLID SULPHUR MARKET: PORTER’S FIVE FORCES ANALYSIS
FIGURE 10 CLAUS PROCESS TO BE THE FASTEST-GROWING SEGMENT IN THE OVERALL MARKET
FIGURE 11 APAC TO BE THE FASTEST-GROWING MARKET FOR CLAUS PROCESS
FIGURE 12 APAC TO BE THE LARGEST MARKET FOR FRASCH PROCESS
FIGURE 13 APAC TO BE THE FASTEST-GROWING MARKET FOR OTHERS PROCESS
FIGURE 14 FERTILIZER TO BE THE LARGEST APPLICATION OF SOLID SULPHUR
FIGURE 15 APAC TO BE THE LARGEST MARKET FOR SOLID SULPHUR IN FERTILIZER APPLICATION
FIGURE 16 MIDDLE EAST & AFRICA TO BE THE LARGEST MARKET IN CHEMICAL PROCESSING APPLICATION
FIGURE 17 APAC TO BE LARGEST MARKET IN METAL MANUFACTURING APPLICATION
FIGURE 18 APAC TO BE THE FASTEST-GROWING MARKET FOR SOLID SULPHUR IN RUBBER PROCESSING
FIGURE 19 APAC TO BE THE FASTEST-GROWING MARKET IN OTHER APPLICATIONS SEGMENT
FIGURE 20 CHINA TO BE THE FASTEST-GROWING SOLID SULPHUR MARKET, GLOBALLY
FIGURE 21 APAC: SOLID SULPHUR MARKET SNAPSHOT
FIGURE 22 US IS LARGEST MARKET IN NORTH AMERICA
FIGURE 23 RUSSIA TO BE THE FASTEST-GROWING MARKET IN EUROPE, 2020–2025
FIGURE 24 CENTRAL EUROPE: SOLID SULPHUR MARKET SNAPSHOT
FIGURE 25 SAUDI ARABIA TO BE FASTEST-GROWING MARKET IN MIDDLE EAST & AFRICA
FIGURE 26 CHILE TO BE THE FASTEST-GROWING MARKET IN SOUTH AMERICA, 2020–2025
FIGURE 27 COMPANIES PRIMARILY ADOPTED EXPANSIONS AS THE KEY GROWTH STRATEGY BETWEEN 2017 AND 2020
FIGURE 28 SOLID SULPHUR MARKET, 2019
FIGURE 29 ABU DHABI NATIONAL OIL COMPANY: COMPANY SNAPSHOT
FIGURE 30 SWOT ANALYSIS: ADNOC
FIGURE 31 MARATHON PETROLEUM CORPORATION (MPC): COMPANY SNAPSHOT
FIGURE 32 SWOT ANALYSIS: MARATHON PETROLEUM CORPORATION (MPC)
FIGURE 33 QATAR PETROLEUM (QP): COMPANY SNAPSHOT
FIGURE 34 SWOT ANALYSIS: QATAR PETROLEUM (QP)
FIGURE 35 GAZPROM: COMPANY SNAPSHOT
FIGURE 36 SWOT ANALYSIS; GAZPROM
FIGURE 37 SAUDI ARAMCO: COMPANY SNAPSHOT
FIGURE 38 SWOT ANALYSIS: SAUDI ARAMCO.
FIGURE 39 REPSOL: COMPANY SNAPSHOT
FIGURE 40 CHEMTRADE LOGISTICS INCOME FUND: COMPANY SNAPSHOT
FIGURE 41 VALERO ENERGY CORPORATION: COMPANY SNAPSHOT
FIGURE 42 MOTIVA ENTERPRISES LLC: COMPANY SNAPSHOT
FIGURE 43 ENERSUL LIMITED PARTNERSHIP: COMPANY SNAPSHOT
The study involved four major activities in estimating the current market size for solid sulphur. Exhaustive secondary research was done to collect information on the market, peer market, and parent market. The next step was to validate these findings, assumptions, and sizing with industry experts across the value chain through primary research. Both top-down and bottom-up approaches were employed to estimate the total market size. After that, the market breakdown and data triangulation were used to estimate the market size of the various segments and sub-segments.
Secondary Research
As a part of the secondary research process, different sources were referred to for identifying and collecting information for this study. These secondary sources included annual reports, press releases, and investor presentations of companies; white papers; certified publications; and articles from recognized authors. Secondary research was mainly used to obtain key information about the supply chain of the industry, the monetary chain of the market, the total pool of key players, market classification & segmentation according to industry trends to the bottom-most level, regional markets, and key developments from both the market- and technology-related perspectives.
Primary Research
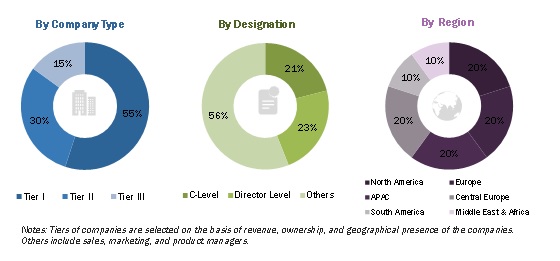
The solid sulphur market comprises several stakeholders in the supply chain, which include raw material suppliers, end-product manufacturers, compounders, molders, and end users. Various primary sources from the supply and demand sides of the solid sulphur market were interviewed to obtain qualitative and quantitative information. The primary sources from the demand side include key opinion leaders in various applications of the solid sulphur market. The primary sources from the supply side include industry experts such as Chief Executive Officers (CEOs), Vice Presidents (VPs), marketing directors, and related key executives from various leading companies and organizations operating in the solid sulphur market.
Following is the breakdown of primary respondents
To know about the assumptions considered for the study, download the pdf brochure
Market Size Estimation
The top-down and bottom-up approaches were used to estimate and validate the size of the solid sulphur market. These methods were also used extensively to estimate the size of the various sub-segments in the market. The research methodology used to estimate the market size includes the following:
- The key players in the industry and market were identified through extensive secondary research.
- The supply chain of the industry and the market size, in terms of volume and value, were determined through primary and secondary research.
- All percentage shares, splits, and breakdowns were determined using secondary sources and verified through primary sources.
- All possible parameters that affect the markets covered in this research study were accounted for, viewed in extensive detail, verified through primary research, and analyzed to obtain the final quantitative and qualitative data.
- The research included the study of reports, reviews, and newsletters of the key market players, along with extensive interviews of leaders, such as directors and marketing executives.
Data Triangulation
After arriving at the overall market size using the market size estimation processes as explained above, the market was split into several segments and sub-segments. To complete the whole market engineering process and arrive at the exact statistics of each market segment and sub-segment, the data triangulation, and market breakdown procedures were employed, wherever applicable. The data was triangulated by studying various factors and trends from both the demand and supply sides.
Objectives of the Study:
- To define, describe, and forecast the global solid sulphur market in terms of value and volume
- To identify and analyze the key growth drivers, restraints, opportunities, and challenges influencing the solid sulphur market
- To analyze and forecast the market on the basis of manufacturing process, application, and region
- To estimate and forecast the market on the basis of manufacturing process and application at country level in different regions, namely, Asia Pacific (APAC), North America, Europe, Central Europe, Middle East & Africa, and South America
- To analyze the recent developments and competitive strategies, such as expansions, new product launches/developments, agreements/joint ventures, and mergers & acquisitions, to draw the competitive landscape of the market
- To strategically identify and profile the key market players and analyze their core competencies
Available Customizations:
- MarketsandMarkets offers customizations according to the specific requirements of companies with the given market data.
- The following customization options are available for the report:
Regional Analysis:
- Country-level analysis of the solid sulphur market
Company Information:
- Detailed analysis and profiling of additional market players


Growth opportunities and latent adjacency in Solid Sulphur Market