
Industrial Rubber Market

Industrial Rubber Market by Application (Automotive, Building & Construction, Industrial Manufacturing, Polymer Modification, Wire & Cable, Electrical & Electronics), Type, Product, End-use Product Processing, and Region - Global Forecast to 2030


OVERVIEW
Source: Secondary Research, Interviews with Experts, MarketsandMarkets Analysis
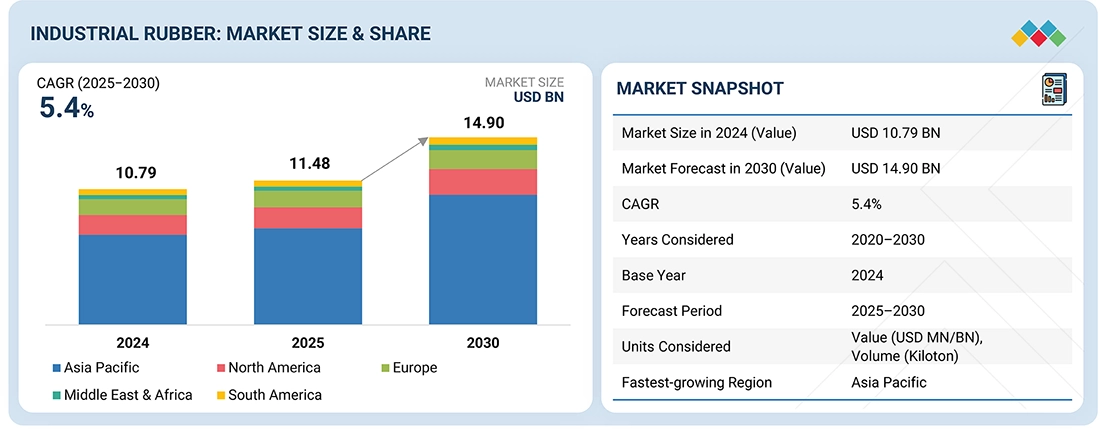
The global industrial rubber market is projected to grow from USD 11.48 billion in 2025 to USD 14.90 billion by 2030, at a CAGR of 5.4% during the forecast period. The industrial rubber market is witnessing steady growth globally, driven by rising demand across key sectors such as automotive, construction, and healthcare. The increasing adoption of electric vehicles, expansion of infrastructure projects, and advancements in medical technologies are fueling the need for high-performance synthetic and natural rubber components. Additionally, ongoing industrialization in emerging economies, along with a growing focus on sustainability and material innovation, is further supporting the market’s upward trajectory.
KEY TAKEAWAYS
-
BY PRODUCTMechanical rubber goods and rubber hoses are prominent segments of the industrial rubber markets. Seals, gaskets, hoses, weather strips, and other products under mechanical rubber goods have seen growing use in recent years. Rubber hoses are required in fluid and gas conveyance applications across the manufacturing, construction, and automotive sectors.
-
BY TYPENatural and synthetic rubber are widely used in varying applications. The high tensile strength, elasticity, and tear resistance of rubber make it an important component of conveyor belts and anti-vibration mounts. Synthetic rubbers, however, are highly popular as their properties can be tailored to specific applications where natural rubber may prove insufficient.
-
BY APPLICATIONThe automotive application segment will see strong, sustained demand over the coming years. As EV manufacturing ramps up alongside the current demand for vehicles, high-performance rubber components will see sustained growth. Other trends in automobile engineering, such as lower weight, greater efficiency, and vibration control, will also support the growth of this segment.
-
BY REGIONThe industrial rubber market covers Europe, North America, Asia Pacific, the Middle East & Africa, and South America. The wide range of applications, increasing demand for vehicles, rising infurastructural development, and regional economic growth are propelling the market for industrial rubber.
-
COMPETITIVE LANDSCAPEExxon Mobil Corporation (US), Dynasol Group (Spain), China Petrochemical Technology Development Co., Ltd. (China), Synthos (Poland), ARLANXEO (Netherlands), SIBUR International GmbH (Russia), Versalis S.p.A. (Italy), PetroChina Company Limited (China), TSRC (Taiwan), and ENEOS Materials Corporation (Japan) are the leading manufacturers of industrial rubber. They focus on expanding their geographic reach to cater to consumer demand. Besides expansions, companies adopted agreements, acquisitions, and other strategies to gain new projects, strengthen their product & service portfolios, and cater to untapped markets.
The industrial rubber market is experiencing steady growth, driven by the rising demand across key end-use sectors such as automotive, construction, healthcare, and industrial manufacturing. The shift toward electric vehicles, the expansion of infrastructure projects, and the increasing adoption of high-performance materials in medical and industrial applications are boosting the need for both synthetic and natural rubber. Additionally, advancements in rubber processing technologies, growing emphasis on sustainability, and strategic investments in emerging economies are further contributing to the expansion of the industrial rubber market.
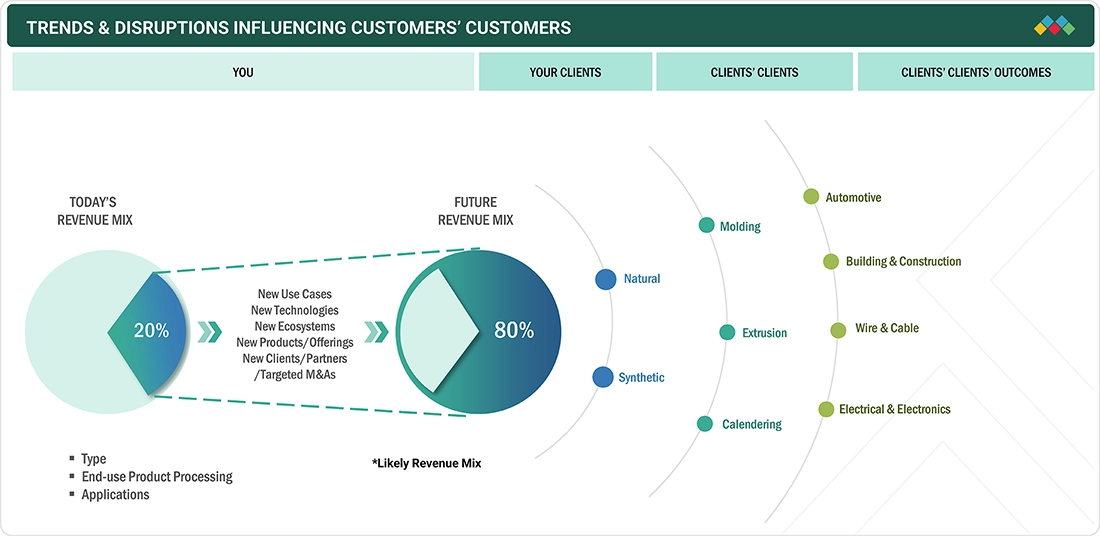
TRENDS & DISRUPTIONS IMPACTING CUSTOMERS' CUSTOMERS
The impact on consumers' business emerges from customer trends or disruptions. The industrial rubber market is growing rapidly as demand rises across automotive, construction, manufacturing, and electronics industries. Industrial rubber, both natural and synthetic, is essential for applications that require strength, flexibility, and resistance to wear, chemicals, and temperature extremes. With ongoing advances in material science, manufacturing technologies, and sustainability initiatives, the market is shifting toward high-performance and customized rubber products.
Source: Secondary Research, Interviews with Experts, MarketsandMarkets Analysis
MARKET DYNAMICS
Level
-
Rising demand from the automotive industry

-
Growth in construction and infrastructure development activities

Level
-
Environmental regulations and health hazards associated with industrial rubber

-
Availability of substitutes like thermoplastic elastomers

Level
-
Growing demand for eco-friendly rubber

Level
-
Raw material price volatility

Source: Secondary Research, Interviews with Experts, MarketsandMarkets Analysis
Driver: Rising demand from automotive industry
The automotive sector is a major consumer of industrial rubber, with demand rising as the global automotive industry expands, especially in developing countries. Rubber is crucial for producing automotive components like tires, hoses, belts, seals, gaskets, vibration insulators, and soundproofing. It enhances vehicle safety, performance, and comfort, serving both internal combustion engine vehicles and the growing electric vehicle market. The shift towards lightweight materials for better fuel efficiency has increased the use of synthetic rubbers and composites offering strength and flexibility at lower weights. As vehicles are built to last longer and endure heat, pressure, and chemicals, the need for high-quality rubber products grows. The automation and intelligence in automotive design also boost demand for precise, customized rubber parts.
Restraints: Availability of substitutes like thermoplastic elastomers
Substitutes like thermoplastic elastomers (TPEs) restrict the industrial rubber market growth. TPEs combine rubber-like elasticity with processing advantages of plastics, making them superior to traditional rubber. Unlike industrial rubber needing vulcanization, TPEs are easier and cheaper to produce and recycle through standard thermoplastic methods. Their resistance to weathering, UV, and chemicals makes TPEs suitable for harsh environments, leading to increased use in automotive, construction, medical, and electronics industries for products like seals, gaskets, and hoses. TPEs' lightweight and recyclability support sustainability and regulatory compliance. Advances improve their strength, flexibility, and durability, narrowing the gap with traditional rubber. Consequently, rising demand for sustainable, cost-effective TPEs is expected to limit industrial rubber market growth.
Opportunity: Growing demand for eco-friendly rubber
Growing environmental concerns boost demand for sustainable rubber, opening opportunities in the industrial market. Industries are shifting toward eco-friendly options aligned with regulations and consumer preferences. Awareness of pollution, emissions, and resource depletion is rising globally. Sectors like automotive, construction, consumer goods, and electronics are exploring alternatives to petroleum-based rubber. Sustainable options like natural, bio-based, or recycled rubber maintain performance standards such as flexibility and durability while being more eco-friendly. Manufacturers are investing in R&D to develop greener, commercially viable materials. Government incentives and regulations support this shift. Companies adopting sustainable rubber gain competitive advantages, improve their image, and access new eco-conscious markets. The sustainable rubber sector will drive environmental progress and market growth in the coming years.
Challenge: Raw material price volatility
The volatility in raw material prices poses a major challenge to growth in the industrial rubber sector, affecting both producers and consumers. Manufacturing involves combining various raw materials, like natural rubber, and synthetic variants, such as styrene-butadiene rubber (SBR), which originate from petroleum-based sources. These prices often vary sharply due to crude oil price shifts, changing demand, geopolitical tensions, supply chain issues, and the impact of climate change on natural rubber harvests. Such unpredictable price swings create confusion in production planning and cost forecasting, often leading to higher production costs and lower profits. In competitive sectors like automotive, construction, and consumer goods, inconsistent cost control can result in lost contracts and weakened market position. Small and medium enterprises are particularly vulnerable, lacking the financial buffer to handle sudden cost increases. As supply chain problems persist and reliance on government policies continues, this instability could hinder investment, disrupt supply chains, and restrict market growth. Therefore, raw material price fluctuations are likely to restrain the development of the industrial rubber industry during the forecast period.
Industrial Rubber Market: COMMERCIAL USE CASES ACROSS INDUSTRIES
| COMPANY | USE CASE DESCRIPTION | BENEFITS |
|---|---|---|
 |
Develops high-performance synthetic rubbers such as butyl, halobutyl, and EPDM for automotive, construction, and consumer goods applications. | Excellent air retention, superior weatherability, enhanced durability, and reduced rolling resistance for improved fuel efficiency. |
 |
Manufactures styrene-butadiene-styrene (SBS) and styrene-isoprene-styrene (SIS) block copolymers for adhesives, asphalt modification, and footwear. | Enhanced elasticity, superior adhesion, improved impact resistance, and extended product lifespan. |
 |
Produces high-grade synthetic rubbers including SBR, NBR, and BR for tire, sealant, and hose manufacturing. | Improved wear resistance, higher elasticity, and enhanced processability for industrial applications. |
 |
Develops synthetic rubbers such as emulsion SBR, Nd-BR, and high-performance polymers for tire and construction sectors. | Enhanced abrasion resistance, improved rolling efficiency, and sustainability through eco-friendly production technologies. |
 |
Manufactures a wide range of synthetic rubbers (EPDM, NBR, CR, HNBR) used in automotive, oil & gas, and industrial sealing systems. | Superior heat and chemical resistance, extended service life, and enhanced mechanical strength. |
Logos and trademarks shown above are the property of their respective owners. Their use here is for informational and illustrative purposes only.
MARKET ECOSYSTEM
The industrial rubber market ecosystem connects raw material suppliers (Shell, LyondellBasell, Ineos), manufacturers (PetroChina, ARLANXEO, Versalis), and end users (Sinopulse, LETONE, Flexon). Suppliers provide essential raw materials like latex, butadiene, styrene, and others, which manufacturers convert into natural and synthetic rubber products for various applications, including automotive, construction, wire and cable, and electronics. End users drive demand for higher durability, flexibility, and safety features in finished products. Strong collaboration within the value chain supports innovation, supply chain resilience, and sustainable market growth in industrial rubber.
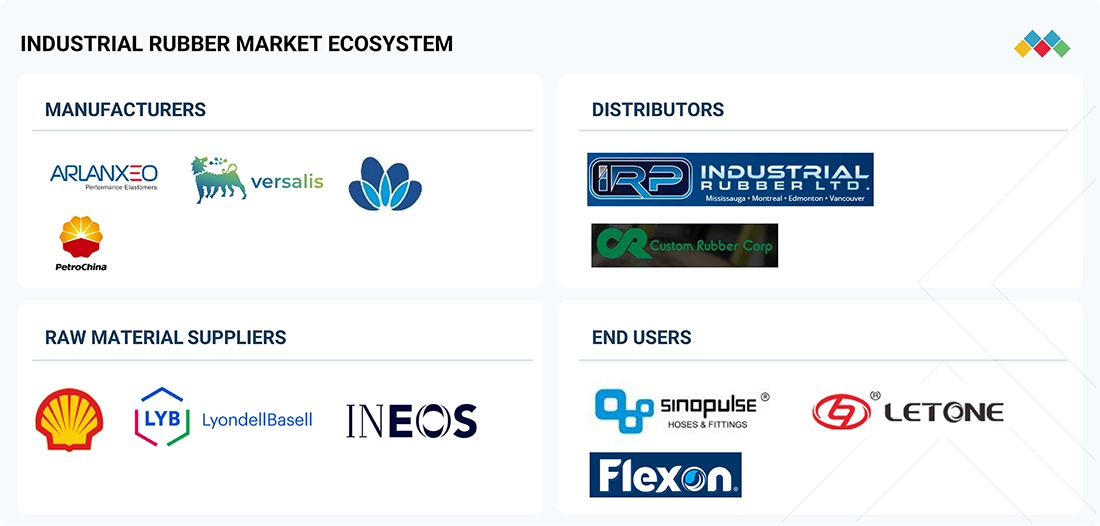
Logos and trademarks shown above are the property of their respective owners. Their use here is for informational and illustrative purposes only.
MARKET SEGMENTS
Source: Secondary Research, Interviews with Experts, MarketsandMarkets Analysis
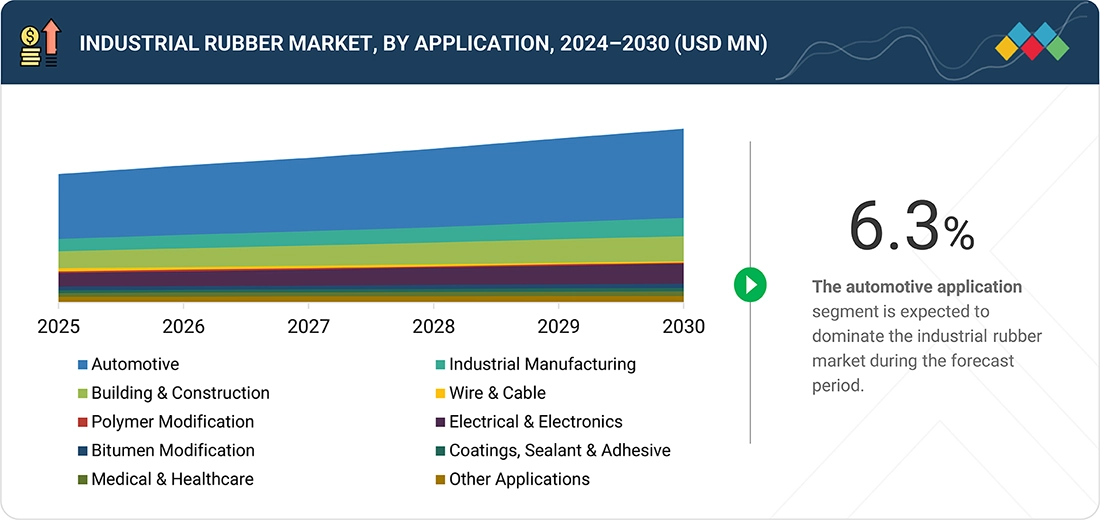
Industrial Rubber Market, By Application
The automotive segment is projected to have the highest CAGR in the industrial rubber industry during the forecast period due to increased vehicle production, product innovations, and demand for performance-enhancing components. The shift to electric and hybrid vehicles amplifies the need for durable, high-performance rubber parts that withstand fluctuations in temperatures, vibrations, and chemicals. Rising incomes and urbanization in countries like China and India boost car ownership, increasing demand for rubber components. Stricter emission standards in Europe push automakers to improve efficiency using advanced materials like synthetic rubber. Trends such as vehicle customization and aftermarket rubber products also drive industry demand, making the automotive segment a key growth area.
Industrial Rubber Market, By Product
The rubber hose segment is expected to lead the industrial rubber market in growth rate, driven by its extensive use across various end-use industries and the rising demand for flexible, durable fluid transfer systems. Rubber hoses play a crucial role in the automotive, construction, and industrial manufacturing sectors, where they transport fluids under different pressures and temperatures. The rapid growth in global vehicle production and consumer appetite for more efficient fuel delivery and cooling systems significantly propel the growth of rubber hoses. The building and construction industries require heavy-duty hoses for watering, material handling, and hydraulic applications. Advances in rubber compounding and hose design have also improved heat resistance, flexibility, and strength, boosting their longevity and performance.
REGION
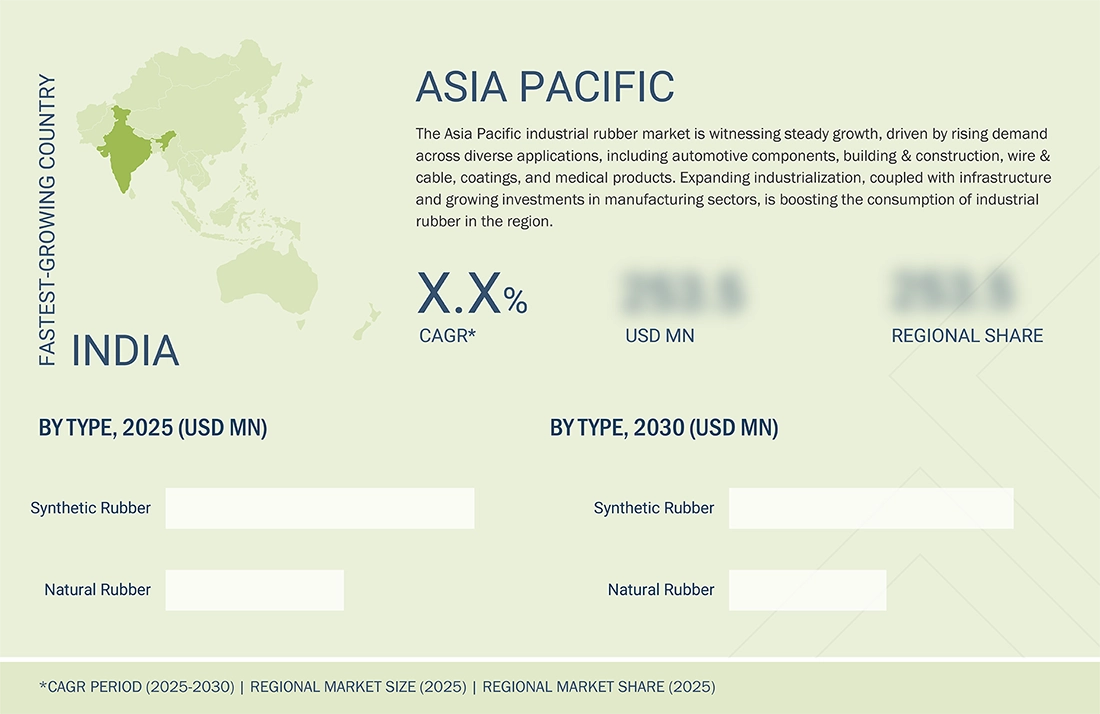
Asia Pacific is to be fastest-growing region in global industrial rubber market during forecast period
The Asia Pacific industrial rubber market is expected to register the highest CAGR during the forecast period. This growth is primarily attributed to rapid industrialization, urbanization, and infrastructure development in developing economies such as China, India, Indonesia, and Vietnam. Another key factor driving growth is the significant economic expansion occurring, particularly in the automotive, construction, electronics, and manufacturing sectors across the four leading consumers of industrial rubber.
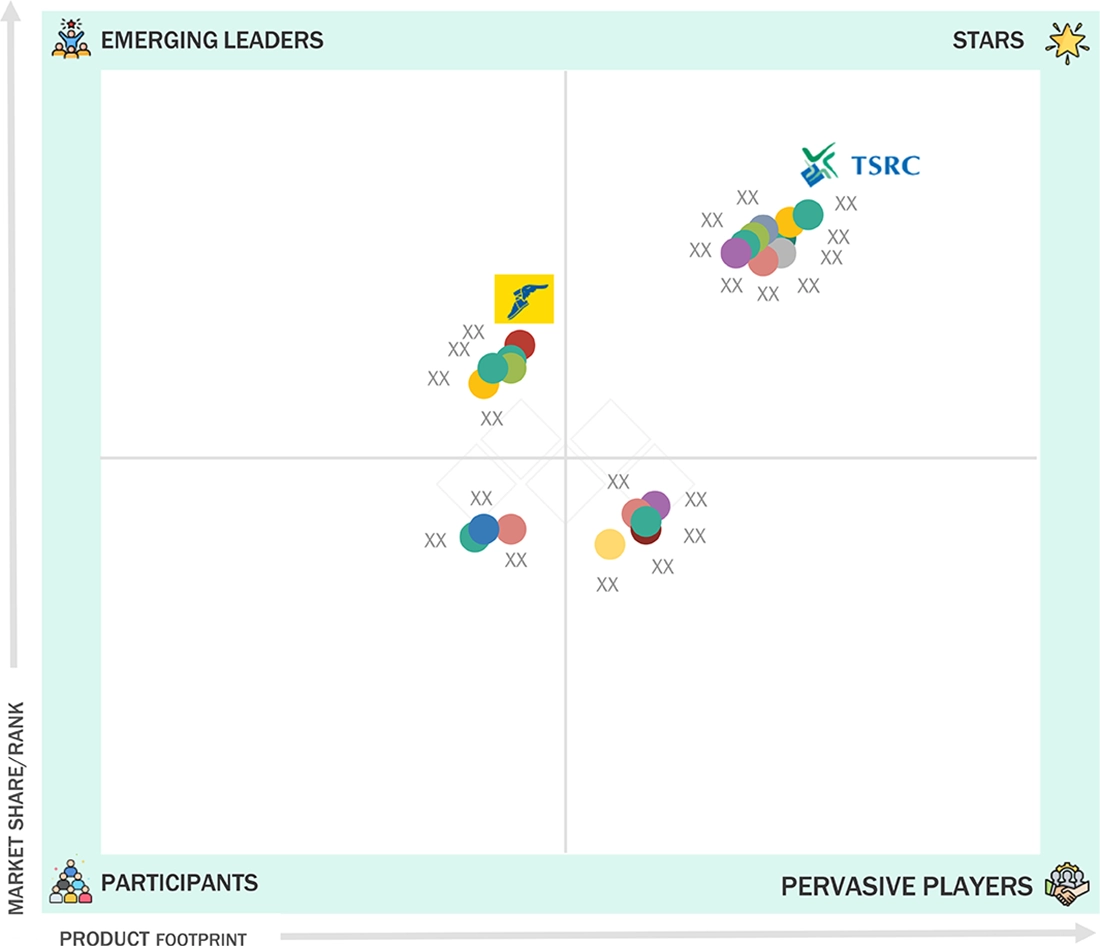
Industrial Rubber Market: COMPANY EVALUATION MATRIX
In the industrial rubber market matrix, TSRC stands out as a star performer, holding a leading market share with a broad and advanced product footprint. TSRC has made strategic choices, including adopting and implementing innovative processes and technologies to improve its production capabilities and increase competition. The Goodyear Tire & Rubber Company (Emerging Leader) is steadily increasing its visibility by expanding its product lines. Companies positioned as participants and pervasive players contribute to market dynamism with targeted offerings and specialized solutions, collectively driving growth and evolution within the industrial rubber value chain.
Source: Secondary Research, Interviews with Experts, MarketsandMarkets Analysis
KEY MARKET PLAYERS
MARKET SCOPE
| REPORT METRIC | DETAILS |
|---|---|
| Market Size in 2024 (Value) | USD 10.79 Billion |
| Market Forecast in 2030 (Value) | USD 14.90 Billion |
| Growth Rate | CAGR of 5.4% from 2025-2030 |
| Years Considered | 2020-2030 |
| Base Year | 2024 |
| Forecast Period | 2025-2030 |
| Units Considered | Value (USD Million/Billion), Volume (Kiloton) |
| Report Coverage | Revenue forecast, competitive landscape, growth factors, and trends |
| Segments Covered |
|
| Regions Covered | North America, Asia Pacific, Europe, the Middle East & Africa, and South America |
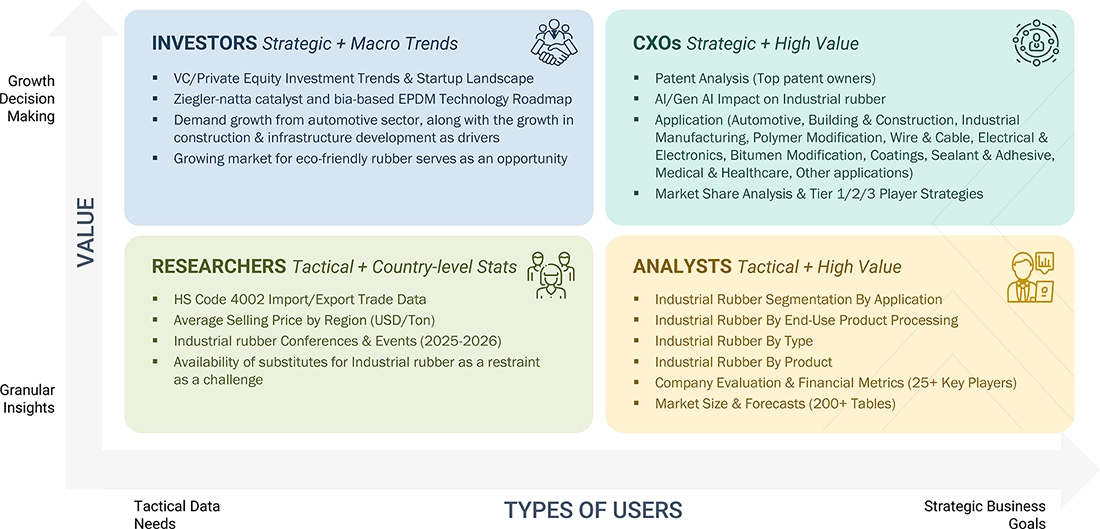
WHAT IS IN IT FOR YOU: Industrial Rubber Market REPORT CONTENT GUIDE
DELIVERED CUSTOMIZATIONS
We have successfully delivered the following deep-dive customizations:
| CLIENT REQUEST | CUSTOMIZATION DELIVERED | VALUE ADDS |
|---|---|---|
| Leading Tire Manufacturer |
|
|
| Industrial Rubber Product Manufacturer |
|
|
| Automotive OEM |
|
|
| Raw Material Supplier (Monomers, Fillers, Additives) |
|
|
| Construction Material Developer |
|
|
RECENT DEVELOPMENTS
- October 2023 : ARLANXEO announced the planned construction of a rubber production facility in Jubail, Saudi Arabia. This 140 kiloton-per-annum (ktpa) plant will produce two high-performance elastomers: Ultra-high-Cis Polybutadiene Rubber (NdBR) and Lithium Butadiene Rubber (LiBR). The facility will be integrated within the Amiral petrochemical complex, a joint venture between Aramco and TotalEnergies. Construction was slated for 2024, with operations expected to begin in 2027.
- September 2022 : Exxon Mobil Corporation expanded its portfolio of healthcare solutions to meet changing medical market needs for healthy, safe material options. The portfolio includes Achieve Advanced PP, ExxonMobil PP, Vistamaxx performance polymers, Exact polyolefin elastomers, ExxonMobil butyl polymers, Exxpro specialty elastomers, and ExxonMobil Isopropyl Alcohol (IPA). They are designed for various applications, including medical supplies (e.g., syringes, infusion bags), pharmaceutical packaging (e.g., bottles, vials), laboratory components, and infection protection products (e.g., face masks, gowns).
- May 2021 : Synthos announced an agreement with Trinseo, a global materials company and manufacturer of plastics, latex binders, and synthetic rubber, to acquire Trinseo’s synthetic rubber operations based in Schkopau, Germany. Taking over Trinseo’s Schkopau-based operations, including its manufacturing and research and development facilities (the “Synthetic Rubber Business”), allows Synthos to access new, higher-margin markets, expand its geographic footprint, and leverage significant synergies between the two businesses.
Table of Contents
 Exclusive indicates content/data unique to MarketsandMarkets and not available with any competitors.
Methodology
The research encompassed four primary actions in assessing the present market size of industrial rubber. Comprehensive secondary research was conducted to gather information on the market, the peer market, and the parent market. The subsequent stage involved corroborating these findings, assumptions, and dimensions with industry specialists throughout the industrial rubber value chain via primary research. The total market size is ascertained using both top-down and bottom-up methodologies. Subsequently, market segmentation analysis and data triangulation were employed to ascertain the dimensions of the market segments and subsegments.
Secondary Research
The research approach employed to assess and project the market begins with the collection of revenue data from prominent suppliers using secondary research. In the course of secondary research, many secondary sources, such as Hoovers, Bloomberg BusinessWeek, Factiva, the World Bank, and industry magazines, were utilized to identify and compile information for this study. The secondary sources comprised annual reports, press releases, and investor presentations from corporations, white papers, accredited periodicals, writings by esteemed authors, announcements from regulatory agencies, trade directories, and databases. Vendor offerings have been considered to ascertain market segmentation.
Primary Research
The industrial rubber market comprises several stakeholders, such as manufacturers, suppliers, traders, associations, and regulatory organizations, in the supply chain. The demand side of this market is characterized by the development of various industries, including automotive, building & construction, industrial manufacturing, polymer modification, wire & cable, electrical & electronics, bitumen modification, coating, sealants & adhesives, and medical & healthcare. Advancements in technology characterize the supply side. Various primary sources from both the supply and demand sides of the market were interviewed to obtain qualitative and quantitative information. The following is the breakdown of the primary respondents.
The following is a breakdown of the primary respondents:

To know about the assumptions considered for the study, download the pdf brochure
Market Size Estimation
Both the top-down and bottom-up approaches were used to estimate and validate the total size of the industrial rubber market. These methods were also used extensively to determine the size of various subsegments in the market. The research methodology used to estimate the market size included the following:
- The key players were identified through extensive primary and secondary research.
- The value chain and market size of the industrial rubber market, in terms of value and volume, were determined through primary and secondary research.
- All percentage shares, splits, and breakdowns were determined using secondary sources and verified through primary sources.
- All possible parameters that affect the market covered in this research study were accounted for, viewed in extensive detail, verified through primary research, and analyzed to obtain the final quantitative and qualitative data.
- The research included the study of reports, reviews, and newsletters of top market players, along with extensive interviews for opinions from key leaders, such as CEOs, directors, and marketing executives.
Global Industrial Rubber Market Size: Bottom-up and Top-down Approach

Data Triangulation
After arriving at the overall market size using the market size estimation processes as explained above, the market was split into several segments and subsegments. To complete the overall market engineering process and arrive at the exact statistics of each market segment and subsegment, data triangulation and market breakdown procedures were employed, wherever applicable. The market size was calculated globally by summing up the country-level and regional-level data.
Market Definition
Industrial rubber refers to natural or synthetic elastomers that exhibit elastic deformation under stress and return to their original shape once the stress is removed. These materials are valued for their high durability, flexibility, and resistance to heat, chemicals, and abrasion. Industrial rubber plays a critical role in the automotive sector, where it is used in tires, seals, gaskets, and vibration-dampening components. Beyond automotive, it finds wide application in building & construction, industrial manufacturing, polymer modification, wire & cable, electrical & electronics, bitumen modification, coating, sealant, & adhesive, medical & healthcare, and others. Its versatility and performance characteristics make it essential across a broad range of industrial uses.
Stakeholders
- Industrial Rubber Manufacturers
- Industrial Rubber Suppliers
- Industrial Rubber Traders, Distributors, and Suppliers
- Investment Banks and Private Equity Firms
- Raw Material Suppliers
- Government and Research Organizations
- Consulting Companies/Consultants in the Chemicals and Materials Sectors
- Industry Associations
- Contract Manufacturing Organizations (CMOs)
- NGOs, Governments, Investment Banks, Venture Capitalists, and Private Equity Firms
Report Objectives
- To define, describe, and forecast the size of the global industrial rubber market in terms of volume and value
- To provide detailed information regarding the key factors, such as drivers, restraints, opportunities, and challenges, influencing the growth of the global industrial rubber market
- To analyze and forecast the size of various segments of the industrial rubber market based on five major regions—North America, Asia Pacific, Europe, South America, and the Middle East & Africa, along with key countries in each of these regions
- To analyze recent developments and competitive strategies, such as product launches, acquisitions, agreements, and expansions, to draw the competitive landscape of the market
- To strategically profile the key players in the market and comprehensively analyze their core competencies
Key Questions Addressed by the Report
What is the critical driver for the industrial rubber market?
The growth of the industrial rubber market can be attributed to the rising demand from the automotive industry.
Which region is expected to register the highest CAGR in the industrial rubber market during the forecast period?
The industrial rubber market in the Asia Pacific is estimated to register the highest CAGR during the forecast period.
What is the primary application of industrial rubber?
Automotive is the major application for industrial rubber.
Who are the major players in the industrial rubber market?
The key players include Exxon Mobil Corporation (US), Dynasol Group (Spain), Synthos (Poland), ARLANXEO (Netherlands), and SIBUR (Russia).
What is expected to be the CAGR of the industrial rubber market from 2025 to 2030?
The market is expected to record a CAGR of 5.4% from 2025 to 2030.
Need a Tailored Report?
Customize this report to your needs
Get 10% FREE Customization
Customize This ReportPersonalize This Research
- Triangulate with your Own Data
- Get Data as per your Format and Definition
- Gain a Deeper Dive on a Specific Application, Geography, Customer or Competitor
- Any level of Personalization
Let Us Help You
- What are the Known and Unknown Adjacencies Impacting the Industrial Rubber Market
- What will your New Revenue Sources be?
- Who will be your Top Customer; what will make them switch?
- Defend your Market Share or Win Competitors
- Get a Scorecard for Target Partners

Custom Market Research Services
We Will Customise The Research For You, In Case The Report Listed Above Does Not Meet With Your Requirements
Get 10% Free CustomisationTESTIMONIALS

We at Nissan Chemicals Corporation have been clients of MarketsandMarkets for more than a year now. We recently consulted MarketsandMarkets for a study, the team at MarketsandMarkets was extremely professional and organized. The business insights were very detailed and aligned well with our expectations that really helped us formulate the Business Plans and device new strategies for development themes. MarketsandMarkets offers a unique combination of expertise and dedicated engagement model. Their research findings have helped us in designing our Pricing Strategy which will make it easier for us to predict the future sales and profits for the next ten years. We look forward to working with MarketsandMarkets in the future.
VP of Strategy & New Business Development
Leading Specialty Chemical Company
The MarketsandMarkets Engagement Model, composed of both the Knowledge Store and advisory custom research, has greatly helped us in understanding our markets and making strategic decisions. The Knowledge Store is a fast way to allow everyone in our organization to understand more about most any market they are interested in. The ability to then get custom research done and get answers to specific strategic questions and market insight has been spectacular. The Markets and Markets team feel more like colleagues than vendors and their services have helped us change our culture where statements of things like growth opportunities and competitive position are always backed by industry research.

Rich Gibson,
Director, Corporate Strategy
Milliken & Company,
Leading Industrial Manufacturer of specialty chemical, floor covering, performance and protective textile materials, and healthcaremilliken.com
MarketsandMarkets is a trusted resource that helps us to better understand markets that are near-adjacencies-whether its technology, value chain or geography. Their Knowledge Store platform provides a dashboard of markets and their characteristics which is easy to use and saves us time.
Adam Shaw,
Market Development and Strategy Manager
AdvanSix Inc. USA,
An American Leader in Chemicalswww.advansix.com
The Knowledge Store from MarketsandMarkets is a valuable tool which has helped my team acquire greater insight in to the end markets that our business serves. This has enabled us to help our company build stronger strategies throughout our planning process.
TOSHIO KINOSHITA
Senior Chif Consultion Research & Consulting Division
Mitsubishi Chemical Research Corporation,
Leading Manufacturer of Chemical Productswww.mitsubishichem-res.co.jp/en/

We recently engaged with MarketsandMarkets for a study, the team not only clearly understood our business objectives but was also extremely professional in the way they handled the entire project. The study was efficiently conducted in a phase-wise manner, and the engagement model furnished us with high-quality business insights that far exceeded our expectations at each phase. We were especially happy that MarketsandMarkets could provide us with both, an English as well as a Japanese version of the study. A special thanks to the Analyst Team and Client Services Team, whose fluency in Japanese enhanced our comfort level, as we could converse with them in our preferred language.
Independent entrepreneurs
Arrow Precision
We approached MarketsandMarkets for study on Proppants Market, and their work exceeded our expectations. The study conducted was comprehensive and enabled us to view the market through the various dimensions. In addition, the team was extraordinarily responsive throughout the process and resolved our queries on time. I strongly recommend MarketsandMarkets and will certainly consider them for additional market assessments we will need in the future.
Global engineering company, Japan
Deputy Manager,
Strategic Planning OfficeThe high-quality insights shared by the MarketsandMarkets team helped us understand the pharmaceutical plant designers in a specific geography. It also captured the risks that we may likely face in communicating with our potential partners. The study would enable us identify partners, which would impact our future growth.


Growth opportunities and latent adjacency in Industrial Rubber Market