Stevia Market by Extract Type (Whole Leaf, Powdered, Liquid), Application (Dairy, Bakery & Confectionery, Tabletop Sweeteners, Beverages, Convenience Foods), Form (Dry, Liquid), and Region - Global Forecasts to 2022


The stevia market is estimated to be valued at USD 490.1 Million in 2017 and is projected to grow at CAGR of 9.5% from 2017, to reach a value of USD 771.5 Million by 2022.
The years considered for the study are as follows:
|
Report Metric |
Details |
|
Base year |
2016 |
|
Estimated year |
2017 |
|
Projected year |
2022 |
|
Forecast period |
2017-2022 |
To know about the assumptions considered for the study, download the PDF brochure
The objectives of the report are as follows:
- To define, segment, and measure the stevia market with respect to extract type, application, form, and region
- To provide detailed information regarding the crucial factors influencing the growth of the market (drivers, restraints, opportunities, and industry-specific challenges)
- To project the size of the market, in terms of value (USD million), in the key regions, namely, North America, Europe, Asia Pacific, South America, and the Rest of the World (RoW)
- To analyze opportunities in the market for stakeholders and study the details of the competitive landscape, to be provided to the key market leaders
- To strategically profile the key players and comprehensively analyze their market share and core competencies
- To analyze the competitive developments such as new product launches, acquisitions, investments, expansions, partnerships, agreements, joint ventures, and collaborations in the market
Research Methodology:
- Major regions were identified along with countries contributing to maximum share.
- Secondary research was conducted to obtain the value of the global stevia market for regions such as North America, Europe, Asia Pacific, South America, and RoW.
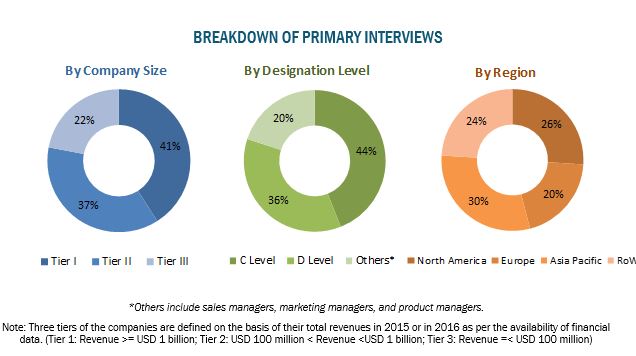
- Key players have been identified through secondary sources, such as the Bloomberg Businessweek, Factiva, and companies’ annual reports, while their market share in the respective regions has been determined through both, primary and secondary research.
- The research methodology includes the study of annual and financial reports of top market players as well as interviews with industry experts (such as CEOs, VPs, directors, and marketing executives) for key insights (both quantitative and qualitative) for the global market.
The key players profiled in this report include Cargill (US), Ingredion Incorporated (US), Tate & Lyle Plc (UK), PureCircle Ltd (Malaysia), GLG Life Tech Corporation (Canada), Wild Flavors and Specialty Ingredients (Germany), Sunwin Stevia International, Inc. (China), S&W Seed Co (US), Pyure Brands LLC (US), Morita Kagakau Kogyo Co., Ltd. (Japan), Zhucheng Haotinan, Pharm Co., Ltd (China), and Evolva Holdings SA (Switzerland).
Target Audience:
- Stevia manufacturers
- Other food ingredient manufacturers
- Stevia associations and industry bodies
- Raw material distributors and suppliers
- Government and research organizations
- Legislative and regulatory bodies
- Food commodity exporters
This report provides both qualitative and quantitative analyses of the stevia market, the competitive landscape, and the preferred development strategies of key players. The key players preferred new product developments & launches and partnerships & agreements as strategies to gain a larger share in the market. The report also analyzes the market dynamics and market share of leading players.
Scope of the Report
Based on Extract Type, the stevia market is segmented as follows:
- Whole leaf
- Powdered
- Liquid
Based on Application, the stevia market is segmented as follows:
- Dairy
- Bakery & confectionery
- Tabletop sweeteners
- Beverages
- Convenience foods
- Others
Based on Form, the market is segmented as follows:
- Dry
- Liquid
Based on Region, the stevia market is segmented as follows:
- North America
- Europe
- Asia-Pacific
- Rest of the World (RoW)
Available Customizations
With the given market data, MarketsandMarkets offers customizations according to the company’s specific needs.
The following customization options are available for the report:
Product Analysis
- Product matrix, which gives a detailed comparison of the product portfolio of each company
Geographic Analysis
- Further breakdown of the Rest of Europe stevia market into UK Austria, Poland, and the Scandinavian region
- Further breakdown of the Rest of Asia Pacific market into Thailand, Vietnam, and South Korea
- Further breakdown of the Rest of South America market into Peru, Chile, and Colombia
Company Information
- Detailed analysis and profiling of additional market players (Up to five)
Increase in consumer demand for natural sugar substitutes to stimulate the demand for stevia to cross the mark of USD 771.5 million by 2022
Stevia is a plant native to South America whose leaf extracts are naturally sweet and are used to sweeten food & beverages. Commercially, stevia is a white powder composed of one or more intensely sweet glycosides derived from the leaves of stevia; it finds usage as a non-caloric sweetener. Stevia has its unique taste profile and sweetness intensity, which is approximately 200 to 350 times greater than regular sugar. Many food & beverage companies use stevia as a natural sweetener to create products with enhanced taste and fewer total calories.
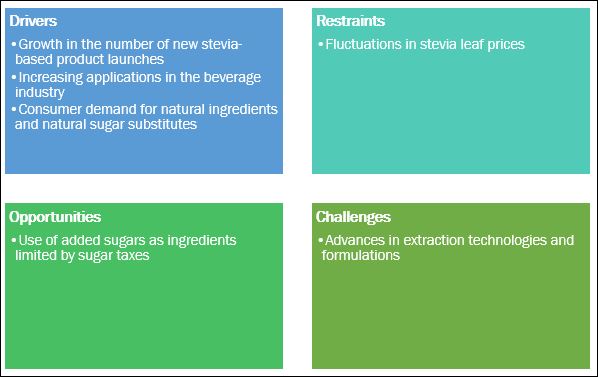
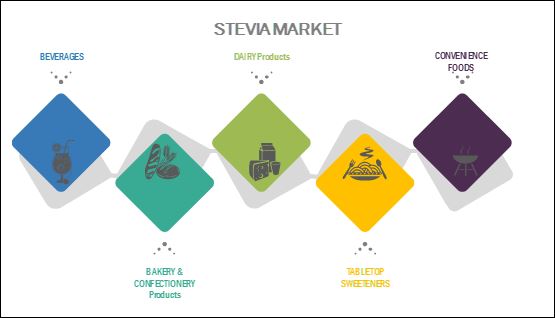
The global stevia market size is projected to reach USD 771.5 million by 2022, largely owing to its use as a sugar substitute in various applications such as dairy products, bakery & confectionery products, tabletop sweeteners, beverages, and convenience foods. Stevia is an attractive alternative to sugar and a clean label ingredient because it adds virtually no calories to the food or beverage product it is incorporated in. The major factor attributed to the growth of the market is the increasing number of product launches and innovations in the food & beverage industry, coupled with the need to serve the demand for sugar alternatives from consumers suffering from diabetes and obesity.
Fluctuation in stevia leaf prices acts as the major restraint for the market
The price volatility of the stevia leaf acts as a major restraining factor for the growth of the stevia industry. Stevia leaf availability depends on seasonal fluctuations and crop yield. According to the Global Stevia Institute, China is currently the leading producer and major exporter of stevia around the world. GLG Life Tech (one of the key players) estimates that the amount of stevia plant grown in China has decreased significantly. The fall in stevia cultivation is expected to impact the growing demand for stevia, which will result in a supply crunch and lead to higher prices during the forecast period.
Stevia is an emerging crop in many countries with a wide range of varieties, which also vary widely in their wholesale and retail prices. In general, stevia is more expensive than artificial sweeteners such as saccharin, aspartame, and sucralose. According to the African Export Association, international prices for refined stevia (at least 97% steviol glycoside by weight) range from USD 100 per kg to USD 150 per kg (2.2 lbs.), while dried stevia leaves range from USD 2.00 per kg to USD 4.00 per kg. Hence, fluctuations in price and availability pose difficulty in production planning and sourcing for processors and the food & beverage industry.
For more details on this research, Request Sample of the Report
One of the major challenges for stevia extract manufacturers is the taste offering. Traditional sugar continues to have preference over sugar substitutes such as stevia in terms of taste profile. Initially, the product offerings were made with highly purified rebaudioside A (one of the steviol glycosides present in stevia extract, which is responsible for its sweetness), which in some instances has a bitter aftertaste, which has limited its preference as an alternative to sugar. However, advanced farming methods, conventional plan breeding programs, advancement in extraction technologies & methods, and optimizing solutions for new food & beverage applications have resulted in newer and better-tasting stevia extract sweeteners with no bitter aftertaste. These advanced methods make the extraction of such stevia varieties more expensive. Hence, with more efficient methods, stevia extracts with more acceptable taste profiles will gain greater market presence. With its calorific benefits, this advancement presents a high potential for stevia in the sugar substitutes market.
Market Dynamics
Growing concerns with regard to sugar, high-fructose corn syrup, and aspartame have shifted the manufacturer’s focus to the usage of stevia for food & beverage applications
Dairy: Stevia is used as an alternative for sucrose
The dairy industry has been strongly influenced by the advantages of using stevia. In an effort to reduce childhood obesity and boost milk sales, the International Dairy Association (IDEA) and the National Milk Producers Federation (NMPF) petitioned the FDA to change the definition of “milk” and 17 other dairy products, including sour cream and yogurt. This change would allow the dairy industry to add aspartame and other sweeteners such as stevia to products without including prominent labels for consumers.
Bakery & confectionery products: Stevia has numerous benefits in confectionery products due to its physical and chemical properties
The most commonly used sweeteners, sucrose, dextrose (glucose), and corn syrups are fundamental in the production of confectionery items such as hard candy, caramel, taffy, chewing gum, chocolate, and gummed candies. In addition to their function in these items, they are widely used due to their low cost, availability, and ease of use during processing. The formulations of many sweetened confections are centered on the properties of stevia. Depending on the confection, stevia helps provide sweetness, improved mouthfeel, crystallization, texture, form, extended shelf life, flavor, and color to the final product.
Tabletop sweeteners: Acts as a natural sweetener and low-calorie alternative to sugar and other artificial sweeteners
Stevia is used as a substitute for sugar to add natural sweetness to hot or cold beverages, to be sprinkled on fruits, or for use in several cooking and baking recipes. Stevia, as a tabletop sweetener, is a source of sweetness 200–300 times sweeter than sugar and is suitable for diabetics and people suffering from phenylketonuria. Natuvia by PureCircle, SteviaFirst Corp, and Truvia are some of the commonly known brands of stevia as a tabletop sweetener.
Beverages: Imparts health benefits to zero- or low-calorie beverages
Alternative sweeteners such as stevia are essential as they provide and expand beverage choices to control caloric, carbohydrate, or specific sugar intake. In case of beverages, stevia is the most preferred option as the bulking properties provided by sugar are not required. Stevia is one of the most common natural sweeteners used for zero- or low-calorie beverages. It is mostly used in beverages such as diet carbonated drinks, flavored water, soft drinks, fruit juices, ready-to-drink beverages, and sports & energy drinks.
Convenience foods: Enhances the properties of food products
Stability, texture, sweetness, and mouthfeel of convenience food are essential factors that appeal to consumers. The other important factors that are essential to enhance the product appeal include shelf-stability, proper shape, color, taste, flavor, volume, and consistency. Stevia blends help to impart these properties to the food product without impacting its quality and its appeal to the consumers. Leading food ingredient manufacturers offer a broad range of stevia blends to meet these requirements.
Key Questions
- What are the upcoming technologies, substitutes, and trends that will have a significant impact on the stevia market in the future?
- Natural sweeteners and low-calorie sweeteners are getting traction in the market; how will this impact the food industry in the next five years?
- What will be the prominent revenue-generating pockets for the market in the next five years?
- Most suppliers have opted for new product developments as the key strategies as seen from the recent developments. Where will it take the industry in the mid to long term?
The market growth is driven by the increase in the customer demand for natural sugar alternatives, zero-calorie beverages, and healthier foods incorporating natural sugar substitutes. The market is also driven by factors such as the positive outlook for stevia as a natural sweetener and an increasing number of innovative product developments for stevia and stevia-based products that are cost-effective and find application in a wide range of food & beverage applications.
Stevia Market report categorizes the global market by extract type (whole leaf, powdered, and liquid), application (dairy, bakery & confectionery, tabletop sweeteners, beverages, and convenience foods), form (dry and liquid), and region.
Based on extract type, the whole leaf segment is projected to witness the fastest growth, at a CAGR of 11.1% from 2017. The demand for whole leaf stevia among food & beverage manufacturers and processors is driving the growth of the whole leaf stevia segment.
Based on the application, the beverages segment dominated the stevia market, in terms of value in 2016. In the beverages segment, stevia finds application in soft drinks, RTDs, carbonated drinks, juices, and energy drinks.
The global stevia market was dominated by the dry form of stevia, which includes purified or concentrated white powdered stevia and green herbal leaf powder.
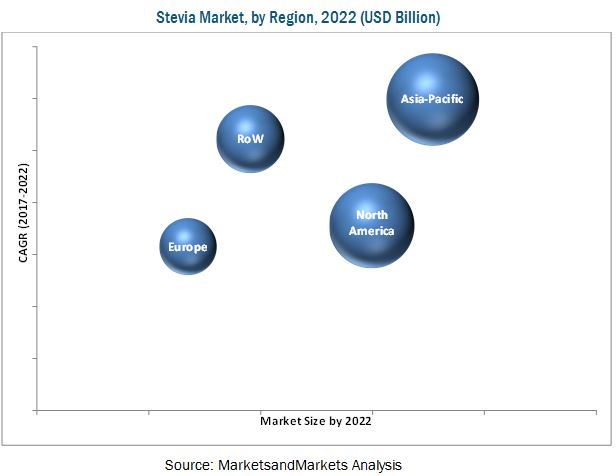
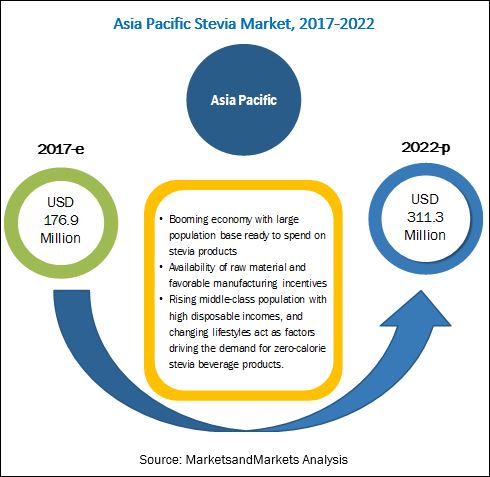
The Asia Pacific region accounted for the largest market share for stevia, followed by North America and RoW. With a population of more than 4.2 billion and rising income of consumers, stevia sweeteners are projected to witness an increase in the customer base in the Asia Pacific as it is an important segment of the sweeteners industry. The Asia-Pacific region is projected to be the fastest-growing market, with investments from several multinational manufacturers, particularly in countries such as Japan, China, and India.
The stevia market is fragmented and competitive, with a large number of players operating at regional and local levels. The key players in the market adopted strategies such as acquisitions & mergers, new product developments, and expansion & investments. Prominent players profiled in the report include Cargill (US), Ingredion Inc. (US), PureCircle Ltd. (Malaysia), and Tate & Lyle PLC (UK).
Frequently Asked Questions (FAQ):
Do you have data for 2018?
Why Sweet Green Field (SGF) is not mentioned in company profile section?
Can we customise this report with updated information for 2018-2019?
Does the report cover regulatory analysis for the countries in North America?
What does other applications include?
To speak to our analyst for a discussion on the above findings, please fill-up the required details by clicking on the Speak to Analyst
 Exclusive indicates content/data unique to MarketsandMarkets and not available with any competitors.
Table of Contents
1 Introduction (Page No. - 14)
1.1 Objectives of the Study
1.2 Stevia Market Definition
1.3 Study Scope
1.4 Periodization Considered for the Study
1.5 Currency Considered
1.6 Units
1.7 Stakeholders
2 Research Methodology (Page No. - 17)
2.1 Research Data
2.1.1 Secondary Data
2.1.1.1 Key Data From Secondary Sources
2.1.2 Primary Data
2.1.2.1 Key Data From Primary Sources
2.1.2.2 Breakdown of Primaries
2.2 Macro Indicators
2.2.1 Increasing Consumer Demand for Natural Sweeteners
2.3 Market Size Estimation
2.3.1 Bottom-Up Approach
2.3.2 Top-Down Approach
2.4 Market Breakdown & Data Triangulation
2.5 Research Assumptions
2.6 Limitations
3 Executive Summary (Page No. - 26)
4 Market Overview (Page No. - 33)
4.1 Introduction
4.2 Market Dynamics
4.2.1 Drivers
4.2.1.1 Growth in Number of New Stevia-Based Product Launches
4.2.1.2 Increase in Application in the Beverage Industry
4.2.1.3 Increase in Diseases and Other Health Concerns
4.2.1.4 Positive Regulatory Outlook
4.2.1.5 Consumer Demand for Natural Sugar Substitutes
4.2.2 Restraints
4.2.2.1 Fluctuation in Stevia Leaf Prices
4.2.3 Opportunities
4.2.3.1 Use of Added Sugars as an Ingredient Limited By Sugar Taxes
4.2.4 Challenges
4.2.4.1 Advances in Extraction Technologies and Formulations
4.3 Regulations
4.3.1 North America
4.3.1.1 U.S.
4.3.1.2 Canada
4.3.2 Europe
4.3.3 Asia-Pacific
5 Stevia Market, By Extract Type (Page No. - 44)
5.1 Introduction
5.2 Whole Leaf
5.3 Powdered
5.4 Liquid
6 Stevia Market, By Application (Page No. - 50)
6.1 Introduction
6.2 Dairy
6.3 Bakery & Confectionery
6.4 Tabletop Sweeteners
6.5 Beverages
6.6 Convenience Foods
6.7 Other Applications
7 Stevia Market, By Form (Page No. - 58)
7.1 Introduction
7.2 Dry
7.3 Liquid
8 Stevia Market, By Region (Page No. - 62)
8.1 Introduction
8.2 North America
8.2.1 U.S.
8.2.2 Canada
8.2.3 Mexico
8.3 Europe
8.3.1 Germany
8.3.2 U.K.
8.3.3 Italy
8.3.4 France
8.3.5 Rest of Europe
8.4 Asia-Pacific
8.4.1 Japan
8.4.2 China
8.4.3 India
8.4.4 Rest of Asia-Pacific
8.5 Rest of the World (RoW)
8.5.1 South America
8.5.2 Middle East & Africa
9 Competitive Landscape (Page No. - 87)
9.1 Introduction
9.2 Vendor Dive Analysis
9.2.1 Vanguards
9.2.2 Innovators
9.2.3 Dynamic
9.2.4 Emerging
9.3 Competitive Benchmarking
9.3.1 Products Offered (For All 24 Companies)
9.3.2 Business Strategy (For All 24 Companies)
*Top 24 Companies Analyzed for This Study are – Cargill (U.S.), Ingredion Incorporated (U.S.), Tate & Lyle PLC (U.K.), Purecircle Ltd (Malaysia), GLG Life Tech Corporation (Canada), Jining Aoxing Stevia Products Co., Ltd. (China), Archer Daniels Midland Company (U.S.), Sunwin Stevia Internaional Inc. (China), S&W Seed Company (U.S.), Sweet Green Fields LLC (U.S.), Purevia (U.S.), Biosweet Ventures (India), Pyure Brands LLC (U.S.), Stevia First Corporation (U.S.), Stevia Biotech Pvt. Ltd. (India), Jhanil Healthcare Pvt. Ltd. (India), Stevia Corp (U.S.), Van Wankum Ingrediens (The Netherlands), Stévial (France), Morita Kagaku Kogyo Co., Ltd. (Japan), Real Stevia Company (Sweden), Steviaone SA (Peru), Zhucheng Haotian Pharmaceutical Co., Ltd. (China), Evolva Basel (Switzerland)
10 Company Profiles (Page No. - 91)
(Business Overview, Products Offered & Services Strategies, Key Insights, Recent Developments, MnM View)*
10.1 Introduction
10.2 Cargill
10.3 Ingredion Incorporated
10.4 Tate & Lyle PLC
10.5 Purecircle Limited
10.6 GLG Life Tech Corporation
10.7 Archer Daniels Midland Company
10.8 Sunwin Stevia International, Inc.
10.9 S&W Seed Company
10.10 Pyure Brands LLC
10.11 Morita Kagakau Kogyo Co. Ltd.
10.12 Zhucheng Haotian Pharm Co. Ltd
10.13 Evolva Holding SA
*Details on Business Overview, Products Offered & Services Strategies, Key Insights, Recent Developments, MnM View Might Not Be Captured in Case of Unlisted Companies.
11 Appendix (Page No. - 132)
11.1 Discussion Guide
11.2 Knowledge Store: Marketsandmarkets’ Subscription Portal
11.3 Introducing RT: Real-Time Market Intelligence
11.4 Available Customizations
11.5 Related Reports
11.6 Author Details
List of Tables (62 Tables)
Table 1 Stevia Market Size, By Extract Type, 2015–2022 (USD Million)
Table 2 Stevia Market Size, By Extract Type, 2015–2022 (Tons)
Table 3 Stevia: Whole Leaf Extract Market Size, By Region, 2015–2022 (USD Million)
Table 4 Stevia: Whole Leaf Extract Market Size, By Region, 2015–2022 (Tons)
Table 5 Stevia: Powdered Extract Market Size, By Region, 2015–2022 (USD Million)
Table 6 Stevia: Powdered Extract Market Size, By Region, 2015–2022 (Tons)
Table 7 Stevia: Liquid Extract Market Size, By Region, 2015–2022 (USD Million)
Table 8 Stevia: Liquid Extract Market Size, By Region, 2015–2022 (Tons)
Table 9 Stevia Market Size, By Application, 2015–2022 (USD Million)
Table 10 Stevia Market Size, By Application, 2015–2022 (Tons)
Table 11 Stevia: Dairy Market Size, By Region, 2015–2022 (USD Million)
Table 12 Stevia: Dairy Market Size, By Region, 2015–2022 (Tons)
Table 13 Stevia: Bakery & Confectionery Market Size, By Region, 2015–2022 (USD Million)
Table 14 Stevia: Bakery & Confectionery Market Size, By Region, 2015–2022 (Tons)
Table 15 Stevia: Tabletop Sweeteners Market Size, By Region, 2015–2022 (USD Million)
Table 16 Stevia: Tabletop Sweeteners Market Size, By Region, 2015–2022 (Tons)
Table 17 Stevia: Beverages Market Size, By Region, 2015–2022 (USD Million)
Table 18 Stevia: Beverages Market Size, By Region, 2015–2022 (Tons)
Table 19 Stevia: Convenience Foods Market Size, By Region, 2015–2022 (USD Million)
Table 20 Stevia: Convenience Foods Market Size, By Region, 2015–2022 (Tons)
Table 21 Stevia: Other Applications Market Size, By Region, 2015–2022 (USD Million)
Table 22 Stevia: Other Applications Market Size, By Region, 2015–2022 (Tons)
Table 23 Stevia Market Size, By Form, 2015–2022 (USD Million)
Table 24 Market Size, By Form, 2015–2022 (Tons)
Table 25 Stevia: Dry Form Market Size, By Region, 2015–2022 (USD Million)
Table 26 Stevia: Dry Form Market Size, By Region, 2015–2022 (Tons)
Table 27 Stevia: Liquid Form Market Size, By Region, 2015–2022 (USD Million)
Table 28 Stevia: Liquid Form Market Size, By Region, 2015–2022 (Tons)
Table 29 Stevia: Market Size, By Region, 2015-2022 (USD Million)
Table 30 Stevia Market Size, By Region, 2015-2022 (Tons)
Table 31 North America: Stevia Market Size, By Country, 2015-2022 (USD Million)
Table 32 North America: Stevia Market Size, By Country, 2015-2022 (Tons)
Table 33 North America: Stevia Market Size, By Extract Type, 2015-2022 (USD Million)
Table 34 North America: Stevia Market Size, By Extract Type, 2015-2022 (Tons)
Table 35 North America: Stevia Market Size, By Form, 2015-2022 (USD Million)
Table 36 North America: Stevia Market Size, By Form, 2015-2022 (Tons)
Table 37 North America: Stevia Market Size, By Application, 2015-2022 (USD Million)
Table 38 North America: Stevia Market Size, By Application, 2015-2022 (Tons)
Table 39 Europe: Stevia Market Size, By Country, 2015–2022 (USD Million)
Table 40 Europe: Stevia Market Size, By Country, 2015–2022 (Tons)
Table 41 Europe: Stevia Market Size, By Extract Type, 2015–2022 (USD Million)
Table 42 Europe: Stevia Market Size, By Extract Type, 2015–2022 (Tons)
Table 43 Europe: Stevia Market Size, By Form, 2015–2022 (USD Million)
Table 44 Europe: Stevia Market Size, By Form, 2015–2022 (Tons)
Table 45 Europe: Stevia Market Size, By Application, 2015–2022 (USD Million)
Table 46 Europe: Stevia Market Size, By Application, 2015–2022 (Tons)
Table 47 Asia-Pacific: Stevia Market Size, By Country, 2015-2022 (USD Million)
Table 48 Asia-Pacific: Stevia Market Size, By Country, 2015-2022 (Tons)
Table 49 Asia-Pacific: Stevia Market Size, By Extract Type, 2015-2022 (USD Million)
Table 50 Asia-Pacific: Stevia Market Size, By Extract Type, 2015-2022 (Tons)
Table 51 Asia-Pacific: Stevia Market Size, By Form, 2015-2022 (USD Million)
Table 52 Asia-Pacific: Market Size, By Form, 2015-2022 (Tons)
Table 53 Asia-Pacific: Stevia Market Size, By Application, 2015-2022 (USD Million)
Table 54 Asia-Pacific: Stevia Market Size, By Application, 2015-2022 (Tons)
Table 55 RoW: Stevia Market Size, By Region, 2015–2022 (USD Million)
Table 56 RoW: Stevia Market Size, By Region, 2015–2022 (Tons)
Table 57 RoW: Stevia Market Size, By Extract Type, 2015–2022 (USD Million)
Table 58 RoW: Stevia Market Size, By Extract Type, 2015–2022 (Tons)
Table 59 RoW: Stevia Market Size, By Form, 2015–2022 (USD Million)
Table 60 RoW: Stevia Market Size, By Form, 2015–2022 (Tons)
Table 61 RoW: Stevia Market Size, By Application, 2015–2022 (USD Million)
Table 62 RoW: Stevia Market Size, By Application, 2015–2022 (Tons)
List of Figures (59 Figures)
Figure 1 Stevia Market Segmentation
Figure 2 Stevia Market: Research Design
Figure 3 Stevia Market Size Estimation Methodology: Bottom-Up Approach
Figure 4 Market Size Estimation Methodology: Top-Down Approach
Figure 5 Data Triangulation & Methodology
Figure 6 Assumptions of the Research Study
Figure 7 Limitations of the Research Study
Figure 8 Beverages Segment to Continue Dominating the Stevia Market Through 2022
Figure 9 Beverages Segment Estimated to Dominate the Market for Stevia in 2017 (USD Million)
Figure 10 Powdered Extracts Segment Estimated to Dominate the Market for Stevia in 2017
Figure 11 Asia-Pacific to Grow at the Highest Rate in the Stevia Market Through 2022
Figure 12 Asia-Pacific Dominated the Market in 2016, Followed By North America
Figure 13 Expansions & Investments and Acquisitions: the Key Strategies, 2012–2017
Figure 14 Stevia Market: Drivers, Restraints, Opportunities, and Challenges
Figure 15 Number of Products Adopting Stevia, By Region, 2011–2016
Figure 16 Number of Product Launches, By Category, 2016
Figure 17 Globally Estimated Number of People With Diabetes, Age Group (20–79 Years)
Figure 18 Global Overweight and Obese Population, 2005 vs 2015
Figure 19 Stevia Regulatory Clearance in Recent Years
Figure 20 China: Stevia Leaf Price Index
Figure 21 Regulations in Various Countries Related to Sugar-Added Products
Figure 22 Geographic Snapshot (2017-2022): the Markets in Asia-Pacific are Projected to Register High Growth Rates
Figure 23 North America: Stevia Market Snapshot
Figure 24 Prevalence of Obesity Among Adults in the U.S., 2014
Figure 25 Europe: Stevia Market Snapshot
Figure 26 Asia-Pacific: Stevia Market Snapshot
Figure 27 Stevia Market: Dive Chart
Figure 28 Cargill: Company Snapshot
Figure 29 Cargill: Product Offering Scorecard
Figure 30 Cargill: Business Strategy Scorecard
Figure 31 Ingredion Incorporated: Company Snapshot
Figure 32 Ingredion Incorporated: Product Offering Scorecard
Figure 33 Ingredion Incorporated: Business Strategy Scorecard
Figure 34 Tate & Lyle PLC: Company Snapshot
Figure 35 Tate & Lyle PLC.: Product Offering Scorecard
Figure 36 Tate & Lyle PLC.: Business Strategy Scorecard
Figure 37 Purecircle Limited: Company Snapshot
Figure 38 Purecircle Limited: Product Offering Scorecard
Figure 39 Purecircle Limited: Business Strategy Scorecard
Figure 40 GLG Life Tech Corporation: Company Snapshot
Figure 41 GLG Life Tech Corporation: Product Offering Scorecard
Figure 42 GLG Tech Corporation: Business Strategy Scorecard
Figure 43 Archer Daniels Midland Company: Company Snapshot
Figure 44 Wild Flavors Specialty Ingredients: Product Offering Scorecard
Figure 45 Wild Flavors Specialty Ingredients: Business Strategy Scorecard
Figure 46 Sunwin Stevia International, Inc.: Product Offering Scorecard
Figure 47 Sunwin Stevia International, Inc.: Business Strategy Scorecard
Figure 48 S&W Seed Company: Company Snapshot
Figure 49 S&W Seed Company: Product Offering Scorecard
Figure 50 S&W Seed Company: Business Strategy Scorecard
Figure 51 Pyure Brand LLC: Product Offering Scorecard
Figure 52 Pyure Brand LLC.: Business Strategy Scorecard
Figure 53 Morita Kagakau Kogyo Co. Ltd: Product Offering Scorecard
Figure 54 Morita Kagakau Kogyo Co. Ltd: Business Strategy Scorecard
Figure 55 Zhuchen Haotian Pharm Co. Ltd: Product Offering Scorecard
Figure 56 Zhuchen Haotian Pharm Co. Ltd: Business Strategy Scorecard
Figure 57 Evolva Holding SA: Company Snapshot
Figure 58 Evolva Holding SA: Product Offering Scorecard
Figure 59 Evolva Holding SA: Business Strategy Scorecard


Growth opportunities and latent adjacency in Stevia Market