Cheese Ingredients Market by Cheese Type (Natural (Cheddar, Parmesan, Mozzarella, Gouda), Processed), Ingredient (Milk (Fresh Milk, Powdered Milk, Milk Cream), Cultures, Enzymes (Rennet, Lipase), Additives), and Region - Global Forecast to 2022


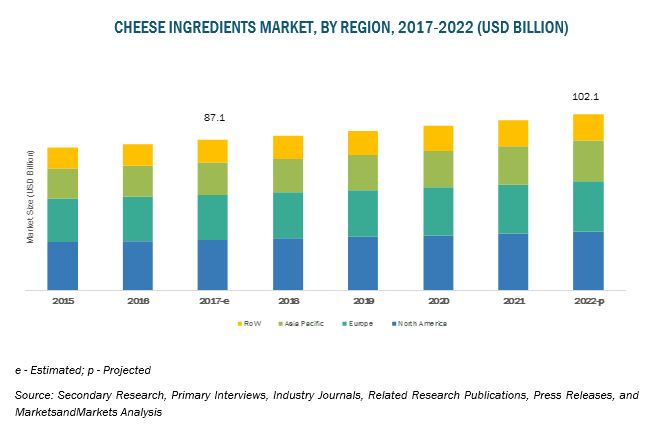
The cheese ingredients market is estimated to be valued at USD 87.1 billion in 2017, and is projected to reach USD 102.1 billion by 2022, at a CAGR of 3.24% from 2017. The growth of this market is proportionally dependent upon the growth of the cheese industry.
The meteoric rise in the fast food industry impacted the demand for cheese ingredients.
The market is driven by increase in demand for cheese as a key ingredient in the fast food industry. Furthermore, factors such as rapid growth in the fast food industry are expected to increase the demand for cheese, subsequently increasing the demand for cheese ingredients. However, there are several restrictions on the levels of contents and their usage in the cheese making process imposed by various regulatory bodies, which act as a restraint for the market growth. Additionally, consumer shift toward the consumption of vegan food products is also expected to affect the market growth.

e-estimated; p-projected
Source: Secondary Research, Primary interviews, Related Research Publications, Industry Journals, Press Releases,
and MarketsandMarkets Analysis
To know about the assumptions considered for the study, download the pdf brochure
“The natural cheese segment is projected to grow at the highest rate for the cheese ingredients market during the forecast period.”
The global market, based on cheese type, has been segmented into natural cheese (which includes cheddar, parmesan, mozzarella, Gouda, Swiss, blue, ricotta, feta, Romano, and cottage) and processed cheese (which includes restricted-melt, standard-melt, and quick-melt). The natural cheese segment dominated this market in 2016 due to its popularity in the North American and European regions owing to the rise in health awareness among consumers. Furthermore, among the types of natural cheese, the demand for mozzarella cheese is expected to grow in North America owing to growing popularity of Italian dishes such as pizza. This, in turn, is expected to increase the demand for cheese ingredients.
“Asia Pacific led the market in terms of growth rate.”
Asia Pacific led the global cheese ingredients market in terms of growth rate between 2017 and 2022. The demand for cheese is expected to increase in the Asia Pacific region owing to the impact of western dietary habits, rise in disposable income levels, and changes in lifestyles in countries such as China and India. Factors such as rapid growth in the fast food industry are expected to increase the demand for cheese, subsequently increasing the demand for cheese ingredients. Furthermore, the cheese manufacturers in this region are increasingly producing processed cheese as the fast food industry in the region demands more of processed cheese due to its longer shelf life and widespread usage.
“Cultures segment is projected to be the fastest-growing from 2017 to 2022.”
The cultures segment, by ingredient, is projected to grow at the highest CAGR during the forecast period. The cheese manufacturers are increasingly shifting the use of cultures from bulk starter cultures to DVS and other similar technologies. Their ease of use is the key factor leading to the increased adoption of the DVS technology for milk coagulation in the cheese making process.
MARKET DYNAMICS
“Change in consumer preferences is boosting the Global Cheese Production”
Global cheese production is rising significantly, owing to growing demand for dairy products in emerging economies such as India and China, and increasing preference for natural cheese in developed nations. The industry offers a wide range of cheese in terms of texture, flavor, and taste, and these characteristics of cheese are largely dependent on the raw material used for its manufacturing.
Cheese is used as an integral constituent in fast-food and fine dining restaurants. According to the US Dairy Export Council (USDEC), the global cheese production stood at 20.4 million tons in 2010, which rose to 23 million tons by 2015, depicting a CAGR of 2.43% between 2011 and 2015. The increasing demand for cheese from the developing nations is expected to create significant export opportunities for the developed nations such as the US. According to USDEC, the global cheese demand is expected to rise in developing nations, which will drive the cheese trade by an additional 100,000 tons, annually, by 2021. The US and Europe Union (EU) are the world’s largest producers and exporters of cheese, with the EU representing approximately 72% of the global exports. The lifting of quota limits on the production of milk in the EU will lead to an increase in the production of cheese by 660,000 metric tons by 2020, as stated by USDEC. The following infographic provides statistical insights into the US cheese production scenario, with a forecast to 2020.
“Unfavourable regulatory conditions restraining the growth of cheese ingredient market.”
The growth of the cheese ingredients market is directly in proportion with the growth of the cheese market. Thus, any restriction on the manufacturing of cheese negatively impacts the global market. Numerous regulations enforced by various food safety organizations such as the US Food and Drug Administration (FDA), Food and Drugs Act of Canada, Ministry of Health of Mexico, Scientific Committee on Food (SCF), and the European Food Safety Authority (EFSA), and Food Safety and Standards Authority of India (FSSAI), are restricting the use of various ingredients in cheese making. Bans imposed on certain types of cheese also hamper market growth. The US FDA banned the sale of various artisan French cheeses such as Roquefort, Morbier, and Tomme de Savoie in the US. This was done owing to the use of raw milk in cheese making and bacteria found in these cheeses. Such a ban has negatively impacted the exports of cheese from France, which has led to declined production of cheese, resulting in subsequent decline in cheese ingredients market.
The Italian Law No 138 of 11 April, 1974 forbids the use of milk powder or any form of milk concentrates in cheese making. It also restricts the sale of any product made with these ingredients in Italy, thus restraining the growth of powder milk as a cheese ingredient in the Italian market. Similarly, the EU legislation Article 19(1) (d) of Regulation (EU) No 1169/2011 lays down the list of ingredients that can only be added for cheese making. Any cheese product having ingredients out of this list cannot be sold in the European countries.
“Abolition of milk quotas in the European Union to provide significant growth opportunities for cheese ingredient market.”
The milk market in EU was regulated by the quota system that was legislated on 2 April 1984, under the Dairy Produce Quota Regulations 1984. Under this system, all the member states of EU were given national milk production quotas and any nation exceeding the limits was liable for a penalty known as ‘super levy’. There were five kinds of quotas: direct sales quota, wholesale quota, purchaser quota, purchaser special quota, and SLOM quota. Such a restriction on the production of milk in the EU had limited the quantity of milk that can be used as an ingredient by the cheese manufacturers. Reduced milk production has also resulted in loss to the European cheese exporters.
Abolition of the milk quotas on 31 March 2015 had outpaced the production and supply of milk in the European region. According to EUROPA, the abolition of milk quotas is expected to increase the milk production by ~5.0%, while lowering the farm milk prices by 10.3%. The cheese manufacturers can now procure the key raw material in higher quantities at a lower price. This provides great opportunity to the cheese manufacturers and farmers to increase their production and generate exports.
“Rise in awareness regarding the ill health effects of cheese pose a challenge to global cheese manufacturers.”
Consumption of cheese made from raw milk poses a great challenge to the growth of the global cheese ingredients market owing to association of various microbial contaminations leading to health issues. Obesity, high cholesterol levels, and heart diseases are the major conditions associated with the consumption of processed cheese. Furthermore, studies also suggest that consumption of cheddar cheese may also pose an increased risk of breast cancer by increasing the production of galactose from lactose. The ripening process of cheese includes the production of a toxic alkaloid and toxic amines that brings changes to the nervous system resulting in high blood pressure, headaches, palpitations, and migraines. The rennet, preservatives, emulsifiers, and other chemical agents used in the production process of cheese can have harmful effect on the body. In the US, certain kinds of cheese have resulted in outbreaks of food-borne gastroenteritis, food sensitivities, lactose intolerance, allergies, and high calorie content. The consumers have now become aware about the association of these diseases with cheese. This factor is posing as a challenge for various cheese and ingredient manufacturers to overcome and meet the customer demand for healthy food.
Scope of the report
|
Report Metric |
Details |
|
Market size available for years |
2017–2022 |
|
Base year considered |
2016 |
|
Forecast period |
2017–2022 |
|
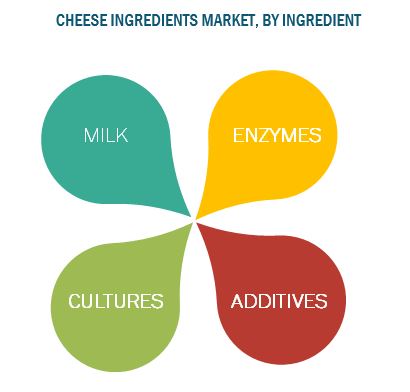
Forecast units |
Value (USD Million) & Volume (KT) |
|
Segments covered |
Type, Ingredients, and Region |
|
Geographies covered |
North America, Europe, Asia Pacific, and RoW |
|
Companies covered |
Chr. Hansen Holding (Denmark), Fonterra (New Zealand), DuPont (US), DSM (Netherlands), ADM (US), Sacco s.r.l. (Italy). Arla foods (Denmark), Saputo Inc. (Canada), Almarai (Saudi Arabia), Alpura (Mexico), and CSK Food Enrichment (Netherlands) |
This research report categorizes the cheese ingredients market based on cheese type, ingredient, and region.
Based on Cheese Type, the market has been segmented as follows:
-
Natural
- Cheddar
- Parmesan
- Mozzarella
- Gouda
- Others (Swiss, blue, Romano, Brie, ricotta, feta, and cottage)
-
Processed
- Restricted-melt
- Standard-melt
- Quick-melt
Based on Ingredient, the market has been segmented as follows:
-
Milk
- Fresh milk
- Milk powder
- Milk cream
- Cultures
-
Enzymes
- Rennet
- Lipase
-
Additives
- Cheese salts
- Food colors
- Others (acetic acid, emulsifiers, molds, herbs & spices, and preservatives)
Based on Region, the market has been segmented as follows:
- North America
- Europe
- Asia Pacific
- RoW (South America, the Middle East, and Africa)
Recent developments
|
Date |
Company |
Development |
|
September 2018 |
Mergers & Acquistion |
DuPont completed its merger with Dow Chemical Company. The combined entity was expected to operate as a holding company under the name DowDuPont with agriculture, materials science, and specialty product divisions. |
|
November 2017 |
New product launch |
Chr. Hansen developed a series of second generation FreshQ cultures in order to expand its product portfolio. With the help of this product, dairies can rely on natural freshness and contribute to reducing food waste. |
|
November 2017 |
Expansion |
Fonterra announced the expansion of Waitoa UHT site to cater to the increasing demand for milk and cream products. Its capacity of producing 80,000 cartons was expected to increase by 45,000 cartons per hour. |
Key Questions Addressed by the Report
- Who are the major market players in the cheese ingredient market?
- What are the regional growth trends and the largest revenue-generating regions for the cheese ingredient market?
- Which are the major regions for different industries that are projected to witness a significant growth for the cheese ingredient market?
- What are the major types of cheese ingredient that are projected to gain maximum market revenue and share during the forecast period?
- Which are the major application areas of cheese ingredient that will be accounting for most of the revenue over the forecast period?
 Exclusive indicates content/data unique to MarketsandMarkets and not available with any competitors.
Table of Contents
1 Introduction
1.1 Objectives of The Study
1.2 Market Definition
1.3 Study Scope
1.3.1 Markets Covered
1.3.2 Years Considered for The Study
1.4 Currency
1.5 Unit Considered
1.6 Stakeholders
2 Research Methodology
2.1 Research Data
2.2 Market Share Estimation
2.2.1 Secondary Data
2.2.1.1 Key Data from Secondary Sources
2.2.2 Primary Data
2.2.2.1 Key Industry Insights
2.2.2.2 Breakdown of Primaries
2.3 Market Size Estimation
2.4 Market Breakdown & Data Triangulation
2.5 Research Assumptions & Limitations
2.5.1 Assumptions
2.5.2 Limitations
3 Executive Summary
4 Premium Insights
4.1 Cheese Ingredients Market, 2017 Vs 2022
4.2 Market Size in Terms of Volume, By Region (2015-2022)
4.3 Cheese Ingredients Market in North America (2016)
4.4 Cheese Ingredients Market, By Cheese Type, Value & Volume (2017 Vs. 2022)
4.5 Market, By Ingredient
4.6 Cheese Ingredients Market Attractiveness
5 Market Overview
5.1 Introduction
5.2 Market Evolution
5.3 Market Dynamics
5.3.1 Drivers
5.3.1.1 Growth of The Cheese Industry
5.3.1.2 Rapid Growth of The Fast-Food Industry
5.3.1.3 Rise in Disposable Income and Urbanization
5.3.2 Restraints
5.3.2.1 Unfavorable Regulatory Conditions
5.3.2.2 Growth in Consumer Preference for Vegan Diet
5.3.2.3 Increase in Cases of Lactose Intolerance
5.3.3 Opportunities
5.3.3.1 Abolition of Milk Quotas in European Union
5.3.4 Challenges
5.3.4.1 Rise in Awareness Regarding the Ill Health Effects of Cheese
5.3.4.2 Cheese Contamination and Product Recalls
5.4 Regulatory Environment Analysis
5.4.1 North America: Regulatory Framework
5.4.2 Europe: Regulatory Framework
5.4.3 Asia Pacific: Regulatory Framework
5.4.4 South America: Regulatory Framework
6 Cheese Ingredients Market, By Cheese Type
6.1 Introduction
6.2 Natural Cheese
6.2.1 Mozzarella
6.2.2 Cheddar
6.2.3 Parmesan Cheese
6.2.4 Gouda
6.2.5 Others
6.3 Processed Cheese
6.3.1 Restricted-Melt (Qualitative)
6.3.2 Standard-Melt (Qualitative)
6.3.3 Quick-Melt (Qualitative)
7 Cheese Ingredients Market, By Ingredient
7.1 Introduction
7.2 Milk
7.3 Cultures
7.4 Enzymes
7.5 Additives
8 Cheese Ingredients Market, By Region
8.1 Introduction
8.2 North America
8.2.1 Us
8.2.2 Canada
8.2.3 Mexico
8.3 Europe
8.3.1 Germany
8.3.2 UK
8.3.3 France
8.3.4 Italy
8.3.5 Netherlands
8.3.6 Rest of Europe
8.4 Asia Pacific
8.4.1 China
8.4.2 India
8.4.3 Japan
8.4.4 Australia-New Zealand
8.4.5 Rest of Asia Pacific
8.5 Row
8.5.1 Brazil
8.5.2 Argentina
8.5.3 Africa
8.5.4 Middle East
8.5.5 Others in Row
9 Competitive Landscape
9.1 Overview
9.2 Market Ranking Analysis
9.3 Competitive Situation and Trends
9.3.1 Mergers & Acquisitions
9.3.2 New Product Launches
9.3.3 Expansions
9.3.4 Partnerships, Agreements, Collaborations, And Investments
9.3.5 Joint Ventures
10 Company Profiles
10.1 Chr. Hansen Holding
10.1.1 Business Overview
10.1.2 Products Offered
10.1.3 Recent Developments
10.1.4 Swot Analysis
10.1.5 Mnm View
10.2 Fonterra
10.2.1 Business Overview
10.2.2 Products Offered
10.2.3 Recent Developments
10.2.4 Swot Analysis
10.2.5 Mnm View
10.3 Dupont
10.3.1 Business Overview
10.3.2 Products Offered
10.3.3 Recent Developments
10.3.4 Swot Analysis
10.3.5 Mnm View
10.4 DSM
10.4.1 Business Overview
10.4.2 Products Offered
10.4.3 Recent Developments
10.4.4 Swot Analysis
10.4.5 Mnm View
10.5 ADM
10.5.1 Business Overview
10.5.2 Products Offered
10.5.3 Recent Developments
10.5.4 Swot Analysis
10.5.5 Mnm View
10.6 Arla Foods
10.7 Saputo Inc.
10.8 Almarai
10.9 Alpura
10.10 CSK Food Enrichment
10.11 Sacco SRL
10.12 Dairy Farmers of America
11 Appendix
11.1 Discussion Guide
11.2 Company Developments
11.2.1 Mergers & Acquisitions
11.2.2 New Product Launches
11.2.3 Expansions
11.2.4 Partnerships, Agreements, Collaborations, Investments
11.2.5 Joint Ventures
11.3 Knowledge Store: MarketsandMarkets’ Subscription Portal
11.4 Introducing Rt: Real-Time Market Intelligence
11.5 Available Customizations
11.6 Related Reports
11.7 Author Details
List of Tables
Table 1 Us Dollar Exchange Rate, 2014–2016
Table 2 Global Number of Outlets of Key Fast Food Chains, 2010–2016
Table 3 Cheese Ingredients Market Size, By Cheese Type, 2015–2022 (USD Million)
Table 4 Market Size for Cheese Ingredients, By Cheese Type, 2015–2022 (KT)
Table 5 Natural Cheese Ingredients Market Size, By Subtype, 2015–2022 (USD Million)
Table 6 Market Size for Natural Cheese Ingredients, By Subtype, 2015–2022 (KT)
Table 7 Natural Cheese Market Size, By Region, 2015–2022 (USD Million)
Table 8 Market Size for Natural Cheese, By Region, 2015–2022 (KT)
Table 9 Processed Cheese Market Size, By Region, 2015–2022 (USD Million)
Table 10 Processed Cheese Market Size, By Region, 2015–2022 (KT)
Table 11 Cheese Ingredients Market Size, By Ingredient, 2015–2022 (USD Million)
Table 12 Market Size for Cheese Ingredients, By Ingredient, 2015–2022 (KT)
Table 13 Milk Market Size, By Region, 2015–2022 (USD Million)
Table 14 Milk Market Size, By Region, 2015–2022 (KT)
Table 15 Milk Market Size, By Type, 2015–2022 (USD Million)
Table 16 Milk Market Size, By Type, 2015–2022 (KT)
Table 17 Cultures Market Size, By Region, 2015–2022 (USD Million)
Table 18 Cultures Market Size, By Region, 2015–2022 (KT)
Table 19 Enzymes Market Size, By Region, 2015–2022 (USD Million)
Table 20 Enzymes Market Size, By Region, 2015–2022 (KT)
Table 21 Enzymes Market Size, By Type, 2015–2022 (USD Million)
Table 22 Enzymes Market Size, By Type, 2015–2022 (KT)
Table 23 Additives Market Size, By Region, 2015–2022 (USD Million)
Table 24 Additives Market Size, By Region, 2015–2022 (KT)
Table 25 Additives Market Size, By Type, 2015–2022 (USD Million)
Table 26 Additives Market Size, By Type, 2015–2022 (KT)
Table 27 Cheese Ingredients Market, By Region, 2015-2022 (USD Million)
Table 28 Market Size for Cheese Ingredients, By Region, 2015-2022 (KT)
Table 29 North America: Cheese Ingredients Market, By Country, 2015–2022 (USD Million)
Table 30 North America: Market, By Country, 2015–2022 (KT)
Table 31 North America: Market, By Cheese Type, 2015–2022 (USD Million)
Table 32 North America: Market, By Cheese Type, 2015–2022 (KT)
Table 33 North America: Natural Cheese Ingredients Market, By Cheese Subtype, 2015–2022 (USD Million)
Table 34 North America: Market, By Cheese Subtype, 2015–2022 (KT)
Table 35 North America: Market, By Ingredient, 2015–2022 (USD Million)
Table 36 North America: Market, By Ingredient, 2015–2022 (KT)
Table 37 North America: Market, By Milk Type, 2015–2022 (USD Million)
Table 38 North America: Market, By Milk Type, 2015–2022 (KT)
Table 39 North America: Market, By Enzyme Type, 2015–2022 (USD Million)
Table 40 North America: Market, By Enzyme Type, 2015–2022 (KT)
Table 41 North America: Market, By Additive, 2015–2022 (USD Million)
Table 42 North America: Market, By Additive, 2015–2022 (KT)
Table 45 US: Cheese Ingredients Market, By Cheese Type, 2015–2022 (USD Million)
Table 46 US: Market, By Cheese Type, 2015–2022 (KT)
Table 47 US: Market, By Ingredient, 2015–2022 (USD Million)
Table 49 US: Market, By Ingredient, 2015–2022 (KT)
Table 50 Canada: Cheese Ingredients Market, By Cheese Type, 2015–2022 (USD Million)
Table 51 Canada: Market Size for Cheese Ingredients, By Cheese Type, 2015–2022 (KT)
Table 52 Canada: Market Size for Cheese Ingredients, By Ingredient, 2015–2022 (USD Million)
Table 53 Canada: Market Size for Cheese Ingredients, By Ingredient, 2015–2022 (KT)
Table 54 Mexico: Cheese Ingredients Market Size, By Ingredient, 2015–2022 (USD Million)
Table 55 Mexico: Market Size for Cheese Ingredients, By Ingredient, 2015–2022 (KT)
Table 56 Mexico: Market Size for Cheese Ingredients, By Ingredient, 2015–2022 (USD Million)
Table 57 Mexico: Market Size for Cheese Ingredients, By Ingredient, 2015–2022 (KT)
Table 58 Europe: Cheese Ingredients Market Size, By Country, 2015–2022 (USD Million)
Table 59 Europe: Market Size for Cheese Ingredients, By Country, 2015–2022 (KT)
Table 60 Europe: Market Size for Cheese Ingredients, By Cheese Type, 2015–2022 (USD Million)
Table 61 Europe: Market Size for Cheese Ingredients, By Cheese Type, 2015–2022 (KT)
Table 62 Europe: Natural Cheese Ingredients Market Size, By Type, 2015–2022 (USD Million)
Table 63 Europe: Market Size, By Type, 2015–2022 (KT)
Table 64 Europe: Cheese Ingredients Market Size, By Ingredient, 2015–2022 (USD Million)
Table 65 Europe: Market Size for Cheese Ingredients, By Ingredient, 2015–2022 (KT)
Table 66 Europe: Market Size for Cheese Ingredients, By Milk Type, 2015–2022 (USD Million)
Table 67 Europe: Market Size for Cheese Ingredients, By Milk Type, 2015–2022 (KT)
Table 68 Europe: Market Size for Cheese Ingredients, By Enzyme Type, 2015–2022 (USD Million)
Table 69 Europe: Market Size for Cheese Ingredients, By Enzyme Type, 2015–2022 (KT)
Table 70 Europe: Market Size for Cheese Ingredients, By Additive Type, 2015–2022 (USD Million)
Table 71 Europe: Market Size for Cheese Ingredients, By Additive Type, 2015–2022 (KT)
Table 72 Germany: Cheese Ingredients Market Size, By Ingredient, 2015–2022 (USD Million)
Table 73 Germany: Market Size for Cheese Ingredients, By Ingredient, 2015–2022 (KT)
Table 74 Germany: Market Size for Cheese Ingredients, By Ingredient, 2015–2022 (USD Million)
Table 75 Germany: Market Size for Cheese Ingredients, By Ingredient, 2015–2022 (KT)
Table 76 UK: Cheese Ingredients Market Size, By Ingredient, 2015–2022 (USD Million)
Table 77 Uk: Market Size for Cheese Ingredients, By Ingredient, 2015–2022 (KT)
Table 78 Uk: Market Size for Cheese Ingredients, By Ingredient, 2015–2022 (USD Million)
Table 79 Uk: Market Size for Cheese Ingredients, By Ingredient, 2015–2022 (KT)
Table 80 France: Cheese Ingredients Market Size, By Ingredient, 2015–2022 (USD Million)
Table 81 France: Market Size for Cheese Ingredients, By Ingredient, 2015–2022 (KT)
Table 82 France: Market Size for Cheese Ingredients, By Ingredient, 2015–2022 (USD Million)
Table 83 France: Market Size for Cheese Ingredients, By Ingredient, 2015–2022 (KT)
Table 84 Italy: Cheese Ingredients Market Size, By Ingredient, 2015–2022 (USD Million)
Table 85 Italy: Market Size for Cheese Ingredients, By Ingredient, 2015–2022 (KT)
Table 86 Italy: Market Size for Cheese Ingredients, By Ingredient, 2015–2022 (USD Million)
Table 87 Italy: Market Size for Cheese Ingredients, By Ingredient, 2015–2022 (KT)
Table 88 Netherlands: Cheese Ingredients Market Size, By Ingredient, 2015–2022 (USD Million)
Table 89 Netherlands: Market Size for Cheese Ingredients, By Ingredient, 2015–2022 (KT)
Table 90 Netherlands: Market Size for Cheese Ingredients, By Ingredient, 2015–2022 (USD Million)
Table 91 Netherlands: Market Size for Cheese Ingredients, By Ingredient, 2015–2022 (KT)
Table 92 Rest of Europe: Cheese Ingredients Market Size, By Ingredient, 2015–2022 (USD Million)
Table 93 Rest of Europe: Market Size for Cheese Ingredients, By Ingredient, 2015–2022 (KT)
Table 94 Asia Pacific: Cheese Ingredients Market Size, By Country, 2015–2022 (USD Million)
Table 95 Asia Pacific: Market Size for Cheese Ingredients, By Country, 2015–2022 (KT)
Table 96 Asia Pacific: Market Size for Cheese Ingredients, By Cheese Type, 2015–2022 (USD Million)
Table 97 Asia Pacific: Market Size for Cheese Ingredients, By Cheese Type, 2015–2022 (KT)
Table 98 Asia Pacific: Natural Cheese Ingredients Market Size, By Type, 2015–2022 (USD Million)
Table 99 Asia Pacific: Market Size, By Type, 2015–2022 (KT)
Table 100 Asia Pacific: Cheese Ingredients Market Size, By Ingredient, 2015–2022 (USD Million)
Table 101 Asia Pacific: Market Size for Cheese Ingredients, By Ingredient, 2015–2022 (KT)
Table 102 Asia Pacific: Market Size for Cheese Ingredients, By Milk Type, 2015–2022 (USD Million)
Table 103 Asia Pacific: Market Size for Cheese Ingredients, By Milk Type, 2015–2022 (KT)
Table 104 Asia Pacific: Market Size for Cheese Ingredients, By Enzyme Type, 2015–2022 (USD Million)
Table 105 Asia Pacific: Market Size for Cheese Ingredients, By Enzyme Type, 2015–2022 (KT)
Table 106 Asia Pacific: Market Size for Cheese Ingredients, By Additive Type, 2015–2022 (USD Million)
Table 107 Asia Pacific: Market Size for Cheese Ingredients, By Additive Type, 2015–2022 (KT)
Table 108 China: Cheese Ingredients Market Size, By Ingredient, 2015–2022 (USD Million)
Table 109 China: Market Size for Cheese Ingredients, By Ingredient, 2015–2022 (KT)
Table 110 India: Market Size for Cheese Ingredients, By Ingredient, 2015–2022 (USD Million)
Table 111 India: Market Size for Cheese Ingredients, By Ingredient, 2015–2022 (KT)
Table 112 Japan: Market Size for Cheese Ingredients, By Ingredient, 2015–2022 (USD Million)
Table 113 Japan: Market Size for Cheese Ingredients, By Ingredient, 2015–2022 (KT)
Table 114 Australia-New Zealand: Market Size for Cheese Ingredients, By Ingredient, 2015–2022 (USD Million)
Table 115 Australia-New Zealand: Market Size for Cheese Ingredients, By Ingredient, 2015–2022 (KT)
Table 116 Rest of Asia Pacific: Cheese Ingredients Market Size, By Ingredient, 2015–2022 (USD Million)
Table 117 Rest of Asia Pacific: Market Size for Cheese Ingredients, By Ingredient, 2015–2022 (KT)
Table 118 ROW: Cheese Ingredients Market Size, By Country, 2015–2022 (USD Million)
Table 119 ROW: Market Size for Cheese Ingredients, By Country, 2015–2022 (KT)
Table 120 ROW: Market Size for Cheese Ingredients, By Cheese Type, 2015–2022 (USD Million)
Table 121 ROW: Market Size for Cheese Ingredients, By Cheese Type, 2015–2022 (KT)
Table 122 ROW: Natural Cheese Ingredients Market Size, By Type, 2015–2022 (USD Million)
Table 123 ROW: Market Size, By Type, 2015–2022 (KT)
Table 124 ROW: Cheese Ingredients Market Size, By Ingredient, 2015–2022 (USD Million)
Table 125 ROW: Market Size for Cheese Ingredients, By Ingredient, 2015–2022 (KT)
Table 126 ROW: Market Size for Cheese Ingredients, By Milk Type, 2015–2022 (USD Million)
Table 127 ROW: Market Size for Cheese Ingredients, By Milk Type, 2015–2022 (KT)
Table 128 ROW: Market Size for Cheese Ingredients, By Enzyme Type, 2015–2022 (USD Million)
Table 129 ROW: Market Size for Cheese Ingredients, By Enzyme Type, 2015–2022 (KT)
Table 130 ROW: Market Size for Cheese Ingredients, By Additive Type, 2015–2022 (USD Million)
Table 131 ROW: Market Size for Cheese Ingredients, By Additive Type, 2015–2022 (KT)
Table 132 Brazil: Cheese Ingredients Market Size, By Ingredient, 2015–2022 (USD Million)
Table 133 Brazil: Market Size for Cheese Ingredients, By Ingredient, 2015–2022 (KT)
Table 134 Argentina: Market Size for Cheese Ingredients, By Ingredient, 2015–2022 (USD Million)
Table 135 Argentina: Market Size for Cheese Ingredients, By Ingredient, 2015–2022 (KT)
Table 136 Africa: Market Size for Cheese Ingredients, By Ingredient, 2015–2022 (USD Million)
Table 137 Africa: Market Size for Cheese Ingredients, By Ingredient, 2015–2022 (KT)
Table 138 Middle East: Cheese Ingredients Market Size, By Ingredient, 2015–2022 (USD Million)
Table 139 Middle East: Market Size for Cheese Ingredients, By Ingredient, 2015–2022 (KT)
Table 140 Others in Row: Market Size for Cheese Ingredients, By Ingredient, 2015–2022 (USD Million)
Table 141 Others in Row: Market Size for Cheese Ingredients, By Ingredient, 2015–2022 (KT)
Table 142 Company Ranking, 2013-2017
Table 143 Mergers & Acquisitions, 2013–2017
Table 144 New Product Launches, 2013–2017
Table 145 Expansions, 2013–2017
Table 146 Partnerships, Agreements, Collaborations, Investments, 2013–2017
Table 147 Joint Ventures, 2013–2017
List of Figures
Figure 1 Market Segmentation
Figure 2 Cheese Ingredients Market: Research Design
Figure 3 Breakdown of Primary Interviews: By Company Type, Designation, And Region
Figure 4 Market Size Estimation: Bottom-Up Approach
Figure 5 Market Size Estimation Methodology: Top-Down Approach
Figure 6 Market Breakdown & Data Triangulation
Figure 7 Natural Ingredients to Dominate the Global Market, In Terms of Value
Figure 8 Milk Segment to Dominate the Global Market Between 2017 And 2022
Figure 9 India To Be the Fastest-Growing Country-Level Market, In Terms of Value (2017–2022)
Figure 10 Attractive Growth Opportunities in Cheese Ingredients Market for Manufacturers
Figure 11 Cheese Ingredients Market: Asia Pacific To Grow at The Fastest Pace Between 2017 And 2022
Figure 12 US Held the Largest Share in The Global Market During the Forecast Period
Figure 13 Processed Cheese Ingredients Segment to Grow at The Highest CAGR Between 2017 To 2022
Figure 14 Milk Segment Dominated the Global Market Across All Regions In 2016
Figure 15 Asia Pacific Cheese Ingredients Market to Grow at The Highest CAGR 2017 Between 2022
Figure 16 Globally Rising Cheese Production and Rapid Growth in The Fast Food Industry Is To Lead The Global Market In Future
Figure 17 US: Cheese Production Data Forecast To 2007-2020
Figure 18 US: Fast Food Industry Growth, 2005–2014
Figure 19 GDP Of Leading Countries, 2016
Figure 20 Authorities Regulating the Cheese Ingredients Market
Figure 21 Natural Cheese Segment to Dominate the Global Market, 2016 Vs. 2022
Figure 22 Mozzarella Is Projected to Hold the Largest Share In The Natural Cheese Ingredients Market By 2022 (USD Million)
Figure 23 North America Projected to Hold the Largest Share in The Natural Cheese Ingredients Market By 2022 (USD Million)
Figure 24 North America To Hold the Largest Share in The Natural Cheese Ingredients Market By 2022 (USD Million)
Figure 25 Cheese Ingredients Market, By Ingredient
Figure 26 Milk Accounted for The Largest Market Size in The Global Market In 2016
Figure 27 North America Led the Milk Segment of The Cheese Ingredients Market, 2016 Vs 2022
Figure 28 North America To Lead the Global Cheese Ingredients Cultures Market Until 2022
Figure 29 North America To Dominate the Enzymes Segment, 2016 Vs 2022
Figure 30 North America Is Projected to Lead the Global Cheese Ingredients Additives Market Until 2022
Figure 31 North America Is Expected to Dominate the Global Cheese Ingredients Market By 2022
Figure 32 Regional Snapshot: India To Be the Most Attractive Market for Cheese Ingredient Manufacturers (2017-2022)
Figure 33 North American Cheese Ingredients Market Snapshot: Us Accounting for The Largest Share
Figure 34 Asia Pacific Cheese Ingredients Market Snapshot: Australia-New Zealand Accounting for The Largest Market Share
Figure 35 Companies Adopted Mergers & Acquisitions as Their Key Growth Strategies From 2013 To 2017
Figure 36 Chr. Hansen Holding: Company Snapshot
Figure 37 Chr. Hansen Holding: SWOT Analysis
Figure 38 Fonterra: Company Snapshot
Figure 39 Fonterra: SWOT Analysis
Figure 40 Dupont: Company Snapshot
Figure 41 Dupont: SWOT Analysis
Figure 42 DSM: Company Snapshot
Figure 43 DSM: SWOT Analysis
Figure 44 ADM: Company Snapshot
Figure 45 ADM: SWOT Analysis
Figure 46 Arla Foods: Company Snapshot
Figure 47 Saputo Inc.: Company Snapshot
Figure 48 Almarai: Company Snapshot
Figure 49 Dairy Farmers of America: Company Snapshot


Growth opportunities and latent adjacency in Cheese Ingredients Market