Enzymes Market

Enzymes Market by Product Type (Industrial Enzymes and Specialty Enzymes), Source (Microorganism, Plant, and Animal), Type, Industrial Enzyme Application, Specialty Enzymes Application, Reaction Type and Region - Global Forecast to 2029

Report Code: FB 7583 May, 2024, by marketsandmarkets.com

According to MarketsandMarkets, the global Enzymes market size is estimated to be valued at USD 14.0 billion in 2024 and is projected to reach USD 20.4 billion by 2029, recording a CAGR of 7.8%. The growth of the enzymes market is fueled by key factors such as a notable surge in demand for processed foods, driven by changing consumer lifestyles and preferences. This trend necessitates the use of enzymes to improve the quality, texture, and shelf-life of these products. Enzymes find expanding applications across various industries, including pharmaceuticals, biofuels, textiles, and more, contributing to their widespread adoption and market growth.

The expanding business has offered lucrative business opportunities to the players who are operating in the market segments. For instance, in June 2023, Kerry Group plc. introduces Biobake EgR, an innovative enzyme solution that reduces egg usage in various baking applications, allowing European manufacturers to switch to free-range or organic eggs without increasing costs. Other major players, such as Dyadic International, Inc (US), Dyadic International entered a development and exclusive license agreement to commercialize non-animal dairy enzymes with Dapibus, receiving a USD 0.6 million upfront payment in October 2023. The company achieved the target yield for a milestone payment, pending partner verification, and is progressing well with developing a second enzyme. This boosts Dyadic's market position.

Enzymes Market

To know about the assumptions considered for the study, Request for Free Sample Report

Enzymes Market Opportunities

To know about the assumptions considered for the study, download the pdf brochure

Enzymes Market Dynamics

Drivers: Growing environmental concerns and increasing demand for biofuel

The depletion of non-renewable resources has heightened the need for manufacturing biofuels, which have minimal environmental impact. In countries with surplus agricultural capacity, ethanol derived from biomass presents a viable alternative to traditional motor fuels like gasoline, diesel, and kerosene. This ethanol can serve as a substitute, extender, or octane booster. Biofuels are produced from agricultural waste materials such as corn stalks, leaves, sugarcane bagasse, sugar beet, sorghum stalks, wheat, barley, rye, and by-products from industries like cheese-making and potato processing. Biofuels offer a significant advantage by replacing toxic oxygenates in petroleum fuels, thus contributing to pollution reduction. The growing demand for biofuels has led to increased usage of enzymes, including amylases, lipases, cellulase, and proteases, which are essential in the biofuel production process. Among these, amylase enzymes are expected to dominate the biofuel enzymes market due to their robust performance across a wide range of temperatures and pH levels.

Additionally, the adoption of advanced biotechnological methods has improved the efficiency and yield of biofuel production. Innovations in enzyme engineering and biomass processing technologies are further enhancing the economic viability and environmental benefits of biofuels, making them a crucial component of sustainable energy strategies. Biofuels such as bioethanol are produced from biomass. According to OECD-FAO Agricultural Outlook 2019, about 60% of the ethanol is produced from corn, 25% from sugarcane, 7% from molasses, and 4% from wheat and other grains. Furthermore, according to the OECD-FAO Agricultural Outlook 2019–2028, the international biofuel sectors are strongly influenced by national policies with three major goals: reduced greenhouse gas emissions, farmer support, and reduced energy independence. Moreover, the demand for biofuels is expected to grow in developing countries due to developments in transportation fleets and domestic policies that favor demand at the consumer level. These factors are projected to drive the demand for biofuels in most regions.

Restraints: Stringent regulatory framework

Manufacturers of enzymes are required to adhere to various regulations imposed by different governing agencies, including the Enzyme Technical Association (ETA), the Association of Manufacturers & Formulators of Enzyme Products (AMFEP), and the EU REACH (Registration, Evaluation, and Authorization of Chemicals) Regulation. For enzymes used in the food industry, compliance with the guidelines set forth by the Food Chemicals Codex is mandatory. Despite stringent regulations in countries such as the UK, Canada, and the European Union, there is no uniform regulatory framework for the use of industrial enzymes globally. According to AMFEP, enzymes utilized in industries such as biofuels, paper & pulp, and textile & leather processing must be registered under the EU REACH Regulation (Regulation 1907/2006) before they are manufactured or imported into the EU in volumes exceeding one metric ton per year. The European Chemicals Agency (ECHA) oversees the registration process in Europe, ensuring that manufacturers comply with requirements related to labeling, packaging, and mixing of products before market placement. These regulations are designed to ensure the safety and efficacy of enzymes for their intended applications.

Additional considerations include the need for manufacturers to stay updated on regional variations in regulatory requirements, as compliance can significantly impact market access and operational processes. For instance, failure to adhere to EU REACH regulations can result in penalties and restricted market entry, underscoring the importance of rigorous compliance practices in enzyme manufacturing.

Opportunities: Demand for alternatives to synthetic chemicals

Enzymes are increasingly recognized as viable alternatives to traditional synthetic chemicals, offering environmentally friendly solutions to industrial challenges. Synthetic chemicals pose significant environmental threats due to their harmful nature. In contrast, enzymes like amylase and cellulase, derived from plants and microorganisms, operate under mild conditions, reducing energy consumption and greenhouse gas emissions. These enzymes are utilized in industries such as textile processing, starch processing, and biofuel production. The leather industry, for example, has adopted proteases and trypsin instead of lime and sulfides, achieving higher yields and cleaner products. Similarly, amylase and protease are employed in the bakery industry to maximize output.

Additionally, enzymes enhance the nutritional value of food and feed products, reduce water consumption, minimize chemical waste, and decrease by-product generation, posing negligible risks to humans and the ecosystem. Thus, enzymes are considered cost-effective, safe, and environmentally friendly. As products undergoing chemical processes increasingly present risks to human health and the environment, many industrial manufacturing companies are transitioning to safer, naturally derived alternatives. Consequently, the market for enzymes as substitutes for synthetic chemicals is anticipated to grow.

Challenges: Excessive Costs of Raw Materials Limiting Enzymes Usage

The excessive cost of raw materials can be a significant barrier to the use of industrial enzymes in some applications. Enzymes are typically produced using microbial fermentation processes requiring specialized equipment and nutrient-rich media, such as sugars, amino acids, and minerals. These raw materials can be expensive, and their availability can be subject to fluctuations in supply and demand.

In addition to the cost of raw materials, the cost of downstream processing, purification, and formulation can also contribute to the overall cost of industrial enzymes. These processes are necessary to isolate and purify the enzymes from the fermentation broth and formulate them into a stable and effective product for industrial applications. The excessive cost of industrial enzymes can limit their adoption in applications where cost is critical, such as in commodity markets or low-margin industries. This can also limit their adoption in developing countries, where the cost of enzymes may be prohibitive for small and medium-sized enterprises.

The Enzymes Market Ecosystem

Enzymes Market Ecosystem

The specialty enzymes segment is projected to hold a significant market share in the enzymes market during the forecast period.

Specialty enzymes play a critical role in the pharmaceutical and biotechnology industries. These enzymes are essential in biopharmaceutical production, including monoclonal antibodies and gene therapies, where precision and specificity are paramount. For instance, the enzyme proteinase K is widely used in DNA and RNA extraction processes for genomic research, which has seen increased demand due to advancements in personalized medicine and diagnostics. The specialty enzymes segment benefits from significant R&D investments and innovations. Companies like Novozymes A/S (Denmark) and dsm-firmenich (Switzerland) are focusing on developing novel enzymes with improved stability and activity for specific industrial applications. For example, in May 2023, dsm-firmenich launched Maxilact Next speeds milk processing by 25%, optimizing lactose-free dairy production and efficiency without altering taste. Furthermore, regulatory support for biopharmaceuticals and the increasing prevalence of chronic diseases requiring advanced treatments contribute to the growth of specialty enzymes, solidifying their market dominance.

The plant-derived enzymes segment holds a significant market share in the enzymes market.

The use of amylase derived from barley and wheat in the brewing industry. Amylase is critical for breaking down starches into fermentable sugars, which improves the efficiency and quality of beer production. Additionally, pectinase, sourced from fruits like apples and oranges, is extensively used in the juice and wine industries to clarify beverages and increase juice yield. Plant enzymes also play a crucial role in the growing market for plant-based and vegan products. For instance, transglutaminase, derived from plant sources, is utilized in meat alternatives to improve texture and binding properties, addressing the increasing consumer demand for sustainable and ethical food options. This trend is supported by the rising popularity of plant-based diets, which boosts the market for plant-derived enzymes. Moreover, companies like Novozymes have invested significantly in developing plant-based enzyme solutions tailored to specific industry needs. In March 2020, Novozymes A/S (Denmark) introduced Saphera Fiber, a lactase enzyme derived from plants, designed to increase fiber content in dairy products while reducing sugar levels, catering to health-conscious consumers.

The market growth is also driven by advancements in enzyme extraction and formulation technologies, which enhance enzyme stability and functionality. The scalability of plant enzyme production, combined with regulatory support for natural and non-GMO ingredients, further solidifies the plant segment's substantial market share in the enzyme industry.

The textile and leather industries hold a significant market share in the industrial application of enzymes.

In the textile industry, enzymes like amylases, cellulases, and laccases are extensively used. Amylases remove starch-based sizes from fabrics without damaging fibers, improving fabric quality and reducing water consumption. Cellulases, particularly in denim processing, create a desirable stone-washed effect without the use of pumice stones, reducing water and energy use. For example, Novozymes' Cellusoft is a cellulase product that enhances fabric softness and appearance while being environmentally friendly.

The leather industry benefits significantly from proteases and lipases, which streamline the soaking, bating, and degreasing processes. Proteases like NovoCor AD from Novozymes A/S efficiently break down non-collagen proteins, improving hide quality and reducing chemical use. Similarly, lipases help in degreasing hides, ensuring cleaner and higher-quality leather. AB Enzymes' LEATHERZYME P range offers specific solutions for different stages of leather processing, enhancing efficiency and product quality.

Adopting these enzymatic solutions aligns with the industries' growing focus on sustainability and regulatory compliance. Enzymes reduce the need for harsh chemicals, lower energy consumption, and minimize water pollution, addressing stringent environmental regulations and consumer demand for eco-friendly products. This drive towards greener and more efficient production processes underpins the significant market share held by the textile and leather sectors in the industrial enzyme market.

By specialty enzyme applications, the pharmaceuticals segment is projected to hold the highest market share during the forecast period

In drug formulation, enzymes like immobilized lipases are critical for synthesizing chiral intermediates, which are crucial in creating enantiomerically pure drugs. For example, the production of statins, widely used to lower cholesterol, relies on specialty enzymes to ensure the precise construction of their complex molecular structures.

In biopharmaceutical production, enzymes such as trypsin and pepsin are indispensable. Trypsin, specifically, is used in the manufacturing process of insulin and monoclonal antibodies. These enzymes facilitate protein cleavage and purification, ensuring the production of high-purity biopharmaceutical products. For instance, Genentech's production of monoclonal antibodies incorporates enzymatic processing steps that are crucial for achieving therapeutic-grade purity.

Moreover, the pharmaceutical industry's stringent quality and regulatory standards necessitate the use of high-purity specialty enzymes. Enzymes like DNA polymerases are vital in PCR (polymerase chain reaction) and qPCR (quantitative PCR) technologies. These techniques are fundamental in genetic testing and molecular diagnostics, including COVID-19 testing, where enzymes ensure the accuracy and reliability of diagnostic results. Companies like Thermo Fisher Scientific have developed advanced polymerase enzymes tailored for high-performance diagnostic applications.

Asia Pacific is poised to experience the highest CAGR in the Enzymes market during the forecast period.

The region's food and beverage sector is rapidly expanding due to rising consumer demand for processed foods and beverages. For example, the demand for convenience foods and beverages in countries like China and India is soaring, driving the need for food-processing enzymes. According to Nestlé India Annual Report, 2023, Nestlé has committed to investing USD 700 million in expanding its manufacturing capabilities to meet the rising consumer demand for processed foods.

The region's pharmaceutical and biotechnology sectors are also expanding rapidly. According to the India Brand Equity Foundation, 2023, India's pharmaceutical industry, which contributes over 20% of the global generics market, relies heavily on enzymes for drug production.

Environmental regulations and sustainability initiatives further drive market growth. China's stringent environmental policies, such as those outlined in the 14th Five-Year Plan, emphasize reducing industrial pollution, which promotes the use of enzyme-based solutions. These policies have led to a projected 10% annual growth in the industrial enzymes market in China.

Advancements in biotechnology and increased R&D investments enhance enzyme production capabilities. Japan and South Korea are at the forefront of biotechnological innovations, with South Korea investing over USD 2.5 billion annually in biotechnology R&D (OECD, 2023). These factors collectively contribute to the region's fast-paced market expansion.

Asia Pacific: Enzymes Market Snapshot

Asia Pacific Enzymes Market Size, and Share

Key Market Players

Get online access to the report on the World's First Market Intelligence Cloud

  • Easy to Download Historical Data & Forecast Numbers
  • Company Analysis Dashboard for high growth potential opportunities
  • Research Analyst Access for customization & queries
  • Competitor Analysis with Interactive dashboard
  • Latest News, Updates & Trend analysis
Request Sample

Scope of the Report

Report Metric

Details

Market size estimation

2024–2029

Base year considered

2023

Forecast period considered

2024–2029

Units considered

Value (USD)

Segments covered

By Product Type, By Type, By Source, Industrial enzymes by application, Specialty enzymes by application, By Reaction Type and Region.

Regions covered

North America, Europe, Asia Pacific, South America and Rest of the World

Companies studied

  • BASF SE (Germany)
  • International Flavors & Fragrances Inc. (US)
  • dsm-firmenich (Switzerland)
  • Associated British Foods plc (England)
  • Novozymes A/S (Denmark)
  • Kerry Group plc. (Ireland)
  • Dyadic International Inc (US)
  • Advanced Enzyme Technologies (India)
  • Aumgene Biosciences (India)
  • Amano Enzyme Inc (Japan)
  • F. Hoffmann-La Roche Ltd (Switzerland)
  • Codexis, Inc. (US)
  • Sanofi (France)
  • Merck KGaA (Germany)
  • Adisseo (China)
  • Lesaffre Corporation (France)
  • Enzyme Solutions (US)
  • Enzymatic Deinking Technologies, LLC (US)
  • Creative Enzymes (US)
  • Tex Biosciences (P) Ltd. (India)
  • DENYKEM (UK)
  • MetGen (Finland)
  • Biovet S.A. (Spain)
  • Biocatalysts (UK)
  • Alltech (US)

Target Audience:

  • Enzyme raw material suppliers
  • Industrial enzyme manufacturers
  • Specialty enzyme manufacturers
  • Intermediate suppliers such as traders and distributors of enzymes
  • Manufacturers of food & beverages, biofuels, detergents, textile & leather, paper & pulp, wastewater treatment, feed, and others
  • Government and research organizations
  • Associations, regulatory bodies, and other industry-related bodies

Report Scope:

Enzymes Market:

Enzymes Market, By Product Type
  • Industrial Enzymes
  • Specialty Enzymes
Enzymes Market, By Source
  • Microorganisms
  • Plant
  • Animal
Enzymes Market, By Type
  • Carbohydrases
  • Proteases
  • Lipases
  • Polymerases & Nucleases
  • Other enzymes
Enzymes Market, By Reaction Type
  • Hydrolases
  • Oxidoreductases
  • Transferases
  • Lyase
  • Others
Industrial Enzymes, By Application
  • Food & Beverage
  • Bioethanol
  • Textiles & Leather
  • Detergents
  • Paper & Pulp
  • Wastewater Treatment
  • Feed
  • Soil Treatment
  • Oil Treatment
  • Other Applications
Specialty Enzymes, By Application
  • Pharmaceuticals
  • Research & Biotechnology
  • Diagnostics
  • Biocatalysts
By Region
  • North America
  • Europe
  • Asia Pacific
  • South America
  • Rest of the World (RoW)

Recent Developments

  • In January 2024, Novozymes and Chr. Hansen has completed their merger, resulting in the establishment of Novonesis. As a bio solutions partner, Novonesis aims to enhance business, promote healthier lives, and support a healthier planet. The combined expertise of the company spans over 30 different industries.
  • In December 2023, IFF and Kemira (Finland) are collaborating to commercialize renewable polymers from IFF's Designed Enzymatic Biomaterials (DEB) technology, integrating production into Chemigate Ltd’s biorefinery in Finland by mid-2024. This innovation addresses the demand for sustainable alternatives in pulp, paper, water treatment, and other markets. By expanding DEB technology, IFF will offer high-performance, sustainable materials, enhancing its enzyme industry presence and supporting a circular bioeconomy.
  • In March 2023, BASF and Cargill (Provimi) are expanding their partnership to South Korea, marking their first Asian market. This collaboration introduces Enzae Manno (Cargill), made with Natupulse TS, to South Korean animal protein producers, combining BASF's enzyme R&D strengths with Cargill's market reach. This partnership aims to enhance productivity, sustainability, and cost-efficiency in animal feed. By extending its geographic reach and launching innovative enzyme solutions.

Frequently Asked Questions (FAQ):

To speak to our analyst for a discussion on the above findings, click Speak to Analyst

TABLE OF CONTENTS
 
1 INTRODUCTION (Page No. - 53)
    1.1 STUDY OBJECTIVES 
    1.2 MARKET DEFINITION 
    1.3 STUDY SCOPE 
           FIGURE 1 MARKET SEGMENTATION
           1.3.1 REGIONS COVERED
                    FIGURE 2 ENZYMES MARKET SEGMENTATION, BY REGION
           1.3.2 YEARS CONSIDERED
                    FIGURE 3 STUDY PERIOD CONSIDERED
    1.4 CURRENCY CONSIDERED 
           TABLE 1 USD EXCHANGE RATES CONSIDERED, 2020–2023
    1.5 UNIT CONSIDERED 
    1.6 STAKEHOLDERS 
    1.7 SUMMARY OF CHANGES 
           1.7.1 RECESSION IMPACT
 
2 RESEARCH METHODOLOGY (Page No. - 58)
    2.1 RESEARCH DATA 
           FIGURE 4 ENZYMES MARKET: RESEARCH DESIGN
           2.1.1 SECONDARY DATA
                    2.1.1.1 Key data from secondary research
           2.1.2 PRIMARY DATA
                    2.1.2.1 Key data from primary sources
                    2.1.2.2 Key industry insights
                    2.1.2.3 Breakdown of primary interviews
                               FIGURE 5 BREAKDOWN OF PRIMARY INTERVIEWS: BY COMPANY TYPE, DESIGNATION, AND REGION
    2.2 FACTOR ANALYSIS 
           2.2.1 INTRODUCTION
           2.2.2 DEMAND-SIDE ANALYSIS
                    FIGURE 6 KEY ECONOMIES BASED ON GDP, 2020–2023 (USD BILLION)
           2.2.3 SUPPLY-SIDE ANALYSIS
    2.3 MARKET SIZE ESTIMATION 
           2.3.1 APPROACH ONE (BASED ON INDUSTRY AND PRODUCT TYPE, BY REGION)
                    FIGURE 7 ENZYMES MARKET: APPROACH ONE (BOTTOM-UP APPROACH)
           2.3.2 APPROACH TWO (BASED ON GLOBAL MARKET)
                    FIGURE 8 ENZYMES MARKET: TOP-DOWN APPROACH
    2.4 DATA TRIANGULATION 
           FIGURE 9 DATA TRIANGULATION METHODOLOGY
    2.5 RESEARCH ASSUMPTIONS 
    2.6 RESEARCH LIMITATIONS 
           FIGURE 10 ENZYMES MARKET: RESEARCH LIMITATIONS
    2.7 RECESSION IMPACT ANALYSIS 
           2.7.1 MACRO INDICATORS OF RECESSION
                    FIGURE 11 RECESSION INDICATORS
                    FIGURE 12 WORLD INFLATION RATE: 2013–2023
                    FIGURE 13 GLOBAL GROSS DOMESTIC PRODUCT: 2013–2023 (USD TRILLION)
                    FIGURE 14 RECESSION INDICATORS AND THEIR IMPACT ON ENZYMES MARKET
                    FIGURE 15 ENZYMES MARKET: CURRENT FORECAST VS. RECESSION FORECAST
 
3 EXECUTIVE SUMMARY (Page No. - 72)
    TABLE 2 ENZYMES MARKET SNAPSHOT, 2024 VS. 2029 
    FIGURE 16 ENZYMES MARKET, BY TYPE, 2024 VS. 2029 (USD MILLION) 
    FIGURE 17 ENZYMES MARKET, BY PRODUCT TYPE, 2024 VS. 2029 (USD MILLION) 
    FIGURE 18 ENZYMES MARKET, BY SOURCE, 2024 VS. 2029 (USD MILLION) 
    FIGURE 19 INDUSTRIAL ENZYMES MARKET, BY APPLICATION, 2024 VS. 2029 (USD MILLION) 
    FIGURE 20 SPECIALTY ENZYMES MARKET, BY APPLICATION, 2024 VS. 2029 (USD MILLION) 
    FIGURE 21 ENZYMES MARKET SHARE, BY REGION, 2023 
 
4 PREMIUM INSIGHTS (Page No. - 77)
    4.1 ATTRACTIVE OPPORTUNITIES FOR PLAYERS IN ENZYMES MARKET 
           FIGURE 22 ADVANCEMENTS IN ENZYME ENGINEERING AND TECHNOLOGICAL INNOVATIONS TO DRIVE MARKET
    4.2 ENZYMES MARKET: SHARES OF MAJOR REGIONAL SUBMARKETS 
           FIGURE 23 US ACCOUNTED FOR LARGEST MARKET SHARE IN 2023
    4.3 ASIA PACIFIC: ENZYMES MARKET, BY PRODUCT TYPE & COUNTRY 
           FIGURE 24 CHINA TO ACCOUNT FOR LARGEST MARKET SHARE IN ASIA PACIFIC IN 2024
                    4.4 INDUSTRIAL ENZYMES MARKET, BY TYPE
                               FIGURE 25 CARBOHYDRASES SEGMENT TO DOMINATE MARKET DURING FORECAST PERIOD
    4.5 SPECIALTY ENZYMES MARKET, BY TYPE 
           FIGURE 26 CARBOHYDRASES SEGMENT TO DOMINATE MARKET DURING FORECAST PERIOD
    4.6 ENZYMES MARKET, BY PRODUCT TYPE 
           FIGURE 27 INDUSTRIAL ENZYMES SEGMENT TO LEAD MARKET DURING FORECAST PERIOD
    4.7 ENZYMES MARKET, BY SOURCE 
           FIGURE 28 MICROORGANISMS SEGMENT TO DOMINATE MARKET DURING FORECAST PERIOD
 
5 MARKET OVERVIEW (Page No. - 81)
    5.1 INTRODUCTION 
    5.2 MACROECONOMIC INDICATORS 
           5.2.1 INCREASE IN RETAIL SALES
                    FIGURE 29 RETAIL AND FOOD SERVICE SALES IN US, 2018–2023 (USD BILLION)
           5.2.2 GROWTH OPPORTUNITIES IN ASIA PACIFIC AND SOUTH AMERICA
                    FIGURE 30 ANNUAL GDP GROWTH RATE IN ASIAN COUNTRIES, 2023
    5.3 MARKET DYNAMICS 
           FIGURE 31 ENZYMES MARKET: DRIVERS, RESTRAINTS, OPPORTUNITIES, AND CHALLENGES
           5.3.1 DRIVERS
                    5.3.1.1 Growing environmental concerns and increasing demand for biofuels
                               FIGURE 32 GROWING DEMAND FOR BIOFUELS (2021–2030)
                    5.3.1.2 Advancements in R&D activities for technical enzymes
                    5.3.1.3 Shift toward green energy
                               FIGURE 33 BIOETHANOL PRODUCTION WORLDWIDE, 2019–2021
                    5.3.1.4 Multifunctionalities of enzymes
                               TABLE 3 APPLICATIONS AND BENEFITS OF ENZYMES
           5.3.2 RESTRAINTS
                    5.3.2.1 Stringent regulatory framework
                    5.3.2.2 Influence of environmental factors on enzyme structure and functions
                    5.3.2.3 High cost incurred by SMEs in adapting to new technologies
           5.3.3 OPPORTUNITIES
                    5.3.3.1 Demand for alternatives to synthetic chemicals
                    5.3.3.2 Technological innovations and wide industry scope
                    5.3.3.3 Emergence of encapsulation to enhance enzyme shelf life
           5.3.4 CHALLENGES
                    5.3.4.1 High cost of raw materials
                    5.3.4.2 Concerns over enzyme quality in food & beverages and feed industries
                    5.3.4.3 Lack of transparency in patent protection laws
 
6 INDUSTRY TRENDS (Page No. - 95)
    6.1 INTRODUCTION 
    6.2 SUPPLY CHAIN ANALYSIS 
           FIGURE 34 ENZYMES MARKET: SUPPLY CHAIN ANALYSIS
    6.3 VALUE CHAIN ANALYSIS 
           FIGURE 35 ENZYMES MARKET: VALUE CHAIN ANALYSIS
    6.4 TRADE ANALYSIS 
           6.4.1 EXPORT SCENARIO OF SPECIALTY ENZYMES
                    FIGURE 36 EXPORT VALUE OF SPECIALTY ENZYMES FOR KEY COUNTRIES, 2020–2023 (USD THOUSAND)
                    TABLE 4 TOP 5 EXPORTERS OF SPECIALTY ENZYMES (HS CODE 350790), 2023 (USD THOUSAND)
           6.4.2 IMPORT SCENARIO OF SPECIALTY ENZYMES
                    FIGURE 37 IMPORT VALUE OF SPECIALTY ENZYMES FOR KEY COUNTRIES, 2020–2023 (USD THOUSAND)
                    TABLE 5 TOP 5 IMPORTERS OF SPECIALTY ENZYMES (HS CODE 350790), 2023 (USD THOUSAND)
    6.5 TECHNOLOGY ANALYSIS 
           6.5.1 KEY TECHNOLOGIES
                    6.5.1.1 Precision fermentation
                    6.5.1.2 Enzyme engineering
           6.5.2 ADJACENT TECHNOLOGIES
                    6.5.2.1 Solid-state fermentation
    6.6 PRICING ANALYSIS 
           6.6.1 AVERAGE SELLING PRICE TRENDS OF KEY PLAYERS, BY ENZYME TYPE
                    TABLE 6 AVERAGE SELLING PRICE TRENDS OF KEY PLAYERS, BY ENZYME TYPE, 2024 (USD/KG)
           6.6.2 AVERAGE SELLING PRICE TRENDS, BY PRODUCT TYPE
                    FIGURE 38 AVERAGE SELLING PRICE TRENDS, BY PRODUCT TYPE, 2022–2024 (USD/KG)
           6.6.3 AVERAGE SELLING PRICE TREND ANALYSIS
                    FIGURE 39 AVERAGE SELLING PRICE TREND OF KEY PLAYERS, BY PRODUCT TYPE (USD/KG)
                    TABLE 7 ENZYMES MARKET: AVERAGE SELLING PRICE, BY PRODUCT TYPE, 2020–2023 (USD/KG)
                    TABLE 8 AVERAGE SELLING PRICE TRENDS FOR INDUSTRIAL ENZYMES, BY REGION, 2020–2023 (USD/KG)
    6.7 ECOSYSTEM ANALYSIS/MARKET MAP 
           6.7.1 SUPPLY SIDE
           6.7.2 DEMAND SIDE
                    FIGURE 40 ENZYMES MARKET ECOSYSTEM
                    FIGURE 41 ENZYMES MARKET MAP
                    TABLE 9 ENZYMES MARKET: SUPPLY CHAIN (ECOSYSTEM)
    6.8 TRENDS/DISRUPTIONS IMPACTING CUSTOMER BUSINESS 
           FIGURE 42 TRENDS/DISRUPTIONS IMPACTING CUSTOMER BUSINESS: REVENUE SHIFT FOR FOOD ENZYMES MARKET
    6.9 PATENT ANALYSIS 
           FIGURE 43 NUMBER OF PATENTS GRANTED BETWEEN 2018 AND 2023
           FIGURE 44 TOP 10 INVESTORS WITH HIGHEST NUMBER OF PATENT DOCUMENTS
           TABLE 10 ENZYMES MARKET: LIST OF MAJOR PATENTS, 2020–2024
    6.10 KEY CONFERENCES AND EVENTS 
           TABLE 11 ENZYMES MARKET: LIST OF KEY CONFERENCES AND EVENTS, 2024–2025
    6.11 REGULATORY LANDSCAPE 
           6.11.1 REGULATORY LANDSCAPE, BY COUNTRY/REGION
                    6.11.1.1 US
                               TABLE 12 ENZYME PREPARATIONS APPROVED FOR FOOD ADDITIVES LISTED IN 21 CFR 173
                               TABLE 13 ENZYME PREPARATIONS SPECIFIED IN FOOD STANDARDS
                               TABLE 14 ENZYME PREPARATIONS AFFIRMED AS GRAS LISTED IN 21 CFR 184
                    6.11.1.2 Europe
                               TABLE 15 LIST OF PERMITTED ENZYMES IN EUROPE
                               6.11.1.2.1 EU legislation relevant to food enzymes
                    6.11.1.3 Asia Pacific
                               6.11.1.3.1 China
                               6.11.1.3.2 India
                               6.11.1.3.3 Australia & New Zealand
           6.11.2 REGULATORY BODIES, GOVERNMENT AGENCIES, AND OTHER ORGANIZATIONS
                    TABLE 16 NORTH AMERICA: LIST OF REGULATORY BODIES, GOVERNMENT AGENCIES, AND OTHER ORGANIZATIONS
                    TABLE 17 EUROPE: LIST OF REGULATORY BODIES, GOVERNMENT AGENCIES, AND OTHER ORGANIZATIONS
                    TABLE 18 ASIA PACIFIC: LIST OF REGULATORY BODIES, GOVERNMENT AGENCIES, AND OTHER ORGANIZATIONS
    6.12 PORTER’S FIVE FORCES ANALYSIS 
                    TABLE 19 ENZYMES MARKET: PORTER’S FIVE FORCES ANALYSIS
           6.12.1 INTENSITY OF COMPETITIVE RIVALRY
           6.12.2 BARGAINING POWER OF SUPPLIERS
           6.12.3 BARGAINING POWER OF BUYERS
           6.12.4 THREAT OF SUBSTITUTES
           6.12.5 THREAT OF NEW ENTRANTS
    6.13 KEY STAKEHOLDERS AND BUYING CRITERIA 
           6.13.1 KEY STAKEHOLDERS IN BUYING PROCESS
                    FIGURE 45 INFLUENCE OF STAKEHOLDERS ON BUYING PROCESS FOR ENZYME TYPES
                    TABLE 20 INFLUENCE OF STAKEHOLDERS ON BUYING PROCESS FOR ENZYME TYPES
           6.13.2 BUYING CRITERIA
                    TABLE 21 KEY BUYING CRITERIA FOR TOP 3 INDUSTRIAL ENZYME APPLICATIONS
                    FIGURE 46 KEY BUYING CRITERIA FOR TOP 3 INDUSTRIAL ENZYME APPLICATIONS
    6.14 CASE STUDY ANALYSIS 
           6.14.1 PROCESS OPTIMIZATION IN ENZYME PRODUCTION
           6.14.2 HEALTH COMPANY LAUNCHED NEW ENZYME TO AID BREWERS IN ADJUNCT BREWING
           6.14.3 CODEXIS INC (US) DEPLOYED ITS CODEEVOLVER PLATFORM TO DEVELOP A HIGHLY EFFICIENT AND STEREOSPECIFIC KETOREDUCTASE ENZYME
           6.14.4 INTERNATIONAL FLAVORS & FRAGRANCES INC. (US) LAUNCHED NEW ENZYME FOR DAIRY PRODUCTS TO REDUCE LACTOSE LEVELS AND BRING BALANCED SWEETNESS
    6.15 INVESTMENT AND FUNDING SCENARIO 
                    FIGURE 47 INVESTMENT AND FUNDING SCENARIO
 
7 ENZYMES MARKET, BY SOURCE (Page No. - 123)
    7.1 INTRODUCTION 
           FIGURE 48 ENZYMES MARKET, BY SOURCE, 2024 VS. 2029
           TABLE 22 ENZYMES MARKET, BY SOURCE, 2020–2023 (USD MILLION)
           TABLE 23 ENZYMES MARKET, BY SOURCE, 2024–2029 (USD MILLION)
    7.2 MICROORGANISM 
           7.2.1 HUGE PRODUCTION IN LESS TIME TO BOOST INDUSTRIAL USE OF MICROBIAL ENZYMES
                    TABLE 24 MICROORGANISM: ENZYMES MARKET, BY REGION, 2020–2023 (USD MILLION)
                    TABLE 25 MICROORGANISM: ENZYMES MARKET, BY REGION, 2024–2029 (USD MILLION)
    7.3 PLANT 
           7.3.1 VERSATILITY ACROSS TEMPERATURES TO DRIVE DEMAND FOR PLANT-BASED ENZYMES
                    TABLE 26 PLANT: ENZYMES MARKET, BY REGION, 2020–2023 (USD MILLION)
                    TABLE 27 PLANT: ENZYMES MARKET, BY REGION, 2024–2029 (USD MILLION)
    7.4 ANIMAL 
           7.4.1 TEMPERATURE SENSITIVITY TO DISCOURAGE INDUSTRIAL USE OF ANIMAL-BASED ENZYMES
                    TABLE 28 ANIMAL: ENZYMES MARKET, BY REGION, 2020–2023 (USD MILLION)
                    TABLE 29 ANIMAL: ENZYMES MARKET, BY REGION, 2024–2029 (USD MILLION)
 
8 ENZYMES MARKET, BY TYPE (Page No. - 130)
    8.1 INTRODUCTION 
           FIGURE 49 ENZYMES MARKET, BY TYPE, 2024 VS. 2029
           TABLE 30 ENZYMES MARKET, BY TYPE, 2020–2023 (USD MILLION)
           TABLE 31 ENZYMES MARKET, BY TYPE, 2024–2029 (USD MILLION)
           TABLE 32 CARBOHYDRASES: ENZYMES MARKET, BY SUBTYPE, 2020–2023 (USD MILLION)
           TABLE 33 CARBOHYDRASES: ENZYMES MARKET, BY SUBTYPE, 2024–2029 (USD MILLION)
    8.2 CARBOHYDRASES 
           TABLE 34 CARBOHYDRASES: ENZYMES MARKET, BY REGION, 2020–2023 (USD MILLION)
           TABLE 35 CARBOHYDRASES: ENZYMES MARKET, BY REGION, 2024–2029 (USD MILLION)
           8.2.1 AMYLASES
                    8.2.1.1 Rising demand from food & beverage and textile industries to drive market
                               TABLE 36 AMYLASES: ENZYMES MARKET, BY REGION, 2020–2023 (USD MILLION)
                               TABLE 37 AMYLASES: ENZYMES MARKET, BY REGION, 2024–2029 (USD MILLION)
           8.2.2 CELLULASES
                    8.2.2.1 Complex nature to boost demand in industrial and specialty applications
                               TABLE 38 CELLULASES: ENZYMES MARKET, BY REGION, 2020–2023 (USD MILLION)
                               TABLE 39 CELLULASES: ENZYMES MARKET, BY REGION, 2024–2029 (USD MILLION)
           8.2.3 OTHER CARBOHYDRASES
                    8.2.3.1 Stability in Enzyme Activity Drives Demand in Various Industrial Applications
                               TABLE 40 OTHER CARBOHYDRASES: ENZYMES MARKET, BY REGION, 2020–2023 (USD MILLION)
                               TABLE 41 OTHER CARBOHYDRASES: ENZYMES MARKET, BY REGION, 2024–2029 (USD MILLION)
    8.3 PROTEASES 
           8.3.1 COMPETENT CHARACTERISTICS TO HYDROLYZE PROTEINS TO BOOST INDUSTRIAL USE
                               TABLE 42 PROTEASES: ENZYMES MARKET, BY REGION, 2020–2023 (USD MILLION)
                               TABLE 43 PROTEASES: ENZYMES MARKET, BY REGION, 2024–2029 (USD MILLION)
    8.4 LIPASES 
           8.4.1 COMMERCIALIZATION OF BIOFUEL PRODUCTION FROM ENZYMATIC PROCESSES TO DRIVE MARKET
                    TABLE 44 LIPASES: ENZYMES MARKET, BY REGION, 2020–2023 (USD MILLION)
                    TABLE 45 LIPASES: ENZYMES MARKET, BY REGION, 2024–2029 (USD MILLION)
    8.5 POLYMERASES & NUCLEASES 
           8.5.1 DEMAND FOR POLYMERASES & NUCLEASES IN NUCLEIC ACID PROCESSES
                    TABLE 46 POLYMERASES & NUCLEASES: ENZYMES MARKET, BY REGION, 2020–2023 (USD MILLION)
                    TABLE 47 POLYMERASES & NUCLEASES: ENZYMES MARKET, BY REGION, 2024–2029 (USD MILLION)
    8.6 OTHER ENZYMES 
           TABLE 48 OTHER ENZYMES: ENZYMES MARKET, BY REGION, 2020–2023 (USD MILLION)
           TABLE 49 OTHER ENZYMES: ENZYMES MARKET, BY REGION, 2024–2029 (USD MILLION)
 
9 ENZYMES MARKET, BY PRODUCT TYPE (Page No. - 145)
    9.1 INTRODUCTION 
           FIGURE 50 ENZYMES MARKET, BY PRODUCT TYPE, 2024 VS. 2029 (USD MILLION)
           TABLE 50 ENZYMES MARKET, BY PRODUCT TYPE, 2020–2023 (USD MILLION)
           TABLE 51 ENZYMES MARKET, BY PRODUCT TYPE, 2024–2029 (USD MILLION)
           TABLE 52 ENZYMES MARKET, BY PRODUCT TYPE, 2020–2023 (KILOTONS)
           TABLE 53 ENZYMES MARKET, BY PRODUCT TYPE, 2024–2029 (KILOTONS)
    9.2 INDUSTRIAL ENZYMES 
           9.2.1 GROWTH IN FOOD & FEED PROCESSING INDUSTRIES TO DRIVE MARKET
                    TABLE 54 INDUSTRIAL ENZYMES AND THEIR APPLICATIONS
                    TABLE 55 INDUSTRIAL ENZYMES MARKET, BY TYPE, 2020–2023 (USD MILLION)
                    TABLE 56 INDUSTRIAL ENZYMES MARKET, BY TYPE, 2024–2029 (USD MILLION)
                    TABLE 57 INDUSTRIAL ENZYMES MARKET, BY REGION, 2020–2023 (USD MILLION)
                    TABLE 58 INDUSTRIAL ENZYMES MARKET, BY REGION, 2024–2029 (USD MILLION)
    9.3 SPECIALTY ENZYMES 
           9.3.1 RISING CLINICAL IN VITRO DIAGNOSTIC INDUSTRY TO DRIVE MARKET
                    TABLE 59 SPECIALTY ENZYMES MARKET, BY TYPE, 2020–2023 (USD MILLION)
                    TABLE 60 SPECIALTY ENZYMES MARKET, BY TYPE, 2024–2029 (USD MILLION)
                    TABLE 61 SPECIALTY ENZYMES MARKET, BY REGION, 2020–2023 (USD MILLION)
                    TABLE 62 SPECIALTY ENZYMES MARKET, BY REGION, 2024–2029 (USD MILLION)
 
10 INDUSTRIAL ENZYMES MARKET, BY APPLICATION (Page No. - 154)
     10.1 INTRODUCTION 
               FIGURE 51 INDUSTRIAL ENZYMES MARKET, BY APPLICATION, 2024 VS. 2029
               TABLE 63 INDUSTRIAL ENZYMES MARKET, BY APPLICATION, 2020–2023 (USD MILLION)
               TABLE 64 INDUSTRIAL ENZYMES MARKET, BY APPLICATION, 2024–2029 (USD MILLION)
               TABLE 65 INDUSTRIAL ENZYMES MARKET, BY APPLICATION, 2020–2023 (KILOTONS)
               TABLE 66 INDUSTRIAL ENZYMES MARKET, BY APPLICATION, 2024–2029 (KILOTONS)
               TABLE 67 INDUSTRIAL ENZYMES MARKET, BY REGION, 2020–2023 (USD MILLION)
               TABLE 68 INDUSTRIAL ENZYMES MARKET, BY REGION, 2024–2029 (USD MILLION)
     10.2 FOOD & BEVERAGES 
               TABLE 69 FOOD & BEVERAGES: INDUSTRIAL ENZYMES MARKET, BY REGION, 2020–2023 (USD MILLION)
               TABLE 70 FOOD & BEVERAGES: INDUSTRIAL ENZYMES MARKET, BY REGION, 2024–2029 (USD MILLION)
               TABLE 71 FOOD & BEVERAGES: INDUSTRIAL ENZYMES MARKET, BY SUB-APPLICATION, 2020–2023 (USD MILLION)
               TABLE 72 FOOD & BEVERAGES: INDUSTRIAL ENZYMES MARKET, BY SUB-APPLICATION, 2024–2029 (USD MILLION)
             10.2.1 MEAT PROCESSING
                       10.2.1.1 Enzymes tenderize meat through protein modification
                                   TABLE 73 MEAT PROCESSING: INDUSTRIAL ENZYMES MARKET, BY REGION, 2020–2023 (USD MILLION)
                                   TABLE 74 MEAT PROCESSING: INDUSTRIAL ENZYMES MARKET, BY REGION, 2024–2029 (USD MILLION)
             10.2.2 DAIRY PRODUCTS
                       10.2.2.1 Increasing use of enzymes for cheese production and flavoring
                                   TABLE 75 DAIRY PRODUCTS: INDUSTRIAL ENZYMES MARKET, BY REGION, 2020–2023 (USD MILLION)
                                   TABLE 76 DAIRY PRODUCTS: INDUSTRIAL ENZYMES MARKET, BY REGION, 2024–2029 (USD MILLION)
             10.2.3 BEVERAGES
                       10.2.3.1 Increasing use of enzymes to improve yield and quality
                                   TABLE 77 BEVERAGES: INDUSTRIAL ENZYMES MARKET, BY REGION, 2020–2023 (USD MILLION)
                                   TABLE 78 BEVERAGES: INDUSTRIAL ENZYMES MARKET, BY REGION, 2024–2029 (USD MILLION)
             10.2.4 BAKERY & CONFECTIONERY PRODUCTS
                       10.2.4.1 Growing use of enzymes to increase shelf-life
                                   TABLE 79 ENZYMES USED IN BAKERY PRODUCTS
                                   TABLE 80 BAKERY & CONFECTIONERY PRODUCTS: INDUSTRIAL ENZYMES MARKET, BY REGION, 2020–2023 (USD MILLION)
                                   TABLE 81 BAKERY & CONFECTIONERY PRODUCTS: INDUSTRIAL ENZYMES MARKET, BY REGION, 2024–2029 (USD MILLION)
             10.2.5 NUTRACEUTICALS
                       10.2.5.1 Use of enzymes as digestive aid to fuel demand
                                   TABLE 82 NUTRACEUTICALS: INDUSTRIAL ENZYMES MARKET, BY REGION, 2020–2023 (USD MILLION)
                                   TABLE 83 NUTRACEUTICALS: INDUSTRIAL ENZYMES MARKET, BY REGION, 2024–2029 (USD MILLION)
             10.2.6 OTHER FOOD & BEVERAGES
                       TABLE 84 OTHER FOOD & BEVERAGES: INDUSTRIAL ENZYMES MARKET, BY REGION, 2020–2023 (USD MILLION)
                       TABLE 85 OTHER FOOD & BEVERAGES: INDUSTRIAL ENZYMES MARKET, BY REGION, 2024–2029 (USD MILLION)
     10.3 BIOETHANOL 
             10.3.1 INCREASING USE OF ENZYMES AS BIOLOGICAL CATALYSTS TO DRIVE DEMAND
                       TABLE 86 BIOETHANOL: INDUSTRIAL ENZYMES MARKET, BY REGION, 2020–2023 (USD MILLION)
                       TABLE 87 BIOETHANOL: INDUSTRIAL ENZYMES MARKET, BY REGION, 2024–2029 (USD MILLION)
     10.4 TEXTILES & LEATHER 
             10.4.1 SUSTAINABILITY INITIATIVES IN TEXTILES & LEATHER TO DRIVE DEMAND
                       TABLE 88 TEXTILES & LEATHER: INDUSTRIAL ENZYMES MARKET, BY REGION, 2020–2023 (USD MILLION)
                       TABLE 89 TEXTILES & LEATHER: INDUSTRIAL ENZYMES MARKET, BY REGION, 2024–2029 (USD MILLION)
     10.5 DETERGENTS 
               TABLE 90 DETERGENTS: INDUSTRIAL ENZYMES MARKET, BY REGION, 2020–2023 (USD MILLION)
               TABLE 91 DETERGENTS: INDUSTRIAL ENZYMES MARKET, BY REGION, 2024–2029 (USD MILLION)
               TABLE 92 DETERGENTS: INDUSTRIAL ENZYMES MARKET, BY SUB-APPLICATION, 2020–2023 (USD MILLION)
               TABLE 93 DETERGENTS: INDUSTRIAL ENZYMES MARKET, BY SUB-APPLICATION, 2024–2029 (USD MILLION)
             10.5.1 LAUNDRY DETERGENTS
                       10.5.1.1 Use of enzymes associated with reduced time, energy, and water consumption
                                   TABLE 94 LAUNDRY DETERGENTS: INDUSTRIAL ENZYMES MARKET, BY REGION, 2020–2023 (USD MILLION)
                                   TABLE 95 LAUNDRY DETERGENTS: INDUSTRIAL ENZYMES MARKET, BY REGION, 2024–2029 (USD MILLION)
             10.5.2 AUTOMATIC DISHWASHING DETERGENTS
                       10.5.2.1 Use of enzymes to increase user-friendliness by lowering alkalinity
                                   TABLE 96 AUTOMATIC DISHWASHING DETERGENTS: INDUSTRIAL ENZYMES MARKET, BY REGION, 2020–2023 (USD MILLION)
                                   TABLE 97 AUTOMATIC DISHWASHING DETERGENTS: INDUSTRIAL ENZYMES MARKET, BY REGION, 2024–2029 (USD MILLION)
             10.5.3 OTHER DETERGENT TYPES
                       TABLE 98 OTHER DETERGENT TYPES: INDUSTRIAL ENZYMES MARKET, BY REGION, 2020–2023 (USD MILLION)
                       TABLE 99 OTHER DETERGENT TYPES: INDUSTRIAL ENZYMES MARKET, BY REGION, 2024–2029 (USD MILLION)
     10.6 PAPER & PULP 
             10.6.1 NEED FOR ENHANCED BLEACHING EFFICACY AND CHLORINE CONSUMPTION REDUCTION TO DRIVE DEMAND
                       TABLE 100 PAPER & PULP: INDUSTRIAL ENZYMES MARKET, BY REGION, 2020–2023 (USD MILLION)
                       TABLE 101 PAPER & PULP: INDUSTRIAL ENZYMES MARKET, BY REGION, 2024–2029 (USD MILLION)
     10.7 WASTEWATER TREATMENT 
             10.7.1 DEMAND FOR ENZYMES TO BREAK DOWN ORGANIC WASTES AND ENHANCE WATER QUALITY
                       TABLE 102 WASTEWATER TREATMENT: INDUSTRIAL ENZYMES MARKET, BY REGION, 2020–2023 (USD MILLION)
                       TABLE 103 WASTEWATER TREATMENT: INDUSTRIAL ENZYMES MARKET, BY REGION, 2024–2029 (USD MILLION)
     10.8 FEED 
               TABLE 104 FEED: INDUSTRIAL ENZYMES MARKET, BY REGION, 2020–2023 (USD MILLION)
               TABLE 105 FEED: INDUSTRIAL ENZYMES MARKET, BY REGION, 2024–2029 (USD MILLION)
               TABLE 106 FEED: INDUSTRIAL ENZYMES MARKET, BY SUB-APPLICATION, 2020–2023 (USD MILLION)
               TABLE 107 FEED: INDUSTRIAL ENZYMES MARKET, BY SUB-APPLICATION, 2024–2029 (USD MILLION)
             10.8.1 RUMINANT FEED
                       10.8.1.1 Inclusion of enzymes to improve feed efficiency ratio for beef cattle
                                   TABLE 108 RUMINANT FEED: INDUSTRIAL ENZYMES MARKET, BY REGION, 2020–2023 (USD MILLION)
                                   TABLE 109 RUMINANT FEED: INDUSTRIAL ENZYMES MARKET, BY REGION, 2024–2029 (USD MILLION)
             10.8.2 SWINE FEED
                       10.8.2.1 Use of sow feed enzymes to ensure health of piglets
                                   TABLE 110 SWINE FEED: INDUSTRIAL ENZYMES MARKET, BY REGION, 2020–2023 (USD MILLION)
                                   TABLE 111 SWINE FEED: INDUSTRIAL ENZYMES MARKET, BY REGION, 2024–2029 (USD MILLION)
             10.8.3 POULTRY FEED
                       10.8.3.1 Demand for feed enzymes to improve nutrient digestibility and improve gut performance in poultry
                                   TABLE 112 POULTRY FEED: INDUSTRIAL ENZYMES MARKET, BY REGION, 2020–2023 (USD MILLION)
                                   TABLE 113 POULTRY FEED: INDUSTRIAL ENZYMES MARKET, BY REGION, 2024–2029 (USD MILLION)
             10.8.4 AQUAFEED
                       10.8.4.1 Enzymes in fish feed promote eco-friendliness and allow for cheaper feed use
                                   TABLE 114 AQUAFEED: INDUSTRIAL ENZYMES MARKET, BY REGION, 2020–2023 (USD MILLION)
                                   TABLE 115 AQUAFEED: INDUSTRIAL ENZYMES MARKET, BY REGION, 2024–2029 (USD MILLION)
             10.8.5 OTHER FEED
                       TABLE 116 OTHER FEED: INDUSTRIAL ENZYMES MARKET, BY REGION, 2020–2023 (USD MILLION)
                       TABLE 117 OTHER FEED: INDUSTRIAL ENZYMES MARKET, BY REGION, 2024–2029 (USD MILLION)
     10.9 SOIL TREATMENT 
             10.9.1 USE OF BIO ENZYMES TO CREATE OPPORTUNITY FOR IMPROVED SOIL STABILITY
                       TABLE 118 SOIL TREATMENT: INDUSTRIAL ENZYMES MARKET, BY REGION, 2020–2023 (USD MILLION)
                       TABLE 119 SOIL TREATMENT: INDUSTRIAL ENZYMES MARKET, BY REGION, 2024–2029 (USD MILLION)
     10.10 OIL TREATMENT 
               10.10.1 NEED FOR OIL EXTRACTION EFFICIENCY TO BOOST MARKET
                                   TABLE 120 OIL TREATMENT: INDUSTRIAL ENZYMES MARKET, BY REGION, 2020–2023 (USD MILLION)
                                   TABLE 121 OIL TREATMENT: INDUSTRIAL ENZYMES MARKET, BY REGION, 2024–2029 (USD MILLION)
     10.11 OTHER APPLICATIONS 
                       TABLE 122 OTHER APPLICATIONS: INDUSTRIAL ENZYMES MARKET, BY REGION, 2020–2023 (USD MILLION)
                       TABLE 123 OTHER APPLICATIONS: INDUSTRIAL ENZYMES MARKET, BY REGION, 2024–2029 (USD MILLION)
 
11 SPECIALTY ENZYMES MARKET, BY APPLICATION (Page No. - 191)
     11.1 INTRODUCTION 
               FIGURE 52 SPECIALTY ENZYMES MARKET, BY APPLICATION, 2024 VS. 2029
               TABLE 124 SPECIALTY ENZYMES MARKET, BY APPLICATION, 2020–2023 (USD MILLION)
               TABLE 125 SPECIALTY ENZYMES MARKET, BY APPLICATION, 2024–2029 (USD MILLION)
               TABLE 126 SPECIALTY ENZYMES MARKET, BY APPLICATION, 2020–2023 (KILOTONS)
               TABLE 127 SPECIALTY ENZYMES MARKET, BY APPLICATION, 2024–2029 (KILOTONS)
     11.2 PHARMACEUTICALS 
             11.2.1 ENZYMES ACT AS ALTERNATIVES TO TRADITIONAL ANTIBIOTICS
                       TABLE 128 PHARMACEUTICALS: SPECIALTY ENZYMES MARKET, BY REGION, 2020–2023 (USD MILLION)
                       TABLE 129 PHARMACEUTICALS: SPECIALTY ENZYMES MARKET, BY REGION, 2024–2029 (USD MILLION)
     11.3 RESEARCH & BIOTECHNOLOGY 
             11.3.1 USE OF ENZYMES IN DNA SEQUENCING TO REDUCE COST OF SEQUENCING TECHNIQUES
                       TABLE 130 RESEARCH & BIOTECHNOLOGY: SPECIALTY ENZYMES MARKET, BY REGION, 2020–2023 (USD MILLION)
                       TABLE 131 RESEARCH & BIOTECHNOLOGY: SPECIALTY ENZYMES MARKET, BY REGION, 2024–2029 (USD MILLION)
     11.4 DIAGNOSTICS 
             11.4.1 GROWING INTEREST FROM PHARMACEUTICAL COMPANIES IN DEVELOPING RAPID DIAGNOSTIC TESTS TO BOOST DEMAND
                       TABLE 132 DIAGNOSTICS: SPECIALTY ENZYMES MARKET, BY REGION, 2020–2023 (USD MILLION)
                       TABLE 133 DIAGNOSTICS: SPECIALTY ENZYMES MARKET, BY REGION, 2024–2029 (USD MILLION)
     11.5 BIOCATALYSTS 
             11.5.1 BIOCATALYSIS TO DRIVE DEMAND FOR ENZYMES IN WASTE MATERIAL TREATMENT
                       TABLE 134 BIOCATALYSTS: SPECIALTY ENZYMES MARKET, BY REGION, 2020–2023 (USD MILLION)
                       TABLE 135 BIOCATALYSTS: SPECIALTY ENZYMES MARKET, BY REGION, 2024–2029 (USD MILLION)
 
12 ENZYMES MARKET, BY REACTION TYPE (Page No. - 200)
     12.1 INTRODUCTION 
     12.2 HYDROLASES 
               TABLE 136 TYPES OF HYDROLASES AND THEIR FUNCTIONS
     12.3 OXIDOREDUCTASES 
     12.4 TRANSFERASES 
     12.5 LYASES 
             12.5.1 APPLICATION AND DEMAND
     12.6 OTHER REACTION TYPES 
 
13 ENZYMES MARKET, BY REGION (Page No. - 204)
     13.1 INTRODUCTION 
               FIGURE 53 ASIA PACIFIC TO RECORD FASTEST GROWTH DURING FORECAST PERIOD
               TABLE 137 ENZYMES MARKET, BY REGION, 2020–2023 (USD MILLION)
               TABLE 138 ENZYMES MARKET, BY REGION, 2024–2029 (USD MILLION)
     13.2 NORTH AMERICA 
               FIGURE 54 NORTH AMERICA: ENZYMES MARKET SNAPSHOT
             13.2.1 NORTH AMERICA: RECESSION IMPACT ANALYSIS
                       FIGURE 55 NORTH AMERICA: INFLATION RATES, BY KEY COUNTRY, 2018–2022
                       FIGURE 56 NORTH AMERICA: RECESSION IMPACT ANALYSIS, 2023
                       TABLE 139 NORTH AMERICA: ENZYMES MARKET, BY COUNTRY, 2020–2023 (USD MILLION)
                       TABLE 140 NORTH AMERICA: ENZYMES MARKET, BY COUNTRY, 2024–2029 (USD MILLION)
                       TABLE 141 NORTH AMERICA: ENZYMES MARKET, BY PRODUCT TYPE, 2020–2023 (USD MILLION)
                       TABLE 142 NORTH AMERICA: ENZYMES MARKET, BY PRODUCT TYPE, 2024–2029 (USD MILLION)
                       TABLE 143 NORTH AMERICA: INDUSTRIAL ENZYMES MARKET, BY COUNTRY, 2020–2023 (USD MILLION)
                       TABLE 144 NORTH AMERICA: INDUSTRIAL ENZYMES MARKET, BY COUNTRY, 2024–2029 (USD MILLION)
                       TABLE 145 NORTH AMERICA: SPECIALTY ENZYMES MARKET, BY COUNTRY, 2020–2023 (USD MILLION)
                       TABLE 146 NORTH AMERICA: SPECIALTY ENZYMES MARKET, BY COUNTRY, 2024–2029 (USD MILLION)
                       TABLE 147 NORTH AMERICA: ENZYMES MARKET, BY TYPE, 2020–2023 (USD MILLION)
                       TABLE 148 NORTH AMERICA: ENZYMES MARKET, BY TYPE, 2024–2029 (USD MILLION)
                       TABLE 149 NORTH AMERICA: CARBOHYDRASE ENZYMES MARKET, BY SUBTYPE, 2020–2023 (USD MILLION)
                       TABLE 150 NORTH AMERICA: CARBOHYDRASE ENZYMES MARKET, BY SUBTYPE, 2024–2029 (USD MILLION)
                       TABLE 151 NORTH AMERICA: ENZYMES MARKET, BY SOURCE, 2020–2023 (USD MILLION)
                       TABLE 152 NORTH AMERICA: ENZYMES MARKET, BY SOURCE, 2024–2029 (USD MILLION)
                       TABLE 153 NORTH AMERICA: INDUSTRIAL ENZYMES MARKET, BY APPLICATION, 2020–2023 (USD MILLION)
                       TABLE 154 NORTH AMERICA: INDUSTRIAL ENZYMES MARKET, BY APPLICATION, 2024–2029 (USD MILLION)
                       TABLE 155 NORTH AMERICA: FOOD & BEVERAGE INDUSTRIAL ENZYMES MARKET, BY SUB-APPLICATION, 2020–2023 (USD MILLION)
                       TABLE 156 NORTH AMERICA: FOOD & BEVERAGE INDUSTRIAL ENZYMES MARKET, BY SUB-APPLICATION, 2024–2029 (USD MILLION)
                       TABLE 157 NORTH AMERICA: DETERGENT INDUSTRIAL ENZYMES MARKET, BY SUB-APPLICATION, 2020–2023 (USD MILLION)
                       TABLE 158 NORTH AMERICA: DETERGENT INDUSTRIAL ENZYMES MARKET, BY SUB-APPLICATION, 2024–2029 (USD MILLION)
                       TABLE 159 NORTH AMERICA: FEED INDUSTRIAL ENZYMES MARKET, BY SUB-APPLICATION, 2020–2023 (USD MILLION)
                       TABLE 160 NORTH AMERICA: FEED INDUSTRIAL ENZYMES MARKET, BY SUB-APPLICATION, 2024–2029 (USD MILLION)
                       TABLE 161 NORTH AMERICA: SPECIALTY ENZYMES MARKET, BY APPLICATION, 2020–2023 (USD MILLION)
                       TABLE 162 NORTH AMERICA: SPECIALTY ENZYMES MARKET, BY APPLICATION, 2024–2029 (USD MILLION)
             13.2.2 US
                       13.2.2.1 Increased production of bioethanol to drive market
                                   TABLE 163 US: INDUSTRIAL ENZYMES MARKET, BY APPLICATION, 2020–2023 (USD MILLION)
                                   TABLE 164 US: INDUSTRIAL ENZYMES MARKET, BY APPLICATION, 2024–2029 (USD MILLION)
                                   TABLE 165 US: SPECIALTY ENZYMES MARKET, BY APPLICATION, 2020–2023 (USD MILLION)
                                   TABLE 166 US: SPECIALTY ENZYMES MARKET, BY APPLICATION, 2024–2029 (USD MILLION)
             13.2.3 CANADA
                       13.2.3.1 Increasing use of enzymes as meat tenderizers and feed additives to drive market
                                   TABLE 167 CANADA: INDUSTRIAL ENZYMES MARKET, BY APPLICATION, 2020–2023 (USD MILLION)
                                   TABLE 168 CANADA: INDUSTRIAL ENZYMES MARKET, BY APPLICATION, 2024–2029 (USD MILLION)
                                   TABLE 169 CANADA: SPECIALTY ENZYMES MARKET, BY APPLICATION, 2020–2023 (USD MILLION)
                                   TABLE 170 CANADA: SPECIALTY ENZYMES MARKET, BY APPLICATION, 2024–2029 (USD MILLION)
             13.2.4 MEXICO
                       13.2.4.1 Rise of textile industry to drive market
                                   TABLE 171 MEXICO: INDUSTRIAL ENZYMES MARKET, BY APPLICATION, 2020–2023 (USD MILLION)
                                   TABLE 172 MEXICO: INDUSTRIAL ENZYMES MARKET, BY APPLICATION, 2024–2029 (USD MILLION)
                                   TABLE 173 MEXICO: SPECIALTY ENZYMES MARKET, BY APPLICATION, 2020–2023 (USD MILLION)
                                   TABLE 174 MEXICO: SPECIALTY ENZYMES MARKET, BY APPLICATION, 2024–2029 (USD MILLION)
     13.3 EUROPE 
             13.3.1 EUROPE: RECESSION IMPACT ANALYSIS
                       FIGURE 57 EUROPE: INFLATION RATES, BY KEY COUNTRY, 2018–2022
                       FIGURE 58 EUROPE: RECESSION IMPACT ANALYSIS, 2023
                       TABLE 175 EUROPE: ENZYMES MARKET, BY COUNTRY, 2020–2023 (USD MILLION)
                       TABLE 176 EUROPE: ENZYMES MARKET, BY COUNTRY, 2024–2029 (USD MILLION)
                       TABLE 177 EUROPE: INDUSTRIAL ENZYMES MARKET, BY COUNTRY, 2020–2023 (USD MILLION)
                       TABLE 178 EUROPE: INDUSTRIAL ENZYMES MARKET, BY COUNTRY, 2024–2029 (USD MILLION)
                       TABLE 179 EUROPE: SPECIALTY ENZYMES MARKET, BY COUNTRY, 2020–2023 (USD MILLION)
                       TABLE 180 EUROPE: SPECIALTY ENZYMES MARKET, BY COUNTRY, 2024–2029 (USD MILLION)
                       TABLE 181 EUROPE: ENZYMES MARKET, BY PRODUCT TYPE, 2020–2023 (USD MILLION)
                       TABLE 182 EUROPE: ENZYMES MARKET, BY PRODUCT TYPE, 2024–2029 (USD MILLION)
                       TABLE 183 EUROPE: ENZYMES MARKET, BY TYPE, 2020–2023 (USD MILLION)
                       TABLE 184 EUROPE: ENZYMES MARKET, BY TYPE, 2024–2029 (USD MILLION)
                       TABLE 185 EUROPE: CARBOHYDRASE ENZYMES MARKET, BY SUBTYPE, 2020–2023 (USD MILLION)
                       TABLE 186 EUROPE: CARBOHYDRASE ENZYMES MARKET, BY SUBTYPE, 2024–2029 (USD MILLION)
                       TABLE 187 EUROPE: ENZYMES MARKET, BY SOURCE, 2020–2023 (USD MILLION)
                       TABLE 188 EUROPE: ENZYMES MARKET, BY SOURCE, 2024–2029 (USD MILLION)
                       TABLE 189 EUROPE: INDUSTRIAL ENZYMES MARKET, BY APPLICATION, 2020–2023 (USD MILLION)
                       TABLE 190 EUROPE: INDUSTRIAL ENZYMES MARKET, BY APPLICATION, 2024–2029 (USD MILLION)
                       TABLE 191 EUROPE: FOOD & BEVERAGE INDUSTRIAL ENZYMES MARKET, BY SUB-APPLICATION, 2020–2023 (USD MILLION)
                       TABLE 192 EUROPE: FOOD & BEVERAGE INDUSTRIAL ENZYMES MARKET, BY SUB-APPLICATION, 2024–2029 (USD MILLION)
                       TABLE 193 EUROPE: DETERGENT INDUSTRIAL ENZYMES MARKET, BY SUB-APPLICATION, 2020–2023 (USD MILLION)
                       TABLE 194 EUROPE: DETERGENT INDUSTRIAL ENZYMES MARKET, BY SUB-APPLICATION, 2024–2029 (USD MILLION)
                       TABLE 195 EUROPE: FEED INDUSTRIAL ENZYMES MARKET, BY SUB-APPLICATION, 2020–2023 (USD MILLION)
                       TABLE 196 EUROPE: FEED INDUSTRIAL ENZYMES MARKET, BY SUB-APPLICATION, 2024–2029 (USD MILLION)
                       TABLE 197 EUROPE: SPECIALTY ENZYMES MARKET, BY APPLICATION, 2020–2023 (USD MILLION)
                       TABLE 198 EUROPE: SPECIALTY ENZYMES MARKET, BY APPLICATION, 2024–2029 (USD MILLION)
             13.3.2 ITALY
                       13.3.2.1 Multifunctionality of enzymes in various application sectors to fuel demand
                                   TABLE 199 ITALY: INDUSTRIAL ENZYMES MARKET, BY APPLICATION, 2020–2023 (USD MILLION)
                                   TABLE 200 ITALY: INDUSTRIAL ENZYMES MARKET, BY APPLICATION, 2024–2029 (USD MILLION)
                                   TABLE 201 ITALY: SPECIALTY ENZYMES MARKET, BY APPLICATION, 2020–2023 (USD MILLION)
                                   TABLE 202 ITALY: SPECIALTY ENZYMES MARKET, BY APPLICATION, 2024–2029 (USD MILLION)
             13.3.3 GERMANY
                       13.3.3.1 Rising biofuel consumption for transportation to drive market
                                   TABLE 203 GERMANY: INDUSTRIAL ENZYMES MARKET, BY APPLICATION, 2020–2023 (USD MILLION)
                                   TABLE 204 GERMANY: INDUSTRIAL ENZYMES MARKET, BY APPLICATION, 2024–2029 (USD MILLION)
                                   TABLE 205 GERMANY: SPECIALTY ENZYMES MARKET, BY APPLICATION, 2020–2023 (USD MILLION)
                                   TABLE 206 GERMANY: SPECIALTY ENZYMES MARKET, BY APPLICATION, 2024–2029 (USD MILLION)
             13.3.4 FRANCE
                       13.3.4.1 Government investments for technological advancements in biofuel production to drive market
                                   TABLE 207 FRANCE: INDUSTRIAL ENZYMES MARKET, BY APPLICATION, 2020–2023 (USD MILLION)
                                   TABLE 208 FRANCE: INDUSTRIAL ENZYMES MARKET, BY APPLICATION, 2024–2029 (USD MILLION)
                                   TABLE 209 FRANCE: SPECIALTY ENZYMES MARKET, BY APPLICATION, 2020–2023 (USD MILLION)
                                   TABLE 210 FRANCE: SPECIALTY ENZYMES MARKET, BY APPLICATION, 2024–2029 (USD MILLION)
             13.3.5 SPAIN
                       13.3.5.1 Rising demand for meat and meat products to drive market
                                   TABLE 211 SPAIN: INDUSTRIAL ENZYMES MARKET, BY APPLICATION, 2020–2023 (USD MILLION)
                                   TABLE 212 SPAIN: INDUSTRIAL ENZYMES MARKET, BY APPLICATION, 2024–2029 (USD MILLION)
                                   TABLE 213 SPAIN: SPECIALTY ENZYMES MARKET, BY APPLICATION, 2020–2023 (USD MILLION)
                                   TABLE 214 SPAIN: SPECIALTY ENZYMES MARKET, BY APPLICATION, 2024–2029 (USD MILLION)
             13.3.6 UK
                       13.3.6.1 Government initiatives to reduce carbon emissions and produce fuel from renewable sources to boost market
                                   TABLE 215 UK: INDUSTRIAL ENZYMES MARKET, BY APPLICATION, 2020–2023 (USD MILLION)
                                   TABLE 216 UK: INDUSTRIAL ENZYMES MARKET, BY APPLICATION, 2024–2029 (USD MILLION)
                                   TABLE 217 UK: SPECIALTY ENZYMES MARKET, BY APPLICATION, 2020–2023 (USD MILLION)
                                   TABLE 218 UK: SPECIALTY ENZYMES MARKET, BY APPLICATION, 2024–2029 (USD MILLION)
             13.3.7 DENMARK
                       13.3.7.1 Growing exports of enzymes to drive market
                                   TABLE 219 DENMARK: INDUSTRIAL ENZYMES MARKET, BY APPLICATION, 2020–2023 (USD MILLION)
                                   TABLE 220 DENMARK: INDUSTRIAL ENZYMES MARKET, BY APPLICATION, 2024–2029 (USD MILLION)
                                   TABLE 221 DENMARK: SPECIALTY ENZYMES MARKET, BY APPLICATION, 2020–2023 (USD MILLION)
                                   TABLE 222 DENMARK: SPECIALTY ENZYMES MARKET, BY APPLICATION, 2024–2029 (USD MILLION)
             13.3.8 NETHERLANDS
                       13.3.8.1 Rising demand for processed food to drive market
                                   TABLE 223 NETHERLANDS: INDUSTRIAL ENZYMES MARKET, BY APPLICATION, 2020–2023 (USD MILLION)
                                   TABLE 224 NETHERLANDS: INDUSTRIAL ENZYMES MARKET, BY APPLICATION, 2024–2029 (USD MILLION)
                                   TABLE 225 NETHERLANDS: SPECIALTY ENZYMES MARKET, BY APPLICATION, 2020–2023 (USD MILLION)
                                   TABLE 226 NETHERLANDS: SPECIALTY ENZYMES MARKET, BY APPLICATION, 2024–2029 (USD MILLION)
             13.3.9 REST OF EUROPE
                       TABLE 227 REST OF EUROPE: INDUSTRIAL ENZYMES MARKET, BY APPLICATION, 2020–2023 (USD MILLION)
                       TABLE 228 REST OF EUROPE: INDUSTRIAL ENZYMES MARKET, BY APPLICATION, 2024–2029 (USD MILLION)
                       TABLE 229 REST OF EUROPE: SPECIALTY ENZYMES MARKET, BY APPLICATION, 2020–2023 (USD MILLION)
                       TABLE 230 REST OF EUROPE: SPECIALTY ENZYMES MARKET, BY APPLICATION, 2024–2029 (USD MILLION)
     13.4 ASIA PACIFIC 
               FIGURE 59 ASIA PACIFIC: ENZYMES MARKET SNAPSHOT
             13.4.1 ASIA PACIFIC: RECESSION IMPACT ANALYSIS
                       FIGURE 60 ASIA PACIFIC: INFLATION RATES, BY KEY COUNTRY, 2018–2022
                       FIGURE 61 ASIA PACIFIC: RECESSION IMPACT ANALYSIS, 2023
                       TABLE 231 ASIA PACIFIC: ENZYMES MARKET, BY COUNTRY, 2020–2023 (USD MILLION)
                       TABLE 232 ASIA PACIFIC: ENZYMES MARKET, BY COUNTRY, 2024–2029 (USD MILLION)
                       TABLE 233 ASIA PACIFIC: INDUSTRIAL ENZYMES MARKET, BY COUNTRY, 2020–2023 (USD MILLION)
                       TABLE 234 ASIA PACIFIC: INDUSTRIAL ENZYMES MARKET, BY COUNTRY, 2024–2029 (USD MILLION)
                       TABLE 235 ASIA PACIFIC: SPECIALTY ENZYMES MARKET, BY COUNTRY, 2020–2023 (USD MILLION)
                       TABLE 236 ASIA PACIFIC: SPECIALTY ENZYMES MARKET, BY COUNTRY, 2024–2029 (USD MILLION)
                       TABLE 237 ASIA PACIFIC: ENZYMES MARKET, BY PRODUCT TYPE, 2020–2023 (USD MILLION)
                       TABLE 238 ASIA PACIFIC: ENZYMES MARKET, BY PRODUCT TYPE, 2024–2029 (USD MILLION)
                       TABLE 239 ASIA PACIFIC: ENZYMES MARKET, BY TYPE, 2020–2023 (USD MILLION)
                       TABLE 240 ASIA PACIFIC: ENZYMES MARKET, BY TYPE, 2024–2029 (USD MILLION)
                       TABLE 241 ASIA PACIFIC: CARBOHYDRASE ENZYMES MARKET, BY SUBTYPE, 2020–2023 (USD MILLION)
                       TABLE 242 ASIA PACIFIC: CARBOHYDRASE ENZYMES MARKET, BY SUBTYPE, 2024–2029 (USD MILLION)
                       TABLE 243 ASIA PACIFIC: ENZYMES MARKET, BY SOURCE, 2020–2023 (USD MILLION)
                       TABLE 244 ASIA PACIFIC: ENZYMES MARKET, BY SOURCE, 2024–2029 (USD MILLION)
                       TABLE 245 ASIA PACIFIC: INDUSTRIAL ENZYMES MARKET, BY APPLICATION, 2020–2023 (USD MILLION)
                       TABLE 246 ASIA PACIFIC: INDUSTRIAL ENZYMES MARKET, BY APPLICATION, 2024–2029 (USD MILLION)
                       TABLE 247 ASIA PACIFIC: FOOD & BEVERAGE INDUSTRIAL ENZYMES MARKET, BY SUB-APPLICATION, 2020–2023 (USD MILLION)
                       TABLE 248 ASIA PACIFIC: FOOD & BEVERAGE INDUSTRIAL ENZYMES MARKET, BY SUB-APPLICATION, 2024–2029 (USD MILLION)
                       TABLE 249 ASIA PACIFIC: DETERGENT INDUSTRIAL ENZYMES MARKET, BY SUB-APPLICATION, 2020–2023 (USD MILLION)
                       TABLE 250 ASIA PACIFIC: DETERGENT INDUSTRIAL ENZYMES MARKET, BY SUB-APPLICATION, 2024–2029 (USD MILLION)
                       TABLE 251 ASIA PACIFIC: FEED INDUSTRIAL ENZYMES MARKET, BY SUB-APPLICATION, 2020–2023 (USD MILLION)
                       TABLE 252 ASIA PACIFIC: FEED INDUSTRIAL ENZYMES MARKET, BY SUB-APPLICATION, 2024–2029 (USD MILLION)
                       TABLE 253 ASIA PACIFIC: SPECIALTY ENZYMES MARKET, BY APPLICATION, 2020–2023 (USD MILLION)
                       TABLE 254 ASIA PACIFIC: SPECIALTY ENZYMES MARKET, BY APPLICATION, 2024–2029 (USD MILLION)
             13.4.2 CHINA
                       13.4.2.1 Shift of manufacturing operations from Europe and North America to China to drive market
                                   TABLE 255 CHINA: INDUSTRIAL ENZYMES MARKET, BY APPLICATION, 2020–2023 (USD MILLION)
                                   TABLE 256 CHINA: INDUSTRIAL ENZYMES MARKET, BY APPLICATION, 2024–2029 (USD MILLION)
                                   TABLE 257 CHINA: SPECIALTY ENZYMES MARKET, BY APPLICATION, 2020–2023 (USD MILLION)
                                   TABLE 258 CHINA: SPECIALTY ENZYMES MARKET, BY APPLICATION, 2024–2029 (USD MILLION)
             13.4.3 INDIA
                       13.4.3.1 Rising trend of industrialization in animal husbandry to drive demand for feed enzymes
                                   TABLE 259 INDIA: INDUSTRIAL ENZYMES MARKET, BY APPLICATION, 2020–2023 (USD MILLION)
                                   TABLE 260 INDIA: INDUSTRIAL ENZYMES MARKET, BY APPLICATION, 2024–2029 (USD MILLION)
                                   TABLE 261 INDIA: SPECIALTY ENZYMES MARKET, BY APPLICATION, 2020–2023 (USD MILLION)
                                   TABLE 262 INDIA: SPECIALTY ENZYMES MARKET, BY APPLICATION, 2024–2029 (USD MILLION)
             13.4.4 JAPAN
                       13.4.4.1 Focus on expanding apparel & home textile chemical businesses to drive market
                                   TABLE 263 JAPAN: INDUSTRIAL ENZYMES MARKET, BY APPLICATION, 2020–2023 (USD MILLION)
                                   TABLE 264 JAPAN: INDUSTRIAL ENZYMES MARKET, BY APPLICATION, 2024–2029 (USD MILLION)
                                   TABLE 265 JAPAN: SPECIALTY ENZYMES MARKET, BY APPLICATION, 2020–2023 (USD MILLION)
                                   TABLE 266 JAPAN: SPECIALTY ENZYMES MARKET, BY APPLICATION, 2024–2029 (USD MILLION)
             13.4.5 SOUTH KOREA
                       13.4.5.1 Increased application of naturally derived enzymes in skin care products to drive market
                                   TABLE 267 SOUTH KOREA: INDUSTRIAL ENZYMES MARKET, BY APPLICATION, 2020–2023 (USD MILLION)
                                   TABLE 268 SOUTH KOREA: INDUSTRIAL ENZYMES MARKET, BY APPLICATION, 2024–2029 (USD MILLION)
                                   TABLE 269 SOUTH KOREA: SPECIALTY ENZYMES MARKET, BY APPLICATION, 2020–2023 (USD MILLION)
                                   TABLE 270 SOUTH KOREA: SPECIALTY ENZYMES MARKET, BY APPLICATION, 2024–2029 (USD MILLION)
             13.4.6 AUSTRALIA & NEW ZEALAND
                       13.4.6.1 Government initiatives and policies on ethanol biofuel production and use to drive market
                                   TABLE 271 AUSTRALIA & NEW ZEALAND: INDUSTRIAL ENZYMES MARKET, BY APPLICATION, 2020–2023 (USD MILLION)
                                   TABLE 272 AUSTRALIA & NEW ZEALAND: INDUSTRIAL ENZYMES MARKET, BY APPLICATION, 2024–2029 (USD MILLION)
                                   TABLE 273 AUSTRALIA & NEW ZEALAND: SPECIALTY ENZYMES MARKET, BY APPLICATION, 2020–2023 (USD MILLION)
                                   TABLE 274 AUSTRALIA & NEW ZEALAND: SPECIALTY ENZYMES MARKET, BY APPLICATION, 2024–2029 (USD MILLION)
             13.4.7 REST OF ASIA PACIFIC
                       TABLE 275 REST OF ASIA PACIFIC: INDUSTRIAL ENZYMES MARKET, BY APPLICATION, 2020–2023 (USD MILLION)
                       TABLE 276 REST OF ASIA PACIFIC: INDUSTRIAL ENZYMES MARKET, BY APPLICATION, 2024–2029 (USD MILLION)
                       TABLE 277 REST OF ASIA PACIFIC: SPECIALTY ENZYMES MARKET, BY APPLICATION, 2020–2023 (USD MILLION)
                       TABLE 278 REST OF ASIA PACIFIC: SPECIALTY ENZYMES MARKET, BY APPLICATION, 2024–2029 (USD MILLION)
     13.5 SOUTH AMERICA 
             13.5.1 SOUTH AMERICA: RECESSION IMPACT ANALYSIS
                       FIGURE 62 SOUTH AMERICA: INFLATION RATES, BY KEY COUNTRY, 2017–2022
                       FIGURE 63 SOUTH AMERICA: RECESSION IMPACT ANALYSIS, 2023
                       TABLE 279 SOUTH AMERICA: ENZYMES MARKET, BY COUNTRY, 2020–2023 (USD MILLION)
                       TABLE 280 SOUTH AMERICA: ENZYMES MARKET, BY COUNTRY, 2024–2029 (USD MILLION)
                       TABLE 281 SOUTH AMERICA: INDUSTRIAL ENZYMES MARKET, BY COUNTRY, 2020–2023 (USD MILLION)
                       TABLE 282 SOUTH AMERICA: INDUSTRIAL ENZYMES MARKET, BY COUNTRY, 2024–2029 (USD MILLION)
                       TABLE 283 SOUTH AMERICA: SPECIALTY ENZYMES MARKET, BY COUNTRY, 2020–2023 (USD MILLION)
                       TABLE 284 SOUTH AMERICA: SPECIALTY ENZYMES MARKET, BY COUNTRY, 2024–2029 (USD MILLION)
                       TABLE 285 SOUTH AMERICA: ENZYMES MARKET, BY PRODUCT TYPE, 2020–2023 (USD MILLION)
                       TABLE 286 SOUTH AMERICA: ENZYMES MARKET, BY PRODUCT TYPE, 2024–2029 (USD MILLION)
                       TABLE 287 SOUTH AMERICA: ENZYMES MARKET, BY TYPE, 2020–2023 (USD MILLION)
                       TABLE 288 SOUTH AMERICA: ENZYMES MARKET, BY TYPE, 2024–2029 (USD MILLION)
                       TABLE 289 SOUTH AMERICA: CARBOHYDRASE ENZYMES MARKET, BY SUBTYPE, 2020–2023 (USD MILLION)
                       TABLE 290 SOUTH AMERICA: CARBOHYDRASE ENZYMES MARKET, BY SUBTYPE, 2024–2029 (USD MILLION)
                       TABLE 291 SOUTH AMERICA: ENZYMES MARKET, BY SOURCE, 2020–2023 (USD MILLION)
                       TABLE 292 SOUTH AMERICA: ENZYMES MARKET, BY SOURCE, 2024–2029 (USD MILLION)
                       TABLE 293 SOUTH AMERICA: INDUSTRIAL ENZYMES MARKET, BY APPLICATION, 2020–2023 (USD MILLION)
                       TABLE 294 SOUTH AMERICA: INDUSTRIAL ENZYMES MARKET, BY APPLICATION, 2024–2029 (USD MILLION)
                       TABLE 295 SOUTH AMERICA: FOOD & BEVERAGE INDUSTRIAL ENZYMES MARKET, BY SUB-APPLICATION, 2020–2023 (USD MILLION)
                       TABLE 296 SOUTH AMERICA: FOOD & BEVERAGE INDUSTRIAL ENZYMES MARKET, BY SUB-APPLICATION, 2024–2029 (USD MILLION)
                       TABLE 297 SOUTH AMERICA: DETERGENT INDUSTRIAL ENZYMES MARKET, BY SUB-APPLICATION, 2020–2023 (USD MILLION)
                       TABLE 298 SOUTH AMERICA: DETERGENT INDUSTRIAL ENZYMES MARKET, BY SUB-APPLICATION, 2024–2029 (USD MILLION)
                       TABLE 299 SOUTH AMERICA: FEED INDUSTRIAL ENZYMES MARKET, BY SUB-APPLICATION, 2020–2023 (USD MILLION)
                       TABLE 300 SOUTH AMERICA: FEED INDUSTRIAL ENZYMES MARKET, BY SUB-APPLICATION, 2024–2029 (USD MILLION)
                       TABLE 301 SOUTH AMERICA: SPECIALTY ENZYMES MARKET, BY APPLICATION, 2020–2023 (USD MILLION)
                       TABLE 302 SOUTH AMERICA: SPECIALTY ENZYMES MARKET, BY APPLICATION, 2024–2029 (USD MILLION)
             13.5.2 BRAZIL
                       13.5.2.1 Growing research and advancement in starch processing technology to reduce cost to boost market
                                   TABLE 303 BRAZIL: INDUSTRIAL ENZYMES MARKET, BY APPLICATION, 2020–2023 (USD MILLION)
                                   TABLE 304 BRAZIL: INDUSTRIAL ENZYMES MARKET, BY APPLICATION, 2024–2029 (USD MILLION)
                                   TABLE 305 BRAZIL: SPECIALTY ENZYMES MARKET, BY APPLICATION, 2020–2023 (USD MILLION)
                                   TABLE 306 BRAZIL: SPECIALTY ENZYMES MARKET, BY APPLICATION, 2024–2029 (USD MILLION)
             13.5.3 ARGENTINA
                       13.5.3.1 Increasing use of starch processing and advancements in meat processing and dairy industries to drive market
                                   TABLE 307 ARGENTINA: INDUSTRIAL ENZYMES MARKET, BY APPLICATION, 2020–2023 (USD MILLION)
                                   TABLE 308 ARGENTINA: INDUSTRIAL ENZYMES MARKET, BY APPLICATION, 2024–2029 (USD MILLION)
                                   TABLE 309 ARGENTINA: SPECIALTY ENZYMES MARKET, BY APPLICATION, 2020–2023 (USD MILLION)
                                   TABLE 310 ARGENTINA: SPECIALTY ENZYMES MARKET, BY APPLICATION, 2024–2029 (USD MILLION)
             13.5.4 REST OF SOUTH AMERICA
                       TABLE 311 REST OF SOUTH AMERICA: INDUSTRIAL ENZYMES MARKET, BY APPLICATION, 2020–2023 (USD MILLION)
                       TABLE 312 REST OF SOUTH AMERICA: INDUSTRIAL ENZYMES MARKET, BY APPLICATION, 2024–2029 (USD MILLION)
                       TABLE 313 REST OF SOUTH AMERICA: SPECIALTY ENZYMES MARKET, BY APPLICATION, 2020–2023 (USD MILLION)
                       TABLE 314 REST OF SOUTH AMERICA: SPECIALTY ENZYMES MARKET, BY APPLICATION, 2024–2029 (USD MILLION)
     13.6 REST OF THE WORLD 
             13.6.1 REST OF THE WORLD: RECESSION IMPACT ANALYSIS
                       FIGURE 64 REST OF THE WORLD: INFLATION RATES, BY KEY COUNTRY, 2017–2022
                       FIGURE 65 REST OF THE WORLD: RECESSION IMPACT ANALYSIS, 2023
                       TABLE 315 REST OF THE WORLD: ENZYMES MARKET, BY COUNTRY, 2020–2023 (USD MILLION)
                       TABLE 316 REST OF THE WORLD: ENZYMES MARKET, BY COUNTRY, 2024–2029 (USD MILLION)
                       TABLE 317 REST OF THE WORLD: INDUSTRIAL ENZYMES MARKET, BY COUNTRY, 2020–2023 (USD MILLION)
                       TABLE 318 REST OF THE WORLD: INDUSTRIAL ENZYMES MARKET, BY COUNTRY, 2024–2029 (USD MILLION)
                       TABLE 319 REST OF THE WORLD: SPECIALTY ENZYMES MARKET, BY COUNTRY, 2020–2023 (USD MILLION)
                       TABLE 320 REST OF THE WORLD: SPECIALTY ENZYMES MARKET, BY COUNTRY, 2024–2029 (USD MILLION)
                       TABLE 321 REST OF THE WORLD: ENZYMES MARKET, BY PRODUCT TYPE, 2020–2023 (USD MILLION)
                       TABLE 322 REST OF THE WORLD: ENZYMES MARKET, BY PRODUCT TYPE, 2024–2029 (USD MILLION)
                       TABLE 323 REST OF THE WORLD: ENZYMES MARKET, BY TYPE, 2020–2023 (USD MILLION)
                       TABLE 324 REST OF THE WORLD: ENZYMES MARKET, BY TYPE, 2024–2029 (USD MILLION)
                       TABLE 325 REST OF THE WORLD: CARBOHYDRASE ENZYMES MARKET, BY SUBTYPE, 2020–2023 (USD MILLION)
                       TABLE 326 REST OF THE WORLD: CARBOHYDRASE ENZYMES MARKET, BY SUBTYPE, 2024–2029 (USD MILLION)
                       TABLE 327 REST OF THE WORLD: ENZYMES MARKET, BY SOURCE, 2020–2023 (USD MILLION)
                       TABLE 328 REST OF THE WORLD: ENZYMES MARKET, BY SOURCE, 2024–2029 (USD MILLION)
                       TABLE 329 REST OF THE WORLD: INDUSTRIAL ENZYMES MARKET, BY APPLICATION, 2020–2023 (USD MILLION)
                       TABLE 330 REST OF THE WORLD: INDUSTRIAL ENZYMES MARKET, BY APPLICATION, 2024–2029 (USD MILLION)
                       TABLE 331 REST OF THE WORLD: FOOD & BEVERAGE INDUSTRIAL ENZYMES MARKET, BY SUB-APPLICATION, 2020–2023 (USD MILLION)
                       TABLE 332 REST OF THE WORLD: FOOD & BEVERAGE INDUSTRIAL ENZYMES MARKET, BY SUB-APPLICATION, 2024–2029 (USD MILLION)
                       TABLE 333 REST OF THE WORLD: DETERGENT INDUSTRIAL ENZYMES MARKET, BY SUB-APPLICATION, 2020–2023 (USD MILLION)
                       TABLE 334 REST OF THE WORLD: DETERGENT INDUSTRIAL ENZYMES MARKET, BY SUB-APPLICATION, 2024–2029 (USD MILLION)
                       TABLE 335 REST OF THE WORLD: FEED INDUSTRIAL ENZYMES MARKET, BY SUB-APPLICATION, 2020–2023 (USD MILLION)
                       TABLE 336 REST OF THE WORLD: FEED INDUSTRIAL ENZYMES MARKET, BY SUB-APPLICATION, 2024–2029 (USD MILLION)
                       TABLE 337 REST OF THE WORLD: SPECIALTY ENZYMES MARKET, BY APPLICATION, 2020–2023 (USD MILLION)
                       TABLE 338 REST OF THE WORLD: SPECIALTY ENZYMES MARKET, BY APPLICATION, 2024–2029 (USD MILLION)
             13.6.2 MIDDLE EAST
                       13.6.2.1 Growing demand for food enzymes to prevent and recycle food waste to drive market
                                   TABLE 339 MIDDLE EAST: INDUSTRIAL ENZYMES MARKET, BY APPLICATION, 2020–2023 (USD MILLION)
                                   TABLE 340 MIDDLE EAST: INDUSTRIAL ENZYMES MARKET, BY APPLICATION, 2024–2029 (USD MILLION)
                                   TABLE 341 MIDDLE EAST: SPECIALTY ENZYMES MARKET, BY APPLICATION, 2020–2023 (USD MILLION)
                                   TABLE 342 MIDDLE EAST: SPECIALTY ENZYMES MARKET, BY APPLICATION, 2024–2029 (USD MILLION)
             13.6.3 AFRICA
                       13.6.3.1 Approval of Biofuels Regulatory Framework and growth of paper and pulp industry to drive market
                                   TABLE 343 AFRICA: INDUSTRIAL ENZYMES MARKET, BY APPLICATION, 2020–2023 (USD MILLION)
                                   TABLE 344 AFRICA: INDUSTRIAL ENZYMES MARKET, BY APPLICATION, 2024–2029 (USD MILLION)
                                   TABLE 345 AFRICA: SPECIALTY ENZYMES MARKET, BY APPLICATION, 2020–2023 (USD MILLION)
                                   TABLE 346 AFRICA: SPECIALTY ENZYMES MARKET, BY APPLICATION, 2024–2029 (USD MILLION)
 
14 COMPETITIVE LANDSCAPE (Page No. - 305)
     14.1 OVERVIEW 
     14.2 KEY PLAYER STRATEGIES/RIGHT TO WIN 
               TABLE 347 STRATEGIES ADOPTED BY KEY PLAYERS IN ENZYMES MARKET
     14.3 REVENUE ANALYSIS 
               FIGURE 66 REVENUE ANALYSIS OF KEY MARKET PLAYERS, 2020–2023 (USD BILLION)
     14.4 MARKET SHARE ANALYSIS, 2023 
               FIGURE 67 ENZYMES MARKET: DEGREE OF COMPETITION (CONSOLIDATED)
     14.5 COMPANY VALUATION AND FINANCIAL METRICS 
               FIGURE 68 COMPANY VALUATION
               FIGURE 69 FINANCIAL METRICS
     14.6 BRAND/PRODUCT COMPARISON 
               FIGURE 70 ENZYMES MARKET: BRAND/PRODUCT COMPARISON
     14.7 COMPANY EVALUATION MATRIX: KEY PLAYERS 
             14.7.1 STARS
             14.7.2 EMERGING LEADERS
             14.7.3 PERVASIVE PLAYERS
             14.7.4 PARTICIPANTS
                       FIGURE 71 ENZYMES MARKET: COMPANY EVALUATION MATRIX FOR KEY PLAYERS, 2023
             14.7.5 COMPANY FOOTPRINT: KEY PLAYERS
                       FIGURE 72 ENZYMES MARKET: COMPANY FOOTPRINT FOR KEY PLAYERS, 2023
                       TABLE 348 ENZYMES MARKET: REGION FOOTPRINT FOR KEY PLAYERS, 2023
                       TABLE 349 ENZYMES MARKET: PRODUCT TYPE FOOTPRINT FOR KEY PLAYERS, 2023
                       TABLE 350 INDUSTRIAL ENZYMES MARKET: APPLICATION FOOTPRINT FOR KEY PLAYERS, 2023
                       TABLE 351 SPECIALTY ENZYMES MARKET: APPLICATION FOOTPRINT FOR KEY PLAYERS, 2023
     14.8 COMPANY EVALUATION MATRIX: START-UPS/SMES 
             14.8.1 PROGRESSIVE COMPANIES
             14.8.2 RESPONSIVE COMPANIES
             14.8.3 DYNAMIC COMPANIES
             14.8.4 STARTING BLOCKS
                       FIGURE 73 ENZYMES MARKET: COMPANY EVALUATION MATRIX FOR START-UPS/SMES, 2023
             14.8.5 COMPETITIVE BENCHMARKING: START-UPS/SMES
                       14.8.5.1 Detailed list of key start-ups/SMEs
                                   TABLE 352 ENZYMES MARKET: KEY START-UPS/SMES, 2023
                       14.8.5.2 Competitive benchmarking of key start-ups/SMEs
                                   TABLE 353 ENZYMES MARKET: COMPETITIVE BENCHMARKING OF KEY START-UPS/SMES (PART 1)
                                   TABLE 354 ENZYMES MARKET: COMPETITIVE BENCHMARKING OF KEY START-UPS/SMES (PART 2)
     14.9 COMPETITIVE SCENARIO AND TRENDS 
             14.9.1 PRODUCT LAUNCHES
                       TABLE 355 ENZYMES MARKET: PRODUCT LAUNCHES, JANUARY 2019–MAY 2024
             14.9.2 DEALS
                       TABLE 356 ENZYMES MARKET: DEALS, JANUARY 2019–MAY 2024
             14.9.3 EXPANSIONS
                       TABLE 357 ENZYMES MARKET: EXPANSIONS, JANUARY 2019–MAY 2024
             14.9.4 OTHERS
                       TABLE 358 ENZYMES MARKET: OTHERS, JANUARY 2019–MAY 2024
 
15 COMPANY PROFILES (Page No. - 337)
(Business Overview, Products/Solutions/Services Offered, Recent Developments, and MnM View (Key strengths/Right to Win, Strategic Choices Made, and Weaknesses and Competitive Threats))*
     15.1 KEY PLAYERS 
             15.1.1 BASF SE
                       TABLE 359 BASF SE: COMPANY OVERVIEW
                       FIGURE 74 BASF SE: COMPANY SNAPSHOT
                       TABLE 360 BASF SE: PRODUCTS/SOLUTIONS/SERVICES OFFERED
                       TABLE 361 BASF SE: PRODUCT LAUNCHES
                       TABLE 362 BASF SE: DEALS
                       TABLE 363 BASF SE: OTHERS
             15.1.2 INTERNATIONAL FLAVORS & FRAGRANCES INC.
                       TABLE 364 INTERNATIONAL FLAVORS & FRAGRANCES INC.: COMPANY OVERVIEW
                       FIGURE 75 INTERNATIONAL FLAVORS & FRAGRANCES INC.: COMPANY SNAPSHOT
                       TABLE 365 INTERNATIONAL FLAVORS & FRAGRANCES INC.: PRODUCTS/SOLUTIONS/SERVICES OFFERED
                       TABLE 366 INTERNATIONAL FLAVORS & FRAGRANCES INC.: PRODUCT LAUNCHES
                       TABLE 367 INTERNATIONAL FLAVORS & FRAGRANCES INC.: DEALS
             15.1.3 ASSOCIATED BRITISH FOODS PLC
                       TABLE 368 ASSOCIATED BRITISH FOODS PLC: COMPANY OVERVIEW
                       FIGURE 76 ASSOCIATED BRITISH FOODS PLC: COMPANY SNAPSHOT
                       TABLE 369 ASSOCIATED BRITISH FOODS PLC: PRODUCTS/SOLUTIONS/SERVICES OFFERED
                       TABLE 370 ASSOCIATED BRITISH FOODS PLC: PRODUCT LAUNCHES
                       TABLE 371 ASSOCIATED BRITISH FOODS PLC: DEALS
             15.1.4 DSM-FIRMENICH
                       TABLE 372 DSM-FIRMENICH: COMPANY OVERVIEW
                       FIGURE 77 DSM-FIRMENICH: COMPANY SNAPSHOT
                       TABLE 373 DSM-FIRMENICH: PRODUCTS/SOLUTIONS/SERVICES OFFERED
                       TABLE 374 DSM-FIRMENICH: PRODUCT LAUNCHES
             15.1.5 NOVOZYMES A/S
                       TABLE 375 NOVOZYMES A/S: COMPANY OVERVIEW
                       FIGURE 78 NOVOZYMES A/S: COMPANY SNAPSHOT
                       TABLE 376 NOVOZYMES A/S: PRODUCTS/SOLUTIONS/SERVICES OFFERED
                       TABLE 377 NOVOZYMES A/S: PRODUCT LAUNCHES
                       TABLE 378 NOVOZYMES A/S: DEALS
                       TABLE 379 NOVOZYMES A/S: OTHERS
             15.1.6 KERRY GROUP PLC
                       TABLE 380 KERRY GROUP PLC: COMPANY OVERVIEW
                       FIGURE 79 KERRY GROUP PLC: COMPANY SNAPSHOT
                       TABLE 381 KERRY GROUP PLC: PRODUCTS/SOLUTIONS/SERVICES OFFERED
                       TABLE 382 KERRY GROUP PLC: PRODUCT LAUNCHES
                       TABLE 383 KERRY GROUP PLC: DEALS
                       TABLE 384 KERRY GROUP PLC: OTHERS
             15.1.7 DYADIC INTERNATIONAL INC.
                       TABLE 385 DYADIC INTERNATIONAL INC.: COMPANY OVERVIEW
                       FIGURE 80 DYADIC INTERNATIONAL INC.: COMPANY SNAPSHOT
                       TABLE 386 DYADIC INTERNATIONAL INC.: PRODUCTS/SOLUTIONS/SERVICES OFFERED
                       TABLE 387 DYADIC INTERNATIONAL INC.: DEALS
             15.1.8 ADVANCED ENZYME TECHNOLOGIES
                       TABLE 388 ADVANCED ENZYME TECHNOLOGIES: COMPANY OVERVIEW
                       FIGURE 81 ADVANCED ENZYME TECHNOLOGIES: COMPANY SNAPSHOT
                       TABLE 389 ADVANCED ENZYME TECHNOLOGIES: PRODUCTS/SOLUTIONS/SERVICES OFFERED
                       TABLE 390 ADVANCED ENZYME TECHNOLOGIES: DEALS
             15.1.9 AUMGENE BIOSCIENCES
                       TABLE 391 AUMGENE BIOSCIENCES: COMPANY OVERVIEW
                       TABLE 392 AUMGENE BIOSCIENCES: PRODUCTS/SOLUTIONS/SERVICES OFFERED
               15.1.10 AMANO ENZYME INC.
                                   TABLE 393 AMANO ENZYME INC.: COMPANY OVERVIEW
                                   TABLE 394 AMANO ENZYME INC.: PRODUCTS/SOLUTIONS/SERVICES OFFERED
                                   TABLE 395 AMANO ENZYME INC.: PRODUCT LAUNCHES
                                   TABLE 396 AMANO ENZYME INC.: DEALS
                                   TABLE 397 AMANO ENZYME INC.: OTHERS
               15.1.11 F. HOFFMANN-LA ROCHE LTD
                                   TABLE 398 F. HOFFMANN-LA ROCHE LTD: COMPANY OVERVIEW
                                   FIGURE 82 F. HOFFMANN-LA ROCHE LTD: COMPANY SNAPSHOT
                                   TABLE 399 F. HOFFMANN-LA ROCHE LTD: PRODUCTS/SOLUTIONS/SERVICES OFFERED
                                   TABLE 400 F. HOFFMANN-LA ROCHE LTD: DEALS
               15.1.12 CODEXIS, INC.
                                   TABLE 401 CODEXIS, INC.: COMPANY OVERVIEW
                                   FIGURE 83 CODEXIS, INC.: COMPANY SNAPSHOT
                                   TABLE 402 CODEXIS, INC.: PRODUCTS/SOLUTIONS/SERVICES OFFERED
                                   TABLE 403 CODEXIS, INC.: PRODUCT LAUNCHES
                                   TABLE 404 CODEXIS, INC.: DEALS
               15.1.13 SANOFI
                                   TABLE 405 SANOFI: COMPANY OVERVIEW
                                   FIGURE 84 SANOFI: COMPANY SNAPSHOT
                                   TABLE 406 SANOFI: PRODUCTS/SOLUTIONS/SERVICES OFFERED
                                   TABLE 407 SANOFI: DEALS
               15.1.14 MERCK KGAA
                                   TABLE 408 MERCK KGAA: COMPANY OVERVIEW
                                   FIGURE 85 MERCK KGAA: COMPANY SNAPSHOT
                                   TABLE 409 MERCK KGAA: PRODUCTS/SOLUTIONS/SERVICES OFFERED
                                   TABLE 410 MERCK KGAA: DEALS
                                   TABLE 411 MERCK KGAA: OTHERS
               15.1.15 ADISSEO
                                   TABLE 412 ADISSEO: COMPANY OVERVIEW
                                   FIGURE 86 ADISSEO: COMPANY SNAPSHOT
                                   TABLE 413 ADISSEO: PRODUCTS/SOLUTIONS/SERVICES OFFERED
                                   TABLE 414 ADISSEO: PRODUCT LAUNCHES
     15.2 OTHER PLAYERS 
             15.2.1 LESAFFRE CORPORATION
                       TABLE 415 LESAFFRE CORPORATION: COMPANY OVERVIEW
                       TABLE 416 LESAFFRE CORPORATION: PRODUCTS/SOLUTIONS/SERVICES OFFERED
             15.2.2 CREATIVE ENZYMES
                       TABLE 417 CREATIVE ENZYMES: COMPANY OVERVIEW
                       TABLE 418 CREATIVE ENZYMES: PRODUCTS/SOLUTIONS/SERVICES OFFERED
                       TABLE 419 CREATIVE ENZYMES: PRODUCT LAUNCHES
             15.2.3 ENZYME SOLUTIONS
                       TABLE 420 ENZYME SOLUTIONS: COMPANY OVERVIEW
                       TABLE 421 ENZYME SOLUTIONS: PRODUCTS/SOLUTIONS/SERVICES OFFERED
             15.2.4 ENZYMATIC DEINKING TECHNOLOGIES, LLC
                       TABLE 422 ENZYMATIC DEINKING TECHNOLOGIES, LLC: COMPANY OVERVIEW
                       TABLE 423 ENZYMATIC DEINKING TECHNOLOGIES, LLC: PRODUCTS/SOLUTIONS/SERVICES OFFERED
             15.2.5 TEX BIOSCIENCES (P) LTD.
                       TABLE 424 TEX BIOSCIENCES (P) LTD.: COMPANY OVERVIEW
                       TABLE 425 TEX BIOSCIENCES (P) LTD.: PRODUCTS/SOLUTIONS/SERVICES OFFERED
             15.2.6 DENYKEM
             15.2.7 METGEN
             15.2.8 BIOVET S.A.
             15.2.9 BIOCATALYSTS
             15.2.10 ALLTECH
*Details on Business Overview, Products/Solutions/Services Offered, Recent Developments, and MnM View (Key strengths/Right to Win, Strategic Choices Made, and Weaknesses and Competitive Threats) might not be captured in case of unlisted companies.
 
16 ADJACENT AND RELATED MARKETS (Page No. - 412)
     16.1 INTRODUCTION 
               TABLE 426 ADJACENT MARKETS TO ENZYMES MARKET
     16.2 LIMITATIONS 
     16.3 INDUSTRIAL ENZYMES MARKET 
             16.3.1 MARKET DEFINITION
             16.3.2 MARKET OVERVIEW
                       TABLE 427 INDUSTRIAL ENZYMES MARKET, BY APPLICATION, 2019–2022 (USD MILLION)
                       TABLE 428 INDUSTRIAL ENZYMES MARKET, BY APPLICATION, 2023–2028 (USD MILLION)
                       TABLE 429 FOOD & BEVERAGES: INDUSTRIAL ENZYMES MARKET, BY SUB-APPLICATION, 2019–2022 (USD MILLION)
                       TABLE 430 FOOD & BEVERAGES: INDUSTRIAL ENZYMES MARKET, BY SUB-APPLICATION, 2023–2028 (USD MILLION)
     16.4 FOOD ENZYMES MARKET 
             16.4.1 MARKET DEFINITION
             16.4.2 MARKET OVERVIEW
             16.4.3 FOOD ENZYMES MARKET, BY APPLICATION
                       TABLE 431 FOOD ENZYMES MARKET, BY TYPE, 2016–2020 (USD MILLION)
                       TABLE 432 FOOD ENZYMES MARKET, BY TYPE, 2021–2026 (USD MILLION)
                       TABLE 433 FOOD ENZYMES MARKET, BY TYPE, 2016–2020 (TONS)
                       TABLE 434 FOOD ENZYMES MARKET, BY TYPE, 2021–2026 (TONS)
             16.4.4 FOOD ENZYMES MARKET, BY REGION
                       16.4.4.1 Introduction
                                   TABLE 435 FOOD ENZYMES MARKET, BY REGION, 2016–2020 (USD MILLION)
                                   TABLE 436 FOOD ENZYMES MARKET, BY REGION, 2021–2026 (USD MILLION)
     16.5 FEED ENZYMES MARKET 
             16.5.1 MARKET DEFINITION
             16.5.2 MARKET OVERVIEW
                       TABLE 437 FEED ENZYMES MARKET, BY REGION, 2016–2019 (USD MILLION)
                       TABLE 438 FEED ENZYMES MARKET, BY REGION, 2020–2025 (USD MILLION)
 
17 APPENDIX (Page No. - 420)
     17.1 DISCUSSION GUIDE 
     17.2 KNOWLEDGESTORE: MARKETSANDMARKETS’ SUBSCRIPTION PORTAL 
     17.3 CUSTOMIZATION OPTIONS 
     17.4 RELATED REPORTS 
     17.5 AUTHOR DETAILS 

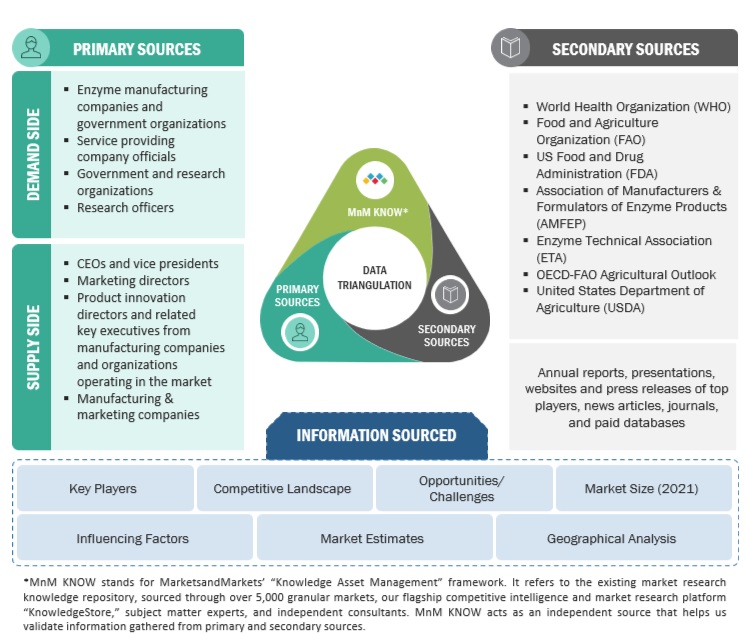
This research involves the extensive use of secondary sources; directories; and databases (Bloomberg and Factiva) to identify and collect information useful for a technical, market-oriented, and commercial study of the Enzymes market. In-depth interviews were conducted with various primary respondents, such as key industry participants, Subject Matter Experts (SMEs), C-level executives of key market players, and industry consultants, to obtain and verify critical qualitative and quantitative information and to assess prospects.

Secondary Research

In the secondary research process, various sources, such as the European Federation of Biotechnology (EFB), American Chemical Society (ACS), Association of Manufacturers and Formulators of Enzyme Products (AMFEP), Enzyme Technical Association (ETA), International Union of Biochemistry and Molecular Biology (IUBMB), Food and Drug Administration (FDA), European Food Safety Authority (EFSA), Environmental Protection Agency (EPA), European Chemicals Agency (ECHA), Food Safety and Standards Authority of India (FSSAI), Ministry of Health, Labour and Welfare (MHLW) Japan associations were referred to identify and collect information for this study. The secondary sources also include journals, press releases, investor presentations of companies, whitepapers, certified publications, articles by recognized authors and regulatory bodies, trade directories, and paid databases.

Primary Research

The Enzymes market encompasses various stakeholders involved in the supply chain, raw material manufacturers, raw material suppliers, regulatory organizations, and research institutions. To gather comprehensive information, primary sources from both the supply and demand sides were engaged. Primary interviewees from the supply side consisted of manufacturers, distributors, importers, and technology providers involved in the production and distribution of Enzymes. On the demand side, key opinion leaders, executives, and CEOs of companies in the Enzymes industry were approached through questionnaires, emails, and telephonic interviews. This approach ensured a comprehensive and well-rounded understanding of the Enzymes market from various perspectives.
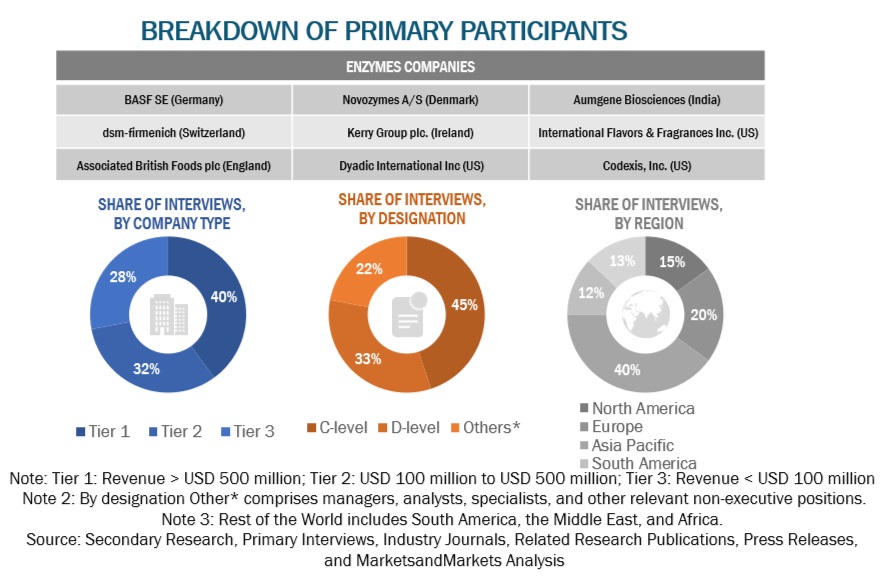
Enzymes Market Size, and Share

To know about the assumptions considered for the study, download the pdf brochure

Market Size Estimation

The top-down and bottom-up approaches were used to estimate and validate the market’s and various dependent submarkets’ size. The research methodology used to estimate the market size includes extensive secondary research of key players, reports, reviews, and newsletters of top market players, along with extensive interviews from leaders, such as CEOs, directors, and marketing executives.

Global Enzymes Market Size: Top-Down Approach

Enzymes Market Top Down Approach

To know about the assumptions considered for the study, Request for Free Sample Report
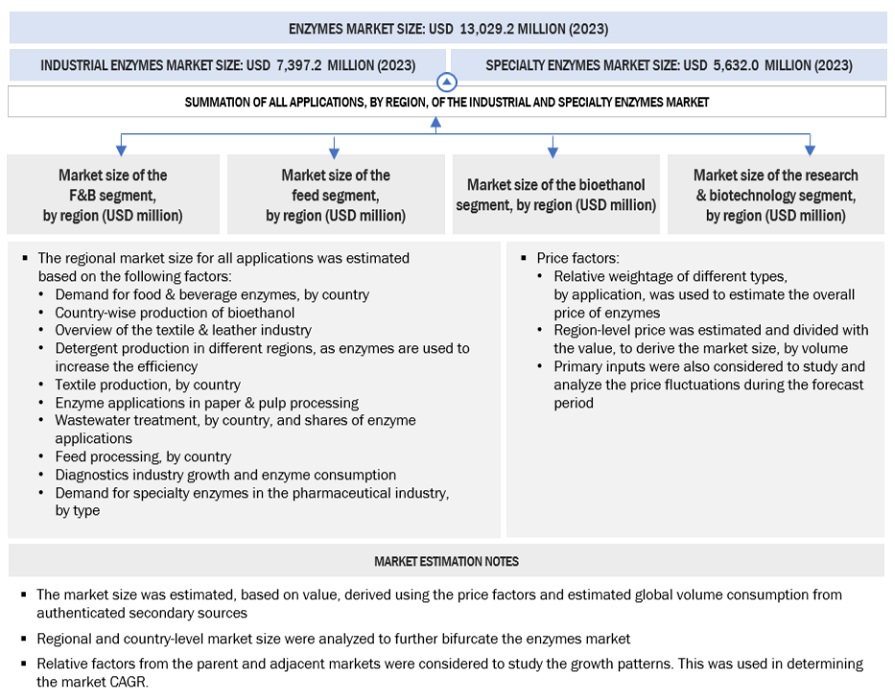
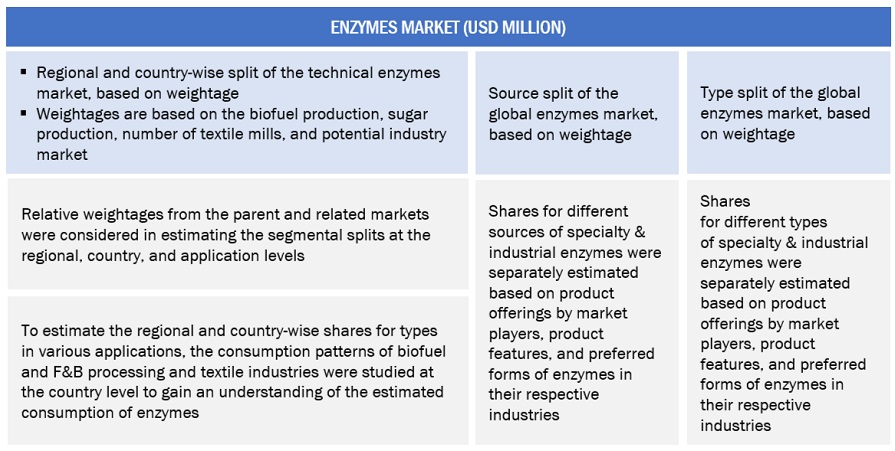
Enzymes Market Top Down Approach

Enzymes Market Top Down Approach

Data Triangulation

Enzymes Market Data Triangulation

Market Definition

The enzymes market comprises industrial enzymes and specialty enzymes.

Enzymes are proteins composed of amino acids and can convert a compound (substrate) into another product by catalytic reaction. These catalytic proteins assist in the performance of biochemical reactions. They lower the activation energy of the reaction and then induce it.

Enzymes used for industrial applications such as food & beverage processing, feed, bioethanol, textile & leather, detergent, paper & pulp, wastewater treatment, and other industrial applications are termed as industrial enzymes.

Specialty enzymes are primarily utilized to produce pharmaceuticals, and diagnostics solutions, as well as in biocatalysts and research & biotechnology. They are highly selective catalysts and function in metabolic reactions and the interconversion of complex molecules to smaller ones.

Stakeholders

  • Enzyme raw material suppliers
  • Industrial enzyme manufacturers
  • Specialty enzyme manufacturers
  • Intermediate suppliers such as traders and distributors of enzymes
  • Manufacturers of food & beverages, biofuels, detergents, textile & leather, paper & pulp, wastewater treatment, feed, and others
  • Government and research organizations
  • Associations, regulatory bodies, and other industry-related bodies:
    • European communities
    • World Health Organization (WHO)
    • Association of Manufacturers & Formulators of Enzyme Products (AMFEP)
    • Enzyme Technical Association (ETA)
    • OECD-FAO Agricultural Outlook
    • United States Department of Agriculture (USDA)

Report Objectives

  • To define and measure the global enzymes market with respect to product type, type, source,industrial enzymes by application, specialty enzymes by application, and geography
  • Determining and projecting the size of the enzymes market, with respect to product type, source, type, application, and regional markets, over five-year period, ranging from 2024 to 2029.
  • Identifying the attractive opportunities in the market by determining the largest and fastest-growing segments across regions
  • Providing detailed information about the key factors influencing the growth of the market (drivers, restraints, opportunities, and industry-specific challenges)
  • Analyzing the micro markets, with respect to individual growth trends, prospects, and their contribution to the total market
  • To strategically profile key players of the global enzymes market and comprehensively analyze their core competencies in each segment
  • To track and analyze competitive developments, such as alliances, joint ventures, new product developments, mergers, and acquisitions in the global enzymes market

Available Customizations:

With the given market data, MarketsandMarkets offers customizations according to company-specific scientific needs.

The following customization options are available for the report:

Product Analysis

  • Product Matrix, which gives a detailed comparison of the product portfolio of each company

Geographic Analysis

With the given market data, MarketsandMarkets offers customizations according to the company-specific scientific needs.

  • Further breakdown of the Rest of the European Probiotics market, by key country
  • Further breakdown of the Rest of the Asia Pacific Probiotics market, by key country
  • Further breakdown of the Rest of South America Probiotics market, by key country

Company Information

  • Detailed analyses and profiling of additional market players (up to five)
Custom Market Research Services

We will customize the research for you, in case the report listed above does not meet with your exact requirements. Our custom research will comprehensively cover the business information you require to help you arrive at strategic and profitable business decisions.

Request Customization

Instant Answers with GPT - Ask Now!

Ask real questions. Get complete answers !
Report Code
FB 7583
Published ON
May, 2024
Choose License Type
BUY NOW
  • SHARE
X
Request Customization
Speak to Analyst
Speak to Analyst
OR FACE-TO-FACE MEETING
PERSONALIZE THIS RESEARCH
  • Triangulate with your Own Data
  • Get Data as per your Format and Definition
  • Gain a Deeper Dive on a Specific Application, Geography, Customer or Competitor
  • Any level of Personalization
REQUEST A FREE CUSTOMIZATION
LET US HELP YOU!
  • What are the Known and Unknown Adjacencies Impacting the Enzymes Market
  • What will your New Revenue Sources be?
  • Who will be your Top Customer; what will make them switch?
  • Defend your Market Share or Win Competitors
  • Get a Scorecard for Target Partners
CUSTOMIZED WORKSHOP REQUEST
  • Call Us
  • +1-888-600-6441 (Corporate office hours)
  • +1-888-600-6441 (US/Can toll free)
  • +44-800-368-9399 (UK office hours)
CONNECT WITH US
ABOUT TRUST ONLINE
©2024 MarketsandMarkets Research Private Ltd. All rights reserved
DMCA.com Protection Status Website Feedback