Global Mixed Signal System-on-Chip (MxSoC) Market by Intellectual Property (IP), Design Architecture, Fabrication Technology, Processor Type, Technology Nodes & Applications 2011 - 2016


System-on-a-Chip (SoC) technology, as the name suggests, is basically an integration of several electronic components on a single IC chip to form an electronic system. A standard SoC design consists of IP cores and peripherals. The SoC IP consists of Processor IP, Analog IP, Digital IP, Memory IP, (ASIC) Application Specific IP, (FPGA & PLD) Programmable IP, and Data Converter IP. Mixed Signal SoC (MxSoC, in short) is a relatively new category in SoC, which is designed for mixed signal (handling both analog and digital purposes). Today the application area of mixed signal technology has spread across all the end-user sectors; right from Computers & ICT sectors to Consumer Electronics, Industrial, Medical, and others. Technological advancements in IC technology have enabled a system level integration on a System-on-a-Chip making Mixed Signal SoC; a suitable and efficient solution for large scale integrated circuit applications in the semiconductors & electronics industries. The greatest advantage offered by the MxSoC over traditional mixed signal IC system is its smaller form factor and higher efficiency as a complete system in digital and mixed signal electronics.
This research study gives detailed insights into the Mixed Signal SoC design, development, and establishment; mainly focusing on its present market and its forecast till 2016. It provides in-depth research into the dynamics of the landscapes of allied industry segments of Mixed Signal SoC industry; such as Foundries, Fabless, IDM, WLP, EDA, ATP, IP, and others. It also provides in-depth research and analysis on various above mentioned IPs (can be termed as SoC IPs) in a mixed signal SoC. It entails the markets by various classifications such as SoC design types, SoC processor types, and SoC architecture strategies. Several other concepts related to the Mixed Signal SoC’s market and industries have been covered extensively in this research study.
The report on this research study analyzes in detail, the global Mixed Signal SoC market and all its market segments and sub-segments. All important classifications of the Mixed Signal SoC market have been considered.
This report discusses the market drivers, restraints, and opportunities with respect to the Mixed Signal SoC market from a global perspective and gives an impact analysis of each influential factor on the market. Applications of two rapidly growing product segments; namely Smart Sensors and Smart Fusion SoCs in several end-user verticals have been exclusively covered. Also, an in-depth geographic analysis has been done, covering the major regional and geographical market segments of the MxSoC market.
Since the report mainly covers the MxSoC market whose parent market is the global System-on-Chip (SoC) market, the report also includes various aspects related to the overall semiconductor and SoC industries in several instances throughout the report in various chapters. A comparison of various aspects, of each market segment with its parent market (for example, the MxSoC market with overall SoC market) is done at every possible level to give an idea about the total addressable markets for each market segment and the market penetrations.
The leading players in this market have been profiled with their recent developments and the other strategic industry activities. Key participants in the global Mixed Signal System-on-a-Chip market include Apple Inc., Intel Corp., Samsung Electronics Inc., Qualcomm Inc., Texas Instruments, Freescale Semiconductor, NVIDIA Corp., STMicroelectronics N.V, NXP Semiconductors N.V, Broadcom Corp., Infineon Technologies A.G, Elpida Memory Inc., Fujitsu Limited and ARM Holdings Plc. A complete competitive landscape, along with key growth strategies and market share analysis of the key industry players of this market globally is also given.
Scope of the report
The scope of this research study includes the market for Mixed Signal System-on-Chips only and not the complete System-on-Chips market.
In this report, the global MxSoC market and industry is fully covered and segmented into/by the following categories and aspects:
Allied Industry Segments & Value Chain: MxSoC Industry Value Chain Analysis, Dynamics of EDA & Design Tool, IP, Foundry, Fabless, Fab (Fabrication) and Assembly, Testing & Packaging (ATP) vendors and their impact on the MxSoC market.
Markets by Intellectual Property: Memory IP, (ASIC) Application Specific IP, (FPGA & PLD) Programmable IP, Analog IP, Digital IP, Data Converter IP, Processor IP (further segmented into Applications Processor IP & Graphics Processor IP, with special focus on ARM Processor IP) markets.
Markets by Product Segments: Standard cell-based MxSoCs, embedded design-based MxSoCs (further segmented into embedded memory and embedded micro-logic MxSoC markets).
Markets by Fabrication Technology: Semi-custom and full-custom mixed signal SoC markets.
Markets by Processor Types: Soft instruction processor SoCs, configurable processor SoCs, ARM processor SoCs, multi-core processor SoCs, digital signal processor SoC markets.
Markets by Technology (Process) Nodes: Mature processes (350 nm and 150 nm), Deep Sub-Micron (250 nm and 180 nm), Advanced Deep Sub-Micron (65 nm, 45 nm, 40 nm, 32 nm, 28 nm, 22 nm) technology nodes based MxSoC markets.
Markets by Application: “Computers” sector (microprocessors, microcontrollers, computer peripherals), “ICT” sector (wireless communication equipment, smart sensors in “ICT” sector), consumer electronics (smartphones, portable media players, set-top boxes, digital TVs, DVD, and Blu-ray players, video coders and decoders, smart sensors in consumer electronics, power management chips), “Automotive” sector (smart sensors in automotive sector, automotive body electronics, infotainment applications), “Industrial” sector (SmartFusion cSoC, solid-state & electro-mechanical systems, industrial automation), “Military & Aerospace” sector (field programmable arrays, Rad-Hard mixed signal FPGAs & ASICs), “Medical” sector (ECG telemetry devices, high & low voltage medical devices, smart sensors in medical sector, implantable medical devices, SmartFusion cSoC, SoC-equipped Nanorobots), “RF and Others” sector (RF SoCs, Bi CMOS SoCs, RADAR communication applications) application markets of the global MxSoC market.
Markets by Geography: Global Market Perspective, North American, European, Japan, APAC (Excluding Japan) and Rest of the World (ROW) markets for MxSoCs.
Competitive Landscape & Company Profiles: Global competitive landscape, market shares and analysis, market share rankings, recent industry activities such as agreements, technology licenses, partnerships, collaborations, JVs, mergers & acquisitions and new product launches; company profiles of the industry’s key players.
KEY TAKE AWAYS
- Estimated total MxSoC and overall SoC and semiconductor market sizes in 2010 and 2011 and forecasts till 2016
- Classification of the global MxSoC market with detailed segmentation by intellectual property, form factor, design architecture, fabrication technology, technology (process) node, product segments with estimates and forecasts of revenue and volume of all sub-markets
- The future of the MxSoC technologies and market from both, technical and market-oriented perspectives
- Identification of the major driving factors and inhibitors for the global MxSoC market and their impact analysis
- Analytical growth trends of the MxSoC market and its individual market segments and the potential revenue bases
- The dynamics of the industry segments in the value chain, effect of changes in landscapes of value chain segments such as IP, EDA & Design Tools, Foundry, Fab, Fabless, IDM, ODM, OEM and ATP on the MxSoC market
- The global consumption of MxSoCs in several end-user verticals and their application segments and the revenue generated from each of the application segments
- Major stakeholders in the market and complete competitive landscape of the market leaders, key player market shares and rankings added with detailed analysis
- Analytical trends and forecasts of the MxSoC market specific to various geographical regions across the globe
- Special focus on the MxSoC IP market segment, with dynamics and influential factors of the MxSoC IP market and its sub-market segments mentioned above.
SoC technology has proven itself to be one of the most revolutionary technologies in semiconductor and electronics sectors over the last decade. Yet, this technology has led to the emergence of several issues and announced big challenges for the researchers and engineers. SoCs are the result of consolidation of advanced microprocessors, memories, buses systems, communications systems, standards, protocol processors, interfaces, and the other intellectual property components into a single system. As of today, the System-on-Chip is the biggest revolutionary aspect in the field of semiconductor chips, and considered to be the most successful next generation semiconductor chip technology after the traditional integrated circuits, with explosive penetration in the digital semiconductors & electronics world.
The demand for System-on-Chips has been tremendously highly in the world of digital electronics, which sufficiently boosts the overall market for SoC. The global SoC market is a fast growing one and expected to transcend all the barriers owing to the huge revenue potential for digital SoCs and the robust demand. However, a digital SoC cannot have similar scenario in the Analog & Mixed Signal applications field of Semiconductors & Electronics, where an upcoming robust demand for advanced semiconductor chips (which have surpassed Mixed Signal ASICs and FPGAs) exists.
The Mixed Signal SoC or MxSoC in short, is a System-on-a-Chip that has mixed signal design (an ability to handle both analog and digital signals). An MxSoC is designed with the concept of embedded system that is capable of handling both digital and analog signals with more advanced functionalities incorporated on a single chip, thereby producing a system that can be placed in any environment – analog, digital or both, which acts as a smaller, faster, and more efficient semiconductor chip system. As of today, an MxSoC serves as the best option for advanced electronic systems of the Analog & Mixed Signal world, specifically the upcoming mixed signal electronic applications. Convergence of the “Analog” and the relatively new “Mixed Signal” concepts in Semiconductors & Electronics, will prove to have a positive impact on the global MxSoC market and industry, from both, market and technological perspective, due to changes in required chip specifications & features from end-user applications, which affect the demand for MxSoCs. Since an MxSoC can handle digital signals as well, MxSoCs have an edge over pure digital SoCs, even in advanced application segments of the digital electronics world, where the ability to handle mixed signals also plays in an important role these days, such as smartphones and hand-held gadgets.
Due to the advancements in the end-user applications across several end-user verticals in today’s fast-changing electronics market, most of the SoCs manufactured are MxSoCs. The percentage share of MxSoCs in the global SoCs was about 84% in 2011. This report mainly focuses on the global MxSoC market and its related industry, with an extensive classification to cover all its sub-markets and sub-segments. As all the advanced SoCs are MxSoCs in the present era, the report study would also cover the entire SoC market indirectly. The percentage share of Mixed Signal in the overall System-on-a-Chip market is growing rapidly as more advanced versions of SoCs are manufactured with mixed signal design incorporated in them to offer the additional functionality of handling both analog & digital signals.
The global System-on-a-Chip market is estimated to grow at a CAGR of 21.24% from 2011 to 2016. The increasing use of SoCs in several applications spanning all the end-user verticals is one of the reasons for such an outstanding growth. The continuous launch of several end-user applications using SoCs in computing, information technology, and consumer electronics sectors (such as Smartphones, Tablets, Laptops, Hand-held and portable gadgets) is another reason for the demand for SoCs, leading to healthy revenue growth in the SoC market. The Mixed Signal System-on-a-Chip market is estimated to be $72.16 billion in 2011. This market is expected to grow at a CAGR of 24.14% from 2011 to 2016, reaching $212.69 billion by 2016.
The MxSoC market is segmented into geographical markets in North America, Europe, Japan, APAC (excluding Japan), and Rest of the world in the report. The following figure shows the overall Mixed Signal SoC market revenue by geography in 2011.
GLOBAL MIXED SIGNAL SOC MARKET REVENUE BY GEOGRAPHY, 2011
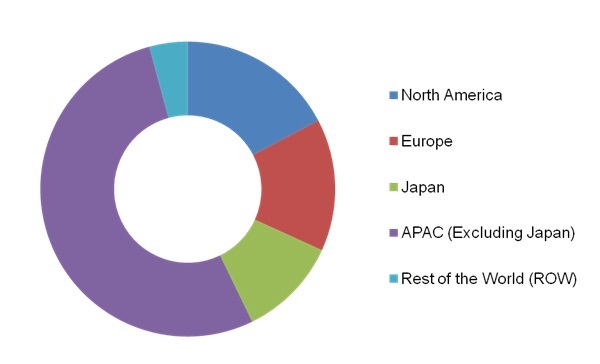
Source: MarketsandMarkets
 Exclusive indicates content/data unique to MarketsandMarkets and not available with any competitors.
TABLE OF CONTENTS
1 INTRODUCTION
1.1 KEY TAKE-AWAYS
1.2 REPORT DESCRIPTION
1.3 MARKETS COVERED
1.4 STAKEHOLDERS
1.5 RESEARCH METHODOLOGY
1.5.1 MARKET SIZE
1.5.2 KEY DATA POINTS FROM PRIMARY SOURCES
1.5.3 KEY DATA POINTS FROM SECONDARY SOURCES
1.5.4 ASSUMPTIONS MADE FOR THE REPORT
2 EXECUTIVE SUMMARY
3 MARKET OVERVIEW
3.1 INTRODUCTION
3.2 HISTORY & EVOLUTION
3.2.1 PLATFORMS THAT SUPPORT MULTIMEDIA MIXED SIGNAL SOC
3.3 COMPONENTS OF MIXED SIGNAL SOC – BLOCK DIAGRAMS
3.4 ALLIED INDUSTRY SEGMENTS TO MIXED SIGNAL SOC
3.4.1 EDA MARKET OVERVIEW
3.4.2 FOUNDRY MARKET OVERVIEW
3.4.3 ASSEMBLY TESTING & PACKAGING OVERVIEW
3.5 MIXED SIGNAL SOC INTELLECTUAL PROPERTY MARKET
3.5.1 MEMORY IP MARKET
3.5.2 ASIC IP MARKET
3.5.3 PROGRAMMABLE LOGIC IP MARKET
3.5.4 ANALOG IP MARKET
3.5.5 DIGITAL IP MARKET
3.5.6 DATA CONVERTER IP MARKET
3.5.6.1 Analog-to-Digital (ADC)
3.5.6.2 Digital-to-Analog (DAC)
3.5.7 PROCESSOR IP MARKET
3.5.8 ARM PROCESSOR IP MARKET
3.6 PATENT ANALYSIS
4 MIXED SIGNAL SOC MARKET ANALYSIS
4.1 INTRODUCTION
4.2 GLOBAL MARKET ESTIMATES & FORECASTS
4.3 MARKET DYNAMICS
4.3.1 DRIVERS
4.3.1.1 Smartphone market to drive the mixed signal SoC market to achieve new record level growth rates
4.3.1.2 Embedded graphics market to drive the SoCs market substantially
4.3.1.3 Expanding multi-core technology to sky-rocket SoC market
4.3.2 RESTRAINTS
4.3.2.1 Issues in migration of technology nodes for SoC manufacturing facilities
4.3.2.2 Inconsistent and relatively slow growth of the DSP SoC market
4.3.3 OPPORTUNITIES
4.3.3.1 The rapidly growing tablet PCs market
4.3.3.2 The rising growth trend of digital TVs and set-top boxes
5 MIXED SIGNAL SOC MARKET, BY DESIGN ARCHITECTURE
5.1 INTRODUCTION
5.2 MIXED SIGNAL SOC MARKET CLASSIFICATION, BY PRODUCT SEGMENTS
5.2.1 STANDARD CELL BASED MIXED SIGNAL SOC
5.2.2 EMBEDDED MIXED SIGNAL SOC
5.2.2.1 Embedded memory SOC
5.2.2.2 Embedded micro-logic SOC
5.3 MIXED SIGNAL SOC MARKET CLASSIFICATION BY FABRICATION TECHNOLOGY
5.3.1 SEMI-CUSTOM MIXED SIGNAL SOC
5.3.2 FULL-CUSTOM MIXED SIGNAL SOC
5.4 MIXED SIGNAL SOC MARKET CLASSIFICATION, BY PROCESSOR TYPES
5.4.1 SOFT-INSTRUCTION PROCESSORS
5.4.2 CONFIGURABLE PROCESSORS
5.4.3 ARM PROCESSORS
5.4.4 MULTI-CORE PROCESSORS
5.4.5 DIGITAL SIGNAL PROCESSORS
5.5 MIXED SIGNAL ARCHITECTURE STRATEGY
5.5.1 DESIGN FOR TESTABILITY (DFT) STRATEGY
5.5.2 BACK-END SYNTHESIS STRATEGY
6 MIXED SIGNAL SOC MARKET, BY TECHNOLOGY NODES
6.1 INTRODUCTION
6.2 MATURE PROCESSES
6.2.1 350 NM SOC
6.2.2 150 NM SOC
6.3 DEEP SUB-MICRON
6.3.1 250 NM
6.3.2 180 NM
6.4 COPPER INTERCONNECT PROCESSES
6.4.1 130 NM
6.4.2 90 NM
6.5 ADVANCED DEEP SUB-MICRON
6.5.1 65 NM
6.5.2 45 NM
6.5.3 40 NM
6.5.4 32 NM
6.5.5 28 NM
6.5.6 22 NM
7 MIXED SIGNAL SOC MARKET, BY APPLICATIONS
7.1 INTODUCTION
7.2 COMPUTER SECTOR
7.2.1 MICRO PROCESSORS
7.2.2 MICRO CONTROLLERS
7.2.3 COMPUTER PERIPHERALS
7.3 ICT SECTOR
7.3.1 WIRELESS COMMUNICATION EQUIPMENT
7.3.2 SMART SENSORS IN ICT SECTOR
7.4 CONSUMER ELECTRONICS SECTOR
7.4.1 SMARTPHONES
7.4.2 PORTABLE MEDIA PLAYERS
7.4.3 SET-TOP BOXES & DIGITAL TVS
7.4.4 DVD & BLU-RAY PLAYERS
7.4.5 VIDEO CODERS & DE-CODERS
7.4.6 POWER MANAGEMENT CHIPS
7.5 AUTOMOTIVE SECTOR
7.5.1 SMART SENSORS IN AUTOMOTIVE SECTOR
7.5.2 AUTOMOTIVE BODY ELECTRONICS
7.5.3 INFOTAINMENT APPLICATIONS
7.6 INDUSTRIAL SECTOR
7.6.1 SMARTFUSION CUSTOMIZABLE Mixed Signal System-on-Chip APPLICATIONS IN INDUSTRIAL SECTOR
7.6.2 SOLID-STATE & ELECTRO-MECHANICAL SYSTEMS
7.6.3 INDUSTRIAL AUTOMATION APPLICATIONS
7.7 MILITARY & AEROSPACE SECTOR
7.7.1 FIELD PROGRAMMABLE MIXED SIGNAL ARRAYS
7.7.2 RADIATION HARD MIXED SIGNAL ASICS & FPGAS
7.8 MEDICAL SECTOR
7.8.1 ELECTROCARDIOGRAM (ECG) TELEMETRY DEVICES
7.8.2 HIGH VOLTAGE MEDICAL DEVICES
7.8.3 SMART SENSORS IN MEDICAL SECTOR
7.8.4 IMPLANTABLE MEDICAL DEVICES
7.8.5 SMARTFUSION CMixed Signal System-on-Chip APPLICATIONS IN MEDICAL SECTOR
7.8.6 SOC-EQUIPPED NANOROBOTS
7.9 RF APPLICATIONS & OTHERS
7.9.1 RF SOCS
7.9.2 RADAR COMMUNICATION APPLICATIONS
8 GEOGRAPHICAL ANALYSIS
8.1 GLOBAL MARKET PERSPECTIVE
8.2 NORTH AMERICA
8.3 EUROPE
8.4 JAPAN
8.5 APAC (EXCLUDING JAPAN)
8.6 REST OF THE WORLD
9 COMPETITIVE LANDSCAPE
9.1 INTRODUCTION
9.2 NEW PRODUCT DEVELOPMENTS
9.3 PARTNERSHIPS, JOINT VENTURES & COLLABORATIONS
9.4 MERGERS & ACQUISITIONS
9.5 MARKET SHARES OF KEY PLAYERS
10 COMPANY PROFILES
10.1 APPLE INC
10.1.1 OVERVIEW
10.1.2 PRODUCTS & SERVICES
10.1.3 FINANCIALS
10.1.4 STRATEGY
10.1.5 DEVELOPMENTS
10.2 ARM HOLDINGS PLC
10.2.1 OVERVIEW
10.2.2 PRODUCTS & SERVICES
10.2.3 FINANCIALS
10.2.4 STRATEGY
10.2.5 DEVELOPMENTS
10.3 BROADCOM CORPORATION
10.3.1 OVERVIEW
10.3.2 PRODUCTS & SERVICES
10.3.3 FINANCIALS
10.3.4 STRATEGY
10.3.5 DEVELOPMENTS
10.4 ELPIDA MEMORY INC
10.4.1 OVERVIEW
10.4.2 PRODUCTS & SERVICES
10.4.3 FINANCIALS
10.4.4 STRATEGY
10.4.5 DEVELOPMENTS
10.5 FREESCALE SEMICONDUCTOR INC
10.5.1 OVERVIEW
10.5.2 PRODUCTS & SERVICES
10.5.3 FINANCIALS
10.5.4 STRATEGY
10.5.5 DEVELOPMENTS
10.6 FUJITSU SEMICONDUCTOR INC.
10.6.1 OVERVIEW
10.6.2 PRODUCTS & SERVICES
10.6.3 FINANCIALS
10.6.4 STRATEGY
10.6.5 DEVELOPMENTS
10.7 INFINEON CORPORATION AG
10.7.1 OVERVIEW
10.7.2 PRODUCTS & SERVICES
10.7.3 FINANCIALS
10.7.4 STRATEGY
10.7.5 DEVELOPMENTS
10.8 INTEL CORPORATION
10.8.1 OVERVIEW
10.8.2 PRODUCTS & SERVICES
10.8.3 FINANCIALS
10.8.4 STRATEGY
10.8.5 DEVELOPMENTS
10.9 LSI CORPORATION
10.9.1 OVERVIEW
10.9.2 PRODUCTS & SERVICES
10.9.3 FINANCIALS
10.9.4 STRATEGY
10.9.5 DEVELOPMENTS
10.10 MARVELL TECHNOLOGY GROUP
10.10.1 OVERVIEW
10.10.2 PRODUCTS & SERVICES
10.10.3 FINANCIALS
10.10.4 STRATEGY
10.10.5 DEVELOPMENTS
10.11 MICROSEMI CORPORATION
10.11.1 OVERVIEW
10.11.2 PRODUCTS & SERVICES
10.11.3 FINANCIALS
10.11.4 STRATEGY
10.11.5 DEVELOPMENTS
10.12 MIPS TECHNOLOGIES INC
10.12.1 OVERVIEW
10.12.2 PRODUCTS & SERVICES
10.12.3 FINANCIALS
10.12.4 STRATEGY
10.12.5 DEVELOPMENTS
10.13 NEC ELECTRONICS CORPORATION
10.13.1 OVERVIEW
10.13.2 PRODUCTS & SERVICES
10.13.3 FINANCIALS
10.13.4 STRATEGY
10.13.5 DEVELOPMENTS
10.14 NVIDIA CORPORATION
10.14.1 OVERVIEW
10.14.2 PRODUCTS & SERVICES
10.14.3 FINANCIALS
10.14.4 STRATEGY
10.14.5 DEVELOPMENTS
10.15 PALMCHIP CORPORATION
10.15.1 OVERVIEW
10.15.2 PRODUCTS & SERVICES
10.15.3 STRATEGY
10.15.4 DEVELOPMENTS
10.16 QUALCOMM INCORPORATED
10.16.1 OVERVIEW
10.16.2 PRODUCTS & SERVICES
10.16.3 FINANCIALS
10.16.4 STRATEGY
10.16.5 DEVELOPMENTS
10.17 TEXAS INSTRUMENTS INC.
10.17.1 OVERVIEW
10.17.2 PRODUCTS & SERVICES
10.17.3 FINANCIALS
10.17.4 STRATEGY
10.17.5 DEVELOPMENTS
APPENDIX
U.S PATENTS
EUROPE PATENTS
ASIA PATENTS
LIST OF TABLES
TABLE 1 MIXED SIGNAL SOC MARKET REVENUE, BY GEOGRAPHY, 2010 – 2016 ($BILLION)
TABLE 2 TYPICAL CMOS-BASED RFIC TECHNOLOGIES OFFERED BY SPECIALTY FOUNDRIES
TABLE 3 COMPARISION OF INDUSTRIAL CHARACTERISTICS OF ADVANCED Mixed Signal System-on-Chip IP VS ANALOG & MIXED SIGNAL IC IP
TABLE 4 GLOBAL SOC MARKET, 2010 – 2016, BY REVENUE ($BILLION) & VOLUME (BILLION UNITS)
TABLE 5 GLOBAL Mixed Signal System-on-Chip MARKET, 2010 – 2016, BY REVENUE ($BILLION) & VOLUME (BILLION UNITS)
TABLE 6 MIXED SIGNAL STANDARD CELL SOC MARKET, 2010 – 2016, BY REVENUE ($BILLION) & SHARE (%)
TABLE 7 MIXED SIGNAL STANDARD CELL SOC MARKET, 2010 – 2016, BY VOLUME (BILLION UNITS) & SHARE (%)
TABLE 8 MIXED SIGNAL EMBEDDED SOC MARKET, 2010 – 2016, BY REVENUE ($BILLION) & SHARE (%)
TABLE 9 MIXED SIGNAL EMBEDDED SOC MARKET, 2010 – 2016, BY VOLUME (BILLION UNITS) & SHARE (%)
TABLE 10 MIXED SIGNAL EMBEDDEDMEMORY SOC MARKET, 2010 – 2016, BY REVENUE ($BILLION) & SHARE (%)
TABLE 11 MIXED SIGNAL EMBEDDED MEMORY SOC MARKET, 2010 – 2016, BY VOLUME (BILLION UNITS) & SHARE (%)
TABLE 12 MIXED SIGNAL EMBEDDED MICRO-LOGIC SOC MARKET, 2010 – 2016, BY REVENUE & SHARE ($BILLION)
TABLE 13 MIXED SIGNAL EMBEDDED MICRO-LOGIC SOC MARKET, 2010 – 2016, BY VOLUME (BILLION UNITS) & SHARE (%)
TABLE 14 MIXED SIGNAL SEMI-CUSTOM SOC MARKET, 2010 – 2016, BY REVENUE ($BILLION) & SHARE (%)
TABLE 15 MIXED SIGNAL SEMI-CUSTOM SOC MARKET, 2010 – 2016, BY VOLUME ($BILLION) & SHARE (%)
TABLE 16 GLOBAL MIXED SIGNAL FULL-CUSTOM SOC MARKET, 2010 – 2016, BY REVENUE ($BILLION) & SHARE (%)
TABLE 17 MIXED SIGNAL FULL-CUSTOM SOC MARKET, 2010 – 2016, BY VOLUME (BILLION UNITS) & SHARE (%)
TABLE 18 MIXED SIGNAL SOFT INSTRUCTION PROCESSOR SOC MARKET, 2010 – 2016, BY REVENUE ($BILLION) & SHARE (%)
TABLE 19 MIXED SIGNAL SOFT INSTRUCTION PROCESSOR SOC MARKET, 2010 – 2016, BY VOLUME (BILLION UNITS) & SHARE (%)
TABLE 20 MIXED SIGNAL CONFIGURABLE PROCESSOR SOC MARKET, 2010 – 2016, BY REVENUE ($BILLION) & SHARE (%)
TABLE 21 MIXED SIGNAL CONFIGURABLE PROCESSOR SOC MARKET, 2010 – 2016, BY VOLUME (BILLION UNITS) & SHARE (%)
TABLE 22 MIXED SIGNAL ARM PROCESSOR SOC MARKET, 2010 – 2016, BY REVENUE ($BILLION) & SHARE (%)
TABLE 23 MIXED SIGNAL ARM PROCESSOR SOC MARKET, 2010 – 2016, BY VOLUME (BILLION UNITS) & SHARE (%)
TABLE 24 MIXED SIGNAL MULTI-CORE PROCESSOR SOC MARKET, 2010 – 2016, BY REVENUE ($BILLION) & SHARE (%)
TABLE 25 MIXED SIGNAL MULTI-CORE PROCESSOR SOC MARKET, 2010 – 2016, BY VOLUME (BILLION UNITS) & SHARE (%)
TABLE 26 MIXED SIGNAL DIGITAL SIGNAL PROCESSOR SOC MARKET, 2010 – 2016, BY REVENUE ($BILLION) & SHARE (%)
TABLE 27 MIXED SIGNAL DIGITAL SIGNAL PROCESSOR SOC MARKET, 2010 – 2016, BY VOLUME (BILLION UNITS) & SHARE (%)
TABLE 28 MIXED SIGNAL SOC COMPUTERS SECTOR MARKET REVENUE, BY SEGMENTS, 2010 – 2016 ($BILLION)
TABLE 29 MIXED SIGNAL SOC COMPUTERS SECTOR MARKET VOLUME, BY SEGMENTS, 2010 – 2016 (MILLION UNITS)
TABLE 30 APPLICATION PROCESSOR SOC IN MICRO PROCESSORS SOC MARKET OVERVIEW, 2010
TABLE 31 MIXED SIGNAL SOC ICT SECTOR MARKET REVENUE, BY SEGMENTS, 2010 – 2016 ($BILLION)
TABLE 32 MIXED SIGNAL SOC ICT SECTOR MARKET VOLUME, BY SEGMENTS, 2010 – 2016 (MILLION UNITS)
TABLE 33 MIXED SIGNAL SOC CONSUMER ELECTRONICS SECTOR MARKET REVENUE, BY SEGMENTS, 2010 – 2016 ($BILLION)
TABLE 34 MIXED SIGNAL SOC CONSUMER ELECTRONICS SECTOR MARKET VOLUME, BY SEGMENTS, 2010 – 2016 (MILLION UNITS)
TABLE 35 MIXED SIGNAL SOC AUTOMOTIVE SECTOR MARKET REVENUE, BY SEGMENTS, 2010 – 2016 ($BILLION)
TABLE 36 MIXED SIGNAL SOC AUTOMOTIVE SECTOR MARKET VOLUME, BY SEGMENTS, 2010 – 2016 (MILLION UNITS)
TABLE 37 MIXED SIGNAL SOC INDUSTRIAL SECTOR MARKET REVENUE, BY SEGMENTS, 2010 – 2016 ($BILLION)
TABLE 38 MIXED SIGNAL SOC INDUSTRIAL SECTOR MARKET VOLUME, BY SEGMENTS, 2010 – 2016 (MILLION UNITS)
TABLE 39 MIXED SIGNAL SOC MILITARY & AEROSPACE SECTOR MARKET REVENUE, BY SEGMENTS, 2010 – 2016 ($BILLION)
TABLE 40 MIXED SIGNAL SOC MILITARY & AEROSPACE SECTOR MARKET VOLUME, BY SEGMENTS, 2010 – 2016 (MILLION UNITS)
TABLE 41 MIXED SIGNAL SOC MEDICAL SECTOR MARKET REVENUE, BY SEGMENTS, 2010 – 2016 ($MILLION)
TABLE 42 MIXED SIGNAL SOC MEDICAL SECTOR MARKET VOLUME, BY SEGMENTS, 2010 – 2016 (MILLION UNITS)
TABLE 43 MIXED SIGNAL SOC RF & OTHERS SECTOR MARKET REVENUE, BY SEGMENTS, 2010 – 2016 ($BILLION)
TABLE 44 MIXED SIGNAL SOC RF & OTHERS SECTOR MARKET VOLUME, BY SEGMENTS, 2010 – 2016 (MILLION UNITS)
TABLE 45 GLOBAL MIXED SIGNAL SOC NEW PRODUCT DEVELOPMENTS, 2007 – 2011
TABLE 46 PARTNERSHIPS, JOINT VENTURES & COLLABORATIONS, 2009 – 2011
TABLE 47 MERGERS & ACQUISITIONS
TABLE 48 GLOBAL MIXED SIGNAL SOC KEY INDUSTRY PLAYERS COMPETITIVE LANDSCAPE, 2010
TABLE 49 APPLE INC: NET SALES, BY GEOGRAPHY, 2010 – 2011 ($MILLION)
TABLE 50 APPLE INC: NET SALES, BY PRODUCTS, 2010 – 2011 ($MILLION)
TABLE 51 APPLE INC: UNIT SALES, BY PRODUCTS, 2010 – 2011($MILLION)
TABLE 52 ARM HOLDINGS: MARKET REVENUE, BY GEOGRAPHY, 2009 – 2010 ($MILLION)
TABLE 53 ARM HOLDINGS: MARKET REVENUE, BY SEGMENTS, 2009 – 2010 ($MILLION)
TABLE 54 EPIDA MEMORY INC: MARKET REVENUE, 2009 – 2010 ($MILLION)
TABLE 55 FREESCALE: MARKET REVENUE, BY SEGMENTS, 2009 – 2010 ($MILLION)
TABLE 56 INTEL CORPORATION: MARKET REVENUE, 2009 – 2010 ($MILLION)
TABLE 57 LSI CORPORATION: MARKET REVENUE, BY BUSINESS SEGMENTS, 2009 – 2010 ($MILLION)
TABLE 58 LSI CORPORATION: MARKET REVENUE, BY GEOGRAPHY, 2009 – 2010 ($MILLION)
TABLE 59 MARVELL TECHNOLOGY GROUP LTD: MARKET REVENUE, BY BUSINESS SEGMENTS, 2010 - 2011 ($MILLION)
TABLE 60 MARVELL TECHNOLOGY GROUP LTD: MARKET REVENUE, BY GEOGRAPHY, 2010 – 2011 ($MILLION)
TABLE 61 MICROSEMI CORPORATION: MARKET REVENUE, BY APPLICATIONS, 2009 – 2010 ($MILLION)
TABLE 62 MICROSEMI CORPORATION: MARKET REVENUE, BY GEOGRAPHY, 2009 – 2010 ($MILLION)
TABLE 63 MIPS TECHNOLOGIES: MARKET REVENUE, BY GEOGRAPHY, 2010 – 2011 ($MILLION)
TABLE 64 MIPS TECHNOLOGIES: MARKET REVENUE, 2010 – 2011 ($MILLION)
TABLE 65 TEXAS INSTRUMENTS INCORPORATED: MARKET REVENUE, BY SEGMENTS, 2009 – 2010 ($MILLION)
TABLE 66 TEXAS INSTRUMENTS INCORPORATED: MARKET REVENUE, BY GEOGRAPHY, 2009 – 2010 ($MILLION)
LIST OF FIGURES
FIGURE 1 GLOBAL MIXED SIGNAL SOC MARKET CLASSIFICATION TREE STRUCTURE
FIGURE 2 GLOBAL MIXED SIGNAL SOC MARKET TREE STRUCTURE
FIGURE 3 GLOBAL MIXED SIGNAL SOC MARKET OVERVIEW TREE STRUCTURE
FIGURE 4 Mixed Signal System-on-Chip INTEGRATION
FIGURE 5 PHASES OF Mixed Signal System-on-Chip DEVELOPMENT
FIGURE 6 GLOBAL MIXED SIGNAL SOC MARKET ALLIED INDUSTRY SEGMENTS TREE STRUCTURE
FIGURE 7 GLOBAL MIXED SIGNAL SOC MARKET VALUE CHAIN
FIGURE 8 ROADMAP FOR SOC FOUNDRY INDUSTRY
FIGURE 9 GLOBAL MIXED SIGNAL SOC MARKET ALLIED INDUSTRY SEGMENTS TREE STRUCTURE
FIGURE 10 MEMORY IP IN MIXED SIGNAL SOC MARKET, 2010 – 2016, BY REVENUE ($MILLION) & VOLUME (MILLION UNITS)
FIGURE 11 ASIC IP IN MIXED SIGNAL SOC MARKET, 2010 – 2016, BY REVENUE ($MILLION) & VOLUME (MILLION UNITS)
FIGURE 12 PROGRAMMABLE LOGIC IP IN MIXED SIGNAL SOC MARKET, 2010 – 2016, BY REVENUE ($MILLION) & VOLUME (MILLION UNITS)
FIGURE 13 ANALOG IP IN MIXED SIGNAL SOC MARKET, 2010 – 2016, BY REVENUE ($MILLION) & VOLUME (MILLION UNITS)
FIGURE 14 DISTRIBUTION OF DIGITAL LOGIC IP IN A TYPICAL Mixed Signal System-on-Chip
FIGURE 15 DIGITAL IP IN MIXED SIGNAL SOC MARKET, 2010 – 2016, BY REVENUE ($MILLION) & VOLUME (MILLION UNITS)
FIGURE 16 DATA CONVERTER IP IN MIXED SIGNAL SOC MARKET, 2010 – 2016, BY REVENUE ($MILLION) & VOLUME (MILLION UNITS)
FIGURE 17 PROCESSOR IP IN MIXED SIGNAL SOC MARKET, 2010 – 2016, BY REVENUE ($MILLION) & VOLUME (MILLION UNITS)
FIGURE 18 ARM PROCESSOR IP IN MIXED SIGNAL SOC MARKET, 2010 – 2016, BY REVENUE ($MILLION) & VOLUME (MILLION UNITS)
FIGURE 19 MIXED SIGNAL SOC PATENTS, BY ASSIGNEE REGION, 2007 – 2011
FIGURE 20 GLOBAL MIXED SIGNAL SOC MARKET ANALYSIS TREE STRUCTURE
FIGURE 21 GLOBAL MIXED SIGNAL SOC MARKET SHARE, 2010 – 2016, BY REVENUE & VOLUME (%)
FIGURE 22 IMPACT ANALYSIS OF DRIVERS
FIGURE 23 IMPACT ANALYSIS OF RESTRAINTS
FIGURE 24 IMPACT ANALYSIS OF OPPORTUNITIES
FIGURE 25 GLOBAL MIXED SIGNAL SOC MARKET TREE STRUCTURE, BY DESIGN ARCHITECTURE
FIGURE 26 Mixed Signal System-on-Chip BACK-END DESIGN FLOW
FIGURE 27 MIXED SIGNAL SOC MARKET, BY TECHNOLOGY NODES TREE STRUCTURE
FIGURE 28 POWER VS PERFORMANCE ASPECTS OF Mixed Signal System-on-Chip NODES
FIGURE 29 TECHNOLOGY NODES – COMPARISON OF HEAT DISSIPATION
FIGURE 30 350 NM MIXED SIGNAL SOC MARKET 2010 – 2016, BY REVENUE ($BILLION) & VOLUME (BILLION UNITS)
FIGURE 31 150 NM MIXED SIGNAL SOC MARKET, 2010 – 2016, BY REVENUE ($BILLION) & VOLUME (BILLION UNITS)
FIGURE 32 250 NM MIXED SIGNAL SOC MARKET, 2010 – 2016, BY REVENUE ($BILLION) & VOLUME (BILLION UNITS)
FIGURE 33 180 NM DEMAND DRIVER FORCES
FIGURE 34 180 NM MIXED SIGNAL SOC MARKET, 2010 – 2016, BY REVENUE ($BILLION) & VOLUME (BILLION UNITS)
FIGURE 35 130 NM MIXED SIGNAL SOC MARKET, 2010 – 2016, BY REVENUE ($BILLION) & VOLUME (BILLION UNITS)
FIGURE 36 90 NM MIXED SIGNAL SOC MARKET, 2010 – 2016, BY REVENUE ($BILLION) & VOLUME (BILLION UNITS)
FIGURE 37 65 NM MIXED SIGNAL SOC MARKET, 2010 – 2016, BY REVENUE ($BILLION) & VOLUME (BILLION UNITS)
FIGURE 38 45 NM SOC MARKET, 2010 – 2016, BY REVENUE ($BILLION) & VOLUME (BILLION UNITS)
FIGURE 39 40 NM SOC MARKET, 2010 – 2016, BY REVENUE ($BILLION) & VOLUME (BILLION UNITS)
FIGURE 40 32 NM SOC MARKET, 2010 – 2016, BY REVENUE ($BILLION) & VOLUME (BILLION UNITS)
FIGURE 41 28 NM SOC MARKET, 2010 – 2016, BY REVENUE ($BILLION) & VOLUME (BILLION UNITS)
FIGURE 42 22 NM SOC MARKET, 2010 – 2016, BY REVENUE ($BILLION) & VOLUME (BILLION UNITS)
FIGURE 43 MIXED SIGNAL SOC MARKET TREE STRUCTURE, BY APPLICATIONS
FIGURE 44 MIXED SIGNAL SOC COMPUTERS MARKET, 2010 – 2016, BY REVENUE ($BILLION) & VOLUME (BILLION UNITS)
FIGURE 45 MIXED SIGNAL SOC ICT MARKET, 2010 – 2016, BY REVENUE ($BILLION) & VOLUME (BILLION UNITS)
FIGURE 46 MIXED SIGNAL SOC CONSUMER ELECTRONICS SECTOR MARKET, 2010 – 2016, BY REVENUE ($BILLION) & VOLUME (BILLION UNITS)
FIGURE 47 MIXED SIGNAL SOC AUTOMOTIVE SECTOR MARKET, 2010 – 2016, BY REVENUE ($BILLION) & VOLUME (BILLION UNITS)
FIGURE 48 MIXED SIGNAL SOC INDUSTRIAL SECTOR MARKET, 2010 – 2016, BY REVENUE ($BILLION) & VOLUME (MILLION UNITS)
FIGURE 49 MIXED SIGNAL SOC MILITARY & AEROSPACE MARKET, 2010 – 2016, BY REVENUE ($BILLION) & VOLUME (MILLION UNITS)
FIGURE 50 MIXED SIGNAL SOC MEDICAL SECTOR MARKET, 2010 – 2016, BY REVENUE ($BILLION) & VOLUME (MILLION UNITS)
FIGURE 51 SMARTFUSION CSOC VALUE CHAIN
FIGURE 52 MIXED SIGNAL SOC RF & OTHERS SECTOR MARKET, 2010 – 2016, BY REVENUE ($BILLION) & VOLUME (MILLION UNITS)
FIGURE 53 MIXED SIGNAL SOC MARKET, BY GEOGRAPHY
FIGURE 54 NORTH AMERICA: MIXED SIGNAL SOC MARKET, 2010 – 2016, BY REVENUE ($BILLION) & VOLUME (BILLION UNITS)
FIGURE 55 EUROPE: MIXED SIGNAL SOC MARKET, 2010 – 2016, BY REVENUE ($BILLION) & VOLUME (BILLION UNITS)
FIGURE 56 JAPAN: MIXED SIGNAL SOC MARKET, 2010 – 2016, BY REVENUE ($BILLION) & VOLUME (BILLION UNITS)
FIGURE 57 APAC: MIXED SIGNAL SOC MARKET, 2010 – 2016, BY REVENUE ($BILLION) & VOLUME (BILLION UNITS)
FIGURE 58 ROW: MIXED SIGNAL SOC MARKET, 2010 – 2016, BY REVENUE ($BILLION) & VOLUME (BILLION UNITS)
FIGURE 59 KEY GROWTH STRATEGIES, 2007 – 2011
FIGURE 60 GLOBAL MIXED SIGNAL SOC MARKET SHARE ANALYSIS OF KEY INDUSTRY PLAYERS, 2010
FIGURE 61 PERCENTAGE OF NET REVENUE OF BROADCOM CORPORATION, 2008 – 2010
FIGURE 62 NVIDIA CORPORATION: MARKET SHARE, BY BUSINESS SEGMENTS, 2011
FIGURE 63 NVIDIA CORPORATION: MARKET SHARE, BY GEOGRAPHY, 2011


Growth opportunities and latent adjacency in Global Mixed Signal System-on-Chip (MxSoC) Market