4
MARKET OVERVIEW
Navigate industrial transformation with smart tech, human-centric automation, and strategic cross-sector alliances.
62
4.2.1.1
ACCELERATING ADOPTION OF INDUSTRY 4.0 AND SMART MANUFACTURING TECHNOLOGIES
4.2.1.2
STRATEGIC GOVERNMENT PROGRAMS ACCELERATING INDUSTRIAL MODERNIZATION
4.2.1.3
INCREASING ADOPTION OF COLLABORATIVE ROBOTS ACROSS INDUSTRIAL OPERATIONS
4.2.1.4
INCREASING FOCUS ON OPERATIONAL EFFICIENCY, SUSTAINABILITY, AND COST OPTIMIZATION
4.2.2.1
HIGH CAPITAL REQUIREMENTS AND LIFECYCLE COSTS OF AUTOMATION SYSTEMS
4.2.2.2
LIMITED FLEXIBILITY IN MANAGING DYNAMIC AND UNSTRUCTURED INDUSTRIAL ENVIRONMENTS
4.2.3.1
EMERGENCE OF INDUSTRY 5.0 AND HUMAN-CENTRIC AUTOMATION
4.2.3.2
EXPANDING ADOPTION OF AUGMENTED REALITY (AR) AND VIRTUAL REALITY (VR) IN INDUSTRIAL OPERATIONS
4.2.3.3
RISING AUTOMATION INVESTMENTS IN ELECTRONICS AND SEMICONDUCTOR MANUFACTURING
4.2.4.1
RISING CYBERSECURITY THREATS IN CONNECTED INDUSTRIAL ENVIRONMENTS
4.2.4.2
MANAGING DATA COMPLEXITY ACROSS INDUSTRIAL ECOSYSTEMS
4.3
INTERCONNECTED MARKETS AND CROSS-SECTOR OPPORTUNITIES
4.4
STRATEGIC MOVES BY TIER-1/2/3 PLAYERS
5
INDUSTRY TRENDS
Navigate competitive pressures and pricing trends shaping the industrial landscape's future.
73
5.1
PORTER’S FIVE FORCES ANALYSIS
5.1.1
THREAT OF NEW ENTRANTS
5.1.2
THREAT OF SUBSTITUTES
5.1.3
BARGAINING POWER OF SUPPLIERS
5.1.4
BARGAINING POWER OF BUYERS
5.1.5
INTENSITY OF COMPETITIVE RIVALRY
5.2
MACROECONOMIC OUTLOOK
5.2.2
GDP TRENDS AND FORECAST
5.2.3
TRENDS IN GLOBAL OIL & GAS INDUSTRY
5.2.4
TRENDS IN GLOBAL AUTOMOTIVE INDUSTRY
5.5.1
PRICING ANALYSIS FOR INDUSTRIAL ROBOTS
5.5.1.1
INDUSTRIAL ROBOTS: PRICING RANGE OF ROBOTS, BY KEY PLAYER
5.5.1.2
INDUSTRIAL ROBOTS: AVERAGE SELLING PRICE AND PRICING TREND, BY TYPE
5.5.1.3
INDUSTRIAL ROBOTS: AVERAGE SELLING PRICE TREND OF ARTICULATED ROBOTS, BY REGION
5.5.2
PRICING ANALYSIS FOR PROCESS ANALYZERS
5.5.2.1
PROCESS ANALYZERS: PRICING RANGE, BY KEY PLAYER, 2025
5.5.2.2
PROCESS ANALYZERS: AVERAGE SELLING PRICE TREND, BY REGION, 2021–2025
5.5.3
PRICING ANALYSIS FOR MACHINE SAFETY COMPONENTS
5.5.3.1
PRICING RANGE OF MACHINE SAFETY COMPONENTS PROVIDED BY KEY PLAYERS, 2025
5.5.4
PRICING ANALYSIS FOR WAREHOUSE MANAGEMENT SYSTEMS
5.5.4.1
PRICING RANGE OF WAREHOUSE MANAGEMENT SYSTEMS, 2025
5.5.4.2
PRICING RANGE OF WAREHOUSE MANAGEMENT SYSTEMS, BY KEY PLAYER, 2025
5.5.5
PRICING ANALYSIS FOR MANUFACTURING EXECUTION SYSTEMS
5.5.5.1
INDICATIVE PRICING OF MES SOFTWARE, BY KEY PLAYER, 2025
5.6.1
IMPORT SCENARIO (HS CODE 847950)
5.6.2
EXPORT SCENARIO (HS CODE 847950)
5.7
TRENDS/DISRUPTIONS IMPACTING CUSTOMER BUSINESS
5.8
INVESTMENT AND FUNDING SCENARIO, 2021–2025
5.9.1
MPW OPTIMIZES WATER TREATMENT BY INSTALLING ENDRESS+HAUSER’S CA80SI SILICA ANALYZER
5.9.2
QISDA ADOPTS TOUCHÉ SOLUTIONS' HUMAN-ROBOT COLLABORATION SAFETY SOLUTION TO MINIMIZE COLLISIONS
5.9.3
OIL & GAS COMPANIES MONITOR EMISSIONS AND ENVIRONMENTAL PERFORMANCE BY USING ABB’S INTEGRATED GAS ANALYZER SYSTEMS
5.10
KEY CONFERENCES AND EVENTS, 2026–2027
5.11
IMPACT OF 2025 US TARIFF – INDUSTRIAL CONTROL AND FACTORY AUTOMATION MARKET
5.11.3
PRICE IMPACT ANALYSIS
5.11.4
IMPACT ON COUNTRIES/REGIONS
5.11.5
IMPACT ON END-USE INDUSTRIES
6
TECHNOLOGICAL ADVANCEMENTS, AI-DRIVEN IMPACT, PATENTS, AND INNOVATIONS
AI-driven innovations revolutionize industrial automation, enhancing connectivity and market readiness through strategic patents.
102
6.1.1
INDUSTRIAL IOT (IIOT) AND SMART CONNECTIVITY
6.1.2
ARTIFICIAL INTELLIGENCE AND PREDICTIVE ANALYTICS
6.2
COMPLEMENTARY TECHNOLOGIES
6.2.1
INDUSTRIAL EDGE COMPUTING
6.2.2
DIGITAL TWINS AND ADVANCED SIMULATION
6.5
IMPACT OF AI ON INDUSTRIAL CONTROL & FACTORY AUTOMATION MARKET
6.6
TOP USE CASES AND MARKET POTENTIAL
6.7
BEST PRACTICES IN INDUSTRIAL CONTROL & FACTORY AUTOMATION MARKET
6.8
CASE STUDIES OF AI IMPLEMENTATION IN INDUSTRIAL CONTROL & FACTORY AUTOMATION MARKET
6.9
INTERCONNECTED ECOSYSTEM AND IMPACT ON MARKET PLAYERS
6.10
CLIENTS’ READINESS TO ADOPT AI IN INDUSTRIAL CONTROL AND FACTORY AUTOMATION MARKET
7
REGULATORY LANDSCAPE
Navigate complex regulations and standards with a comprehensive global regulatory bodies guide.
111
7.1
REGIONAL REGULATIONS AND COMPLIANCE
7.1.1
REGULATORY BODIES, GOVERNMENT AGENCIES, AND OTHER ORGANIZATIONS
8
CUSTOMER LANDSCAPE & BUYER BEHAVIOR
Unlock buyer behavior insights by understanding key stakeholders, criteria, and unmet industry needs.
119
8.1
DECISION-MAKING PROCESS
8.2
KEY STAKEHOLDERS AND BUYING CRITERIA
8.2.1
KEY STAKEHOLDERS IN BUYING PROCESS
8.3
ADOPTION BARRIERS & INTERNAL CHALLENGES
8.4
UNMET NEEDS OF VARIOUS END USERS
9
INDUSTRIAL CONTROL & FACTORY AUTOMATION MARKET, BY COMPONENT
Market Size & Growth Rate Forecast Analysis to 2032 in USD Million and Units | 406 Data Tables
125
9.2
INDUSTRIAL CONTROL SYSTEMS
9.2.1
SUPERVISORY CONTROL AND DATA ACQUISITION SYSTEMS
9.2.1.1.1
DIRECT COMMUNICATION WITH INDUSTRIAL DEVICES TO ENABLE EFFICIENT MONITORING AND CONTROL
9.2.1.2.1
INTELLIGENT MONITORING AND OPERATIONAL VISIBILITY FEATURES TO DRIVE GROWTH
9.2.1.3.1
INDUSTRIAL FACILITIES LEVERAGE SCADA SERVICES TO MINIMIZE DOWNTIME AND IMPROVE PERFORMANCE
9.2.1.3.2
PROFESSIONAL SERVICES`
9.2.1.3.3
MANAGED SERVICES
9.2.2
DISTRIBUTED CONTROL SYSTEMS
9.2.2.1.1
ANALYZE DATA AND HELP IDENTIFY PRECISE LOCATIONS FOR REPAIR
9.2.2.2.1
INCREASE IN INDUSTRIAL AUTOMATION PROJECTS TO DRIVE MARKET
9.2.2.3.1
NEED FOR PLANT OPTIMIZATION ACROSS INDUSTRIES TO DRIVE GROWTH
9.2.3
PROGRAMMABLE LOGIC CONTROLLERS
9.2.4.1.1
RISING ADOPTION OF HUMAN-MACHINE INTERFACE (HMI) SOLUTIONS TO SUPPORT DEMAND
9.2.4.2.1
GROWING ADOPTION OF RACK MOUNT IPCS FOR CENTRALIZED INDUSTRIAL COMPUTING APPLICATIONS TO DRIVE MARKET
9.2.4.3.1
NEED FOR RELIABLE AND MAINTENANCE-FREE INDUSTRIAL COMPUTING SOLUTIONS TO DRIVE ADOPTION
9.2.4.4.1
RISING DEPLOYMENT OF EMBEDDED IPCS IN IOT-ENABLED INDUSTRIAL APPLICATIONS TO SUPPORT MARKET GROWTH
9.2.5
HUMAN MACHINE INTERFACE
9.2.5.1.3
ADVANCED PANEL-BASED HMI
9.2.5.1.4
ADVANCED PC-BASED HMI
9.2.5.1.5
OTHER HARDWARE TYPES
9.3.1
MANUFACTURING EXECUTION SYSTEM
9.3.2
PLANT ASSET MANAGEMENT
9.3.3
WAREHOUSE MANAGEMENT SYSTEM
9.3.3.2.1
ADVANCED (TIER 1)
9.3.3.2.2
INTERMEDIATE (TIER 2)
9.3.4
MANUFACTURING OPERATION MANAGEMENT
9.3.5
CLOUD ENTERPRISE RESOURCE PLANNING
9.3.5.1.2
PROFESSIONAL SERVICES
9.3.6
QUALITY MANAGEMENT SYSTEM
9.4.1.1
CRITICAL ROLE OF HARDWARE COMPONENTS IN STRENGTHENING CNC CONTROLLER SYSTEMS TO PROPEL MARKET
9.4.2
SOFTWARE & SERVICES
9.4.2.1
UPGRADED SOFTWARE SOLUTIONS AND ADDITIONAL SERVICES ENHANCE MANUFACTURING EFFICIENCY AND ACCURACY
9.4.2.1.1
INSTALLATION AND COMMISSIONING
9.4.2.1.2
RETROFITTING AND RECONDITIONING
9.5.1.1
TRADITIONAL ROBOTS
9.5.1.1.1
EXPANSION OF HIGH VOLUME MANUFACTURING OPERATIONS DRIVES GREATER ADOPTION OF TRADITIONAL INDUSTRIAL ROBOTS
9.5.1.1.2
ARTICULATED ROBOTS
9.5.1.1.4
PARALLEL ROBOTS
9.5.1.1.5
CARTESIAN ROBOTS
9.5.1.1.6
CYLINDRICAL ROBOTS
9.5.1.1.7
OTHER TRADITIONAL ROBOTS
9.5.1.2
COLLABORATIVE ROBOTS
9.5.1.2.1
EASE OF USE AND LOW-COST DEPLOYMENT TO DRIVE MARKET
9.5.2
ROBOT END EFFECTORS
9.6
INDUSTRIAL 3D PRINTING
9.6.1.1
PRIMARY HARDWARE COMPONENT USED IN INDUSTRIAL ADDITIVE MANUFACTURING
9.6.2.1
MANUFACTURERS ARE INVESTING IN R&D FOR DEVELOPING NEW MATERIALS TO MEET GROWING DEMAND FOR 3D-PRINTED PRODUCTS
9.6.3.1
SOFTWARE PROGRAMS ARE REQUIRED TO DEVELOP 3D DIGITAL MODELS
9.6.4.1
3D PRINTING TECHNOLOGY IS CHANGING HOW COMPANIES PRODUCE AND ADD VALUE TO THEIR PRODUCTS THROUGH SERVICES
9.7.1.1.1
ADVANCEMENTS IN SENSOR TECHNOLOGY TO FUEL MARKET GROWTH
9.7.1.2
CARBON DIOXIDE ANALYZERS
9.7.1.2.1
NEED FOR ACCURATE MONITORING OF CO2 LEVELS TO DRIVE MARKET
9.7.1.3
MOISTURE ANALYZERS
9.7.1.3.1
GROWING IMPORTANCE OF MOISTURE CONTROL IN INDUSTRIES TO FOSTER GROWTH
9.7.1.4
TOXIC GAS ANALYZERS
9.7.1.4.1
ADVANCED SENSOR TECHNOLOGY AND INTEGRATION OF IOT TO CREATE LUCRATIVE GROWTH OPPORTUNITIES
9.7.1.5
HYDROGEN SULFIDE ANALYZERS
9.7.1.5.1
INCREASING FOCUS ON REDUCING ENVIRONMENTAL IMPACT TO BOOST SEGMENTAL GROWTH
9.7.2.1.1
DEMAND IN REVERSE OSMOSIS AND COOLING PROCESSES TO FUEL SEGMENTAL GROWTH
9.7.2.2
CONDUCTIVITY ANALYZERS
9.7.2.2.1
DEMAND IN PHARMACEUTICALS SECTOR TO IMPROVE PROCESS EFFICIENCY TO PROPEL MARKET
9.7.2.3
TURBIDITY ANALYZERS
9.7.2.3.1
NEED FOR ACCURATE TURBIDITY MEASUREMENT IN WASTEWATER TREATMENT FACILITIES TO ACCELERATE GROWTH
9.7.2.4
DISSOLVED OXYGEN ANALYZERS
9.7.2.4.1
ADOPTION OF WATER MONITORING APPLICATIONS TO CONTRIBUTE TO MARKET GROWTH
9.7.2.5
LIQUID DENSITY ANALYZERS
9.7.2.5.1
DEPLOYMENT OF IOT TECHNOLOGY IN LIQUID DENSITY ANALYZERS TO PROPEL GROWTH
9.7.2.6.1
WIDELY USED TO OPTIMIZE WASTEWATER TREATMENT
9.7.2.7.1
ADOPTION OF TOC ANALYZERS TO ENSURE COMPLIANCE WITH PHARMACEUTICALS MANUFACTURING STANDARDS TO BOOST GROWTH
9.8
FIELD INSTRUMENTATION
9.8.1.1
GROWING APPLICATION IN PETROCHEMICALS AND WATER & WASTEWATER TREATMENT INDUSTRIES TO DRIVE DEMAND
9.8.2
PRESSURE TRANSMITTERS
9.8.2.1
RISING OIL & GAS EXPLORATION ACTIVITIES TO DRIVE MARKET
9.8.3
TEMPERATURE TRANSMITTERS
9.8.3.1
INCREASING USE IN PHARMACEUTICALS MANUFACTURING TO BOOST DEMAND
9.9.1.1
INCREASING DEMAND FOR CLEAN WATER AND WASTEWATER TREATMENT TO DRIVE MARKET
9.9.2.1
BROAD RANGE OF APPLICATIONS IN VARIOUS INDUSTRIES TO DRIVE MARKET
9.9.3.1
GROWING NEED FOR EFFICIENT WATER AND ENERGY MANAGEMENT TO DRIVE MARKET
9.9.4
DIFFERENTIAL PRESSURE
9.9.4.1
HIGH RELIABILITY AND ACCURACY OF DIFFERENTIAL PRESSURE TO DRIVE MARKET
9.9.4.6
VARIABLE AREA METERS
9.9.4.7
AVERAGING PITOT TUBES
9.9.5
POSITIVE DISPLACEMENT
9.9.5.1
DEMAND FOR COST-EFFECTIVE FLOW METERS IN APPLICATIONS REQUIRING HIGH ACCURACY TO DRIVE GROWTH
9.9.5.2
PISTON FLOW METERS
9.9.5.3
OSCILLATING PISTON METERS
9.9.5.4
HELICAL FLOW METERS
9.9.5.6
ROTARY VANE METERS
9.9.6.1
INDUSTRIAL AUTOMATION AND PROCESS OPTIMIZATION TO DRIVE MARKET
9.9.7.1
LOW INITIAL SETUP COST TO DRIVE MARKET
9.9.8.1
THERMAL FLOW METERS
9.9.8.2
MULTIPHASE FLOW METERS
9.10
INDUSTRIAL COMMUNICATION
9.10.1.1.1
OFFERS HIGH SECURITY AND DURABILITY FOR RELIABLE NETWORK CONNECTIONS BETWEEN INTERCONNECTED COMPUTERS
9.10.1.2.1
INNOVATIVE GATEWAYS TO SUPPORT INDUSTRY 4.0 AND SMART FACTORY APPLICATIONS TO DRIVE MARKET
9.10.1.3.1
COMPATIBILITY WITH 5G TECHNOLOGY IN ROUTERS SUPPORTS SEAMLESS INDUSTRIAL COMMUNICATIONS
9.10.1.4
CONTROLLERS & CONNECTORS
9.10.1.4.1
CRITICAL FOR DETERMINING PRIORITIES OF TASKS AND INTERRUPTIONS
9.10.1.5
COMMUNICATION INTERFACES & CONVERTERS
9.10.1.5.1
ENABLES COMMUNICATION BETWEEN DISSIMILAR MEDIA TYPES
9.10.1.6
POWER SUPPLY DEVICES
9.10.1.6.1
HIGH-PERFORMANCE INTEGRATED PMICS USEFUL IN COMMUNICATIONS POWER MANAGEMENT
9.10.1.7
OTHER INDUSTRIAL COMMUNICATION OFFERINGS
9.10.2.1
NETWORKING MANAGEMENT SOFTWARE OPTIMIZES NETWORK EFFICIENCY AND MINIMIZES TOTAL COST OF OWNERSHIP
9.10.3.1
INDUSTRIAL COMMUNICATION SERVICES SUPPORT INTEGRATION OF DEVICES, MACHINES, AND SYSTEMS WITHIN IIOT ECOSYSTEM
9.11
INDUSTRIAL MONITORING & SAFETY
9.11.1
INDUSTRIAL SENSORS
9.11.1.1.1
CONTACT SENSORS
9.11.1.1.2
NON-CONTACT SENSORS
9.11.1.2.2
TEMPERATURE SENSORS
9.11.1.2.5
POSITION SENSORS
9.11.1.2.6
PRESSURE SENSORS
9.11.1.2.8
HUMIDITY AND MOISTURE SENSORS
9.11.2
MACHINE CONDITION MONITORING
9.11.2.1.1
NEED FOR REAL-TIME DATA REGARDING VARIATIONS IN MACHINE PERFORMANCE FOR PROMPT DECISION-MAKING TO DRIVE MARKET
9.11.2.2.1
COST-EFFECTIVENESS AND MAXIMIZED PRODUCTION OUTPUT TO BOOST DEMAND
9.11.3.1.1
PRESENCE DETECTION SENSORS
9.11.3.1.2
PROGRAMMABLE SAFETY SYSTEMS
9.11.3.1.3
SAFETY CONTROLLERS/MODULES/RELAYS
9.11.3.1.4
SAFETY INTERLOCK SWITCHES
9.11.3.1.5
EMERGENCY STOP CONTROLS
9.11.3.1.6
TWO-HAND SAFETY CONTROLS
9.11.4
SOLID-STATE RELAYS
9.11.4.1
BY MOUNTING TYPE
9.11.4.1.4
OTHER MOUNTING TYPES
9.11.4.2.1
REED-RELAY-COUPLED SSR
9.11.4.2.2
TRANSFORMER-COUPLED SSR
9.11.4.2.3
OPTO-COUPLED SSR
9.11.4.2.4
OTHER SSR TYPES
9.11.5
MACHINE VISION SYSTEMS
9.11.5.1.2
FRAME GRABBERS
9.11.5.1.7
OTHER HARDWARE COMPONENTS
9.11.5.2.1
PC-BASED MACHINE VISION SYSTEMS
9.11.5.2.2
SMART CAMERA-BASED MACHINE VISION SYSTEMS
9.11.6
PREDICTIVE MAINTENANCE
10
INDUSTRIAL CONTROL & FACTORY AUTOMATION MARKET, BY INDUSTRY
Market Size & Growth Rate Forecast Analysis to 2032 in USD Million | 2 Data Tables
337
10.2.1
ADOPTION OF DIGITAL OILFIELD AND ASSET MONITORING SOLUTIONS TO DRIVE GROWTH
10.3.1
INCREASING ADOPTION OF PROCESS AUTOMATION AND DISTRIBUTED CONTROL SYSTEMS TO DRIVE MARKET
10.4.1
INCREASING ADOPTION OF DIGITAL PROCESS AUTOMATION AND ADVANCED CONTROL SYSTEMS TO PROPEL MARKET
10.5.1
INCREASING ADOPTION OF DIGITAL MANUFACTURING AND AUTOMATION SOLUTIONS TO SUPPORT MARKET GROWTH
10.6.1
INCREASING ADOPTION OF PREDICTIVE MAINTENANCE AND AUTONOMOUS MINING TECHNOLOGIES TO DRIVE MARKET
10.7.1
INCREASING ADOPTION OF SMART MANUFACTURING AND AUTOMATION TECHNOLOGIES TO PROPEL MARKET
10.8.1
INCREASING ADOPTION OF SMART CONTROL SYSTEMS TO IMPROVE EFFICIENCY AND GRID RELIABILITY TO DRIVE MARKET
10.9.1
INCREASING ADOPTION OF ROBOTICS TECHNOLOGIES TO DRIVE PRODUCTIVITY AND SAFETY IN AUTOMOTIVE MANUFACTURING
10.10.1
INCREASING ADOPTION OF ADVANCED AUTOMATION AND DIGITAL MANUFACTURING TECHNOLOGIES TO SUPPORT AEROSPACE PRODUCTION EFFICIENCY
10.11
SEMICONDUCTOR & ELECTRONICS
10.11.1
INCREASING ADOPTION OF SMART MANUFACTURING AND SUPPLY CHAIN AUTOMATION TECHNOLOGIES TO DRIVE MARKET
10.12.1
INCREASING ADOPTION OF AI-ENABLED PREDICTIVE MAINTENANCE AND SMART MANUFACTURING TECHNOLOGIES TO PROPEL MARKET
10.13.1
INCREASING ADOPTION OF COLLABORATIVE ROBOTICS AND LABORATORY AUTOMATION TECHNOLOGIES TO DRIVE GROWTH
11
INDUSTRIAL CONTROL & FACTORY AUTOMATION MARKET, BY REGION
Comprehensive coverage of 11 Regions with country-level deep-dive of 11 Countries | 22 Data Tables.
350
11.2.1.1
GROWING ADOPTION OF INDUSTRIAL AUTOMATION TECHNOLOGIES TO DRIVE OPERATIONAL EFFICIENCY AND MANUFACTURING PRODUCTIVITY
11.2.2.1
INCREASING ADOPTION OF ADVANCED AUTOMATION TECHNOLOGIES TO SUPPORT GROWTH ACROSS KEY MANUFACTURING INDUSTRIES
11.2.3.1
EXPANSION OF MANUFACTURING INDUSTRIES TO ACCELERATE ADOPTION OF INDUSTRIAL AUTOMATION AND SMART FACTORY TECHNOLOGIES
11.3.1.1
GOVERNMENT INITIATIVES SUPPORT ADOPTION OF IOT AND SMART MANUFACTURING TECHNOLOGIES ACROSS INDUSTRIES
11.3.2.1
INCREASING ADOPTION OF INDUSTRIAL ROBOTICS AND SMART FACTORY TECHNOLOGIES TO DRIVE MARKET
11.3.3.1
INCREASING INVESTMENTS IN AI, SMART MANUFACTURING, AND INDUSTRIAL MODERNIZATION TO SUPPORT MARKET GROWTH
11.3.4.1
INCREASING INVESTMENTS IN INDUSTRY 4.0, SMART MANUFACTURING, AND FACTORY MODERNIZATION TO SUPPORT MARKET GROWTH
11.4.1.1
GROWING INVESTMENTS IN SMART MANUFACTURING AND INDUSTRIAL ROBOTICS TO DRIVE ADOPTION
11.4.2.1
INCREASING ADOPTION OF SMART MANUFACTURING AND ADVANCED AUTOMATION TECHNOLOGIES TO DRIVE MARKET GROWTH
11.4.3.1
GOVERNMENT INITIATIVES AND INDUSTRIAL MODERNIZATION EFFORTS TO ACCELERATE AUTOMATION ADOPTION ACROSS INDUSTRIES
11.4.4
REST OF ASIA PACIFIC
11.5
REST OF THE WORLD (ROW)
11.5.1
MIDDLE EAST & AFRICA
11.5.1.1.1
GOVERNMENT-LED SMART MANUFACTURING AND INDUSTRY 4.0 INITIATIVES TO ACCELERATE INDUSTRIAL AUTOMATION ADOPTION
11.5.1.2
REST OF MIDDLE EAST & AFRICA
11.5.2.1.1
GOVERNMENT INITIATIVES AND INDUSTRY 4.0 INVESTMENTS TO DRIVE ADOPTION OF INDUSTRIAL AUTOMATION TECHNOLOGIES
11.5.2.2
REST OF SOUTH AMERICA
12
COMPETITIVE LANDSCAPE
Uncover strategic shifts and market dominance trends shaping industry leaders in process analyzers and machine safety.
378
12.2
KEY PLAYER STRATEGIES/RIGHT TO WIN, 2023−2026
12.3
REVENUE ANALYSIS, 2021–2025
12.4
MARKET SHARE ANALYSIS, 2025
12.4.1
MARKET SHARE ANALYSIS FOR PROCESS ANALYZERS, 2025
12.4.2
MARKET SHARE ANALYSIS FOR MACHINE SAFETY, 2025
12.5
COMPANY VALUATION AND FINANCIAL METRICS
12.5.1
COMPANY VALUATION FOR PROCESS ANALYZERS MARKET
12.5.2
FINANCIAL METRICS FOR PROCESS ANALYZERS MARKET
12.5.3
COMPANY VALUATION FOR MACHINE SAFETY MARKET
12.5.4
FINANCIAL METRICS FOR MACHINE SAFETY MARKET
12.6.1
BRAND COMPARISON FOR PROCESS ANALYZERS MARKET
12.6.2
BRAND COMPARISON FOR MACHINE SAFETY MARKET
12.7
COMPANY EVALUATION MATRIX: KEY PLAYERS, 2025
12.7.5
PROCESS ANALYZERS: COMPANY FOOTPRINT OF KEY PLAYERS, 2025
12.7.5.1
PROCESS ANALYZERS MARKET: COMPANY FOOTPRINT
12.7.5.2
PROCESS ANALYZER MARKET: REGION FOOTPRINT
12.7.5.3
PROCESS ANALYZERS MARKET: LIQUID ANALYZER TYPE FOOTPRINT
12.7.5.4
PROCESS ANALYZERS MARKET: GAS ANALYZER TYPE FOOTPRINT
12.7.5.5
PROCESS ANALYZERS MARKET: INDUSTRY FOOTPRINT
12.7.6
MACHINE SAFETY MARKET: COMPANY FOOTPRINT OF KEY PLAYERS, 2025
12.7.6.1
MACHINE SAFETY MARKET: COMPANY FOOTPRINT
12.7.6.2
MACHINE SAFETY MARKET: REGION FOOTPRINT
12.7.6.3
MACHINE SAFETY MARKET: INDUSTRY FOOTPRINT
12.7.6.4
MACHINE SAFETY MARKET: OFFERING FOOTPRINT
12.7.6.5
MACHINE SAFETY MARKET: COMPONENT FOOTPRINT
12.8
COMPANY EVALUATION MATRIX: STARTUPS/SMES, 2025
12.8.1
PROGRESSIVE COMPANIES
12.8.2
RESPONSIVE COMPANIES
12.8.5
COMPETITIVE BENCHMARKING: STARTUPS/SMES, 2025
12.8.5.1
DETAILED LIST OF KEY STARTUPS/SMES
12.8.5.2
PROCESS ANALYZERS MARKET: COMPETITIVE BENCHMARKING OF KEY STARTUPS/SMES
12.8.5.3
MACHINE SAFETY MARKET: COMPETITIVE BENCHMARKING OF KEY STARTUPS/SMES
12.9
COMPETITIVE SCENARIO
13
COMPANY PROFILES
In-depth Company Profiles of Leading Market Players with detailed Business Overview, Product and Service Portfolio, Recent Developments, and Unique Analyst Perspective (MnM View)
420
13.1.1.1
BUSINESS OVERVIEW
13.1.1.2
PRODUCTS/SOLUTIONS/SERVICES OFFERED
13.1.1.3
RECENT DEVELOPMENTS
13.1.1.3.1
PRODUCT LAUNCHES/DEVELOPMENTS
13.1.1.4.1
KEY STRENGTHS/RIGHT TO WIN
13.1.1.4.2
STRATEGIC CHOICES
13.1.1.4.3
WEAKNESSES/COMPETITIVE THREATS
13.1.3
HONEYWELL INTERNATIONAL INC.
13.1.4
SCHNEIDER ELECTRIC
13.1.5
ROCKWELL AUTOMATION
13.1.6
EMERSON ELECTRIC CO.
13.1.7
YOKOGAWA ELECTRIC CORPORATION
13.1.9
MITSUBISHI ELECTRIC CORPORATION
13.1.10
OMRON CORPORATION
13.1.12
ENDRESS+HAUSER GROUP SERVICES AG
13.2.1
FUJI ELECTRIC CO., LTD.
13.2.3
KROHNE MESSTECHNIK GMBH
13.3.1
WIKA ALEXANDER WIEGAND SE & CO. KG
13.3.2
DWYER INSTRUMENTS, LLC
13.3.5
VEGA GRIESHABER KG
13.3.13
ADDVERB TECHNOLOGIES LIMITED
13.3.15
EIRATECH ROBOTICS LTD.
13.3.18
TEGAN INNOVATIONS
13.3.20
NOVA ANALYTICAL SYSTEMS
13.3.22
INDUCTIVE AUTOMATION, LLC
13.3.23
BECKHOFF AUTOMATION
13.3.24
ACNODES CORPORATION
13.3.25
ADITECH ICT PVT. LTD.
13.3.26
BREEZE TECHNOLOGIES
13.3.28
BANNER ENGINEERING CORP.
13.3.31
PILZ GMBH & CO. KG
13.3.32
QUALITAS TECHNOLOGIES
13.3.33
ING. PUNZENBERGER COPA-DATA GMBH
13.3.34
SPRECHER AUTOMATION GMBH
13.3.35
EPICOR SOFTWARE CORPORATION
13.3.37
CRYSTAL INSTRUMENTS
13.3.39
AEGIS INDUSTRIAL SOFTWARE CORPORATION
14
RESEARCH METHODOLOGY
521
14.1.1.1
LIST OF MAJOR SECONDARY SOURCES
14.1.1.2
KEY DATA FROM SECONDARY SOURCES
14.1.2.1
LIST OF KEY INTERVIEW PARTICIPANTS
14.1.2.2
BREAKDOWN OF PRIMARIES
14.1.2.3
KEY INDUSTRY INSIGHTS
14.1.2.4
KEY DATA FROM PRIMARY SOURCES
14.1.3
SECONDARY AND PRIMARY RESEARCH
14.2
MARKET SIZE ESTIMATION METHODOLOGY
14.2.1
BOTTOM-UP APPROACH
14.2.1.1
APPROACH TO ARRIVE AT MARKET SIZE USING BOTTOM-UP APPROACH (DEMAND SIDE)
14.2.2.1
APPROACH TO ARRIVE AT MARKET SIZE USING TOP-DOWN APPROACH (SUPPLY SIDE)
14.3
MARKET BREAKDOWN AND DATA TRIANGULATION
14.4
RESEARCH ASSUMPTIONS
14.5
LIMITATIONS AND RISK ASSESSMENT
15.2
KNOWLEDGESTORE: MARKETSANDMARKETS’ SUBSCRIPTION PORTAL
15.3
CUSTOMIZATION OPTIONS
TABLE 1
INDUSTRIAL CONTROL & FACTORY AUTOMATION MARKET: INCLUSION/EXCLUSION DETAILS
TABLE 2
SUMMARY OF CHANGES MADE IN UPDATED REPORT VERSION
TABLE 3
INTERCONNECTED MARKETS AND CROSS-SECTOR OPPORTUNITIES
TABLE 4
STRATEGIC FOCUS OF MAJOR COMPANIES IN INDUSTRIAL CONTROL & FACTORY AUTOMATION MARKET
TABLE 5
INDUSTRIAL CONTROL & FACTORY AUTOMATION MARKET: PORTER’S FIVE FORCES ANALYSIS
TABLE 6
GDP PERCENTAGE CHANGE, BY KEY COUNTRY, 2021–2030
TABLE 7
ROLE OF PLAYERS IN ECOSYSTEM
TABLE 8
INDUSTRIAL ROBOTS: PRICING RANGE OF ROBOTS, BY KEY PLAYER, 2025 (USD)
TABLE 9
TRADITIONAL INDUSTRIAL ROBOTS: PRICING RANGE, BY TYPE, 2025
TABLE 10
PRICING RANGE OF PROCESS ANALYZERS, BY KEY PLAYER, 2025 (USD)
TABLE 11
PROCESS ANALYZERS: AVERAGE SELLING PRICE TREND, BY REGION, 2021–2025 (USD)
TABLE 12
PRICING RANGE OF MACHINE SAFETY COMPONENTS PROVIDED BY KEY PLAYERS, 2025 (USD)
TABLE 13
PRICING RANGE OF WAREHOUSE MANAGEMENT SYSTEMS, 2025 (USD)
TABLE 14
PRICING RANGE OF WAREHOUSE MANAGEMENT SYSTEMS PROVIDED BY KEY PLAYERS, 2025 (USD)
TABLE 15
INDICATIVE PRICING OF MES SOFTWARE SUBSCRIPTIONS PER MONTH OFFERED BY KEY PLAYERS, 2025 (USD)
TABLE 16
IMPORT DATA FOR HS CODE 847950-COMPLIANT PRODUCTS, BY COUNTRY, 2021–2025 (USD MILLION)
TABLE 17
EXPORT DATA FOR HS CODE 847950-COMPLIANT PRODUCTS, BY COUNTRY, 2021–2025 (USD MILLION)
TABLE 18
IMPLEMENTATION OF LIQUILINE SYSTEM CA80SI SILICA ANALYZER BY MPW TO IMPROVE OPERATIONAL RELIABILITY AND EFFICIENCY
TABLE 19
IMPLEMENTATION OF T-SKIN HUMAN-ROBOT COLLABORATION SAFETY SOLUTION BY QISDA TO IMPROVE OPERATIONAL SAFETY AND PRODUCTIVITY
TABLE 20
UTILIZATION OF INTEGRATED GAS ANALYZER SYSTEMS BY OIL & GAS COMPANIES TO IMPROVE OPERATIONAL EFFICIENCY
TABLE 21
INDUSTRIAL CONTROL & FACTORY AUTOMATION MARKET: LIST OF CONFERENCES AND EVENTS, 2026–2027
TABLE 22
US-ADJUSTED RECIPROCAL TARIFF RATES
TABLE 23
INDUSTRIAL CONTROL & FACTORY AUTOMATION MARKET: TECHNOLOGY ROADMAP
TABLE 24
LIST OF MAJOR PATENTS, 2022–2025
TABLE 25
TOP USE CASES AND MARKET POTENTIAL
TABLE 26
BEST PRACTICES: COMPANIES IMPLEMENTING USE CASES
TABLE 27
INDUSTRIAL CONTROL & FACTORY AUTOMATION MARKET: CASE STUDIES RELATED TO AI IMPLEMENTATION
TABLE 28
INTERCONNECTED ECOSYSTEM AND IMPACT ON MARKET PLAYERS
TABLE 29
NORTH AMERICA: LIST OF REGULATORY BODIES, GOVERNMENT AGENCIES, AND OTHER ORGANIZATIONS
TABLE 30
EUROPE: LIST OF REGULATORY BODIES, GOVERNMENT AGENCIES, AND OTHER ORGANIZATIONS
TABLE 31
ASIA PACIFIC: LIST OF REGULATORY BODIES, GOVERNMENT AGENCIES, AND OTHER ORGANIZATIONS
TABLE 32
ROW: LIST OF REGULATORY BODIES, GOVERNMENT AGENCIES, AND OTHER ORGANIZATIONS
TABLE 33
INDUSTRIAL CONTROL & FACTORY AUTOMATION MARKET: INDUSTRY STANDARDS
TABLE 34
INFLUENCE OF STAKEHOLDERS ON BUYING PROCESS TOP 3 INDUSTRIES (%)
TABLE 35
KEY BUYING CRITERIA FOR TOP 3 INDUSTRIES
TABLE 36
UNMET NEEDS IN INDUSTRIAL CONTROL & FACTORY AUTOMATION MARKET, BY END USER
TABLE 37
INDUSTRIAL CONTROL & FACTORY AUTOMATION MARKET, BY COMPONENT, 2022–2025 (USD MILLION)
TABLE 38
INDUSTRIAL CONTROL & FACTORY AUTOMATION MARKET, BY COMPONENT, 2026–2032 (USD MILLION)
TABLE 39
INDUSTRIAL CONTROL SYSTEMS: INDUSTRIAL CONTROL & FACTORY AUTOMATION MARKET, BY TYPE, 2022–2025 (USD MILLION)
TABLE 40
INDUSTRIAL CONTROL SYSTEMS: INDUSTRIAL CONTROL & FACTORY AUTOMATION MARKET, BY TYPE, 2026–2032 (USD MILLION)
TABLE 41
INDUSTRIAL CONTROL SYSTEMS: INDUSTRIAL CONTROL & FACTORY AUTOMATION MARKET, BY REGION, 2022–2025 (USD MILLION)
TABLE 42
INDUSTRIAL CONTROL SYSTEMS: INDUSTRIAL CONTROL & FACTORY AUTOMATION MARKET, BY REGION, 2026–2032 (USD MILLION)
TABLE 43
INDUSTRIAL CONTROL SYSTEMS: INDUSTRIAL CONTROL & FACTORY AUTOMATION MARKET, BY INDUSTRY, 2022–2025 (USD MILLION)
TABLE 44
INDUSTRIAL CONTROL SYSTEMS: INDUSTRIAL CONTROL & FACTORY AUTOMATION MARKET, BY INDUSTRY, 2026–2032 (USD MILLION)
TABLE 45
SCADA: INDUSTRIAL CONTROL & FACTORY AUTOMATION MARKET, BY OFFERING, 2022–2025 (USD MILLION)
TABLE 46
SCADA: INDUSTRIAL CONTROL & FACTORY AUTOMATION MARKET, BY OFFERING, 2026–2032 (USD MILLION)
TABLE 47
SCADA: INDUSTRIAL CONTROL & FACTORY AUTOMATION MARKET, BY SOFTWARE, 2022–2025 (USD MILLION)
TABLE 48
SCADA: INDUSTRIAL CONTROL & FACTORY AUTOMATION MARKET, BY SOFTWARE, 2026–2032 (USD MILLION)
TABLE 49
SCADA: INDUSTRIAL CONTROL & FACTORY AUTOMATION MARKET, BY SERVICE, 2022–2025 (USD MILLION)
TABLE 50
SCADA: INDUSTRIAL CONTROL & FACTORY AUTOMATION MARKET, BY SERVICE, 2026–2032 (USD MILLION)
TABLE 51
SCADA: INDUSTRIAL CONTROL & FACTORY AUTOMATION MARKET, BY INDUSTRY, 2022–2025 (USD MILLION)
TABLE 52
SCADA: INDUSTRIAL CONTROL & FACTORY AUTOMATION MARKET, BY INDUSTRY, 2026–2032 (USD MILLION)
TABLE 53
SCADA: INDUSTRIAL CONTROL & FACTORY AUTOMATION MARKET, BY REGION, 2022–2025 (USD MILLION)
TABLE 54
SCADA: INDUSTRIAL CONTROL & FACTORY AUTOMATION MARKET, BY REGION, 2026–2032 (USD MILLION)
TABLE 55
SCADA: INDUSTRIAL CONTROL & FACTORY AUTOMATION MARKET IN NORTH AMERICA, BY COUNTRY, 2022–2025 (USD MILLION)
TABLE 56
SCADA: INDUSTRIAL CONTROL & FACTORY AUTOMATION MARKET IN NORTH AMERICA, BY COUNTRY, 2026–2032 (USD MILLION)
TABLE 57
SCADA: INDUSTRIAL CONTROL & FACTORY AUTOMATION MARKET IN EUROPE, BY COUNTRY, 2022–2025 (USD MILLION)
TABLE 58
SCADA: INDUSTRIAL CONTROL & FACTORY AUTOMATION MARKET IN EUROPE, BY COUNTRY, 2026–2032 (USD MILLION)
TABLE 59
SCADA: INDUSTRIAL CONTROL & FACTORY AUTOMATION MARKET IN ASIA PACIFIC, BY COUNTRY, 2022–2025 (USD MILLION)
TABLE 60
SCADA: INDUSTRIAL CONTROL & FACTORY AUTOMATION MARKET IN ASIA PACIFIC, BY COUNTRY, 2026–2032 (USD MILLION)
TABLE 61
SCADA: INDUSTRIAL CONTROL & FACTORY AUTOMATION MARKET IN ROW, BY REGION, 2022–2025 (USD MILLION)
TABLE 62
SCADA: INDUSTRIAL CONTROL & FACTORY AUTOMATION MARKET IN ROW, BY REGION, 2026–2032 (USD MILLION)
TABLE 63
DCS: INDUSTRIAL CONTROL & FACTORY AUTOMATION MARKET, BY INDUSTRY, 2022–2025 (USD MILLION)
TABLE 64
DCS: INDUSTRIAL CONTROL & FACTORY AUTOMATION MARKET, BY INDUSTRY, 2026–2032 (USD MILLION)
TABLE 65
DCS: INDUSTRIAL CONTROL & FACTORY AUTOMATION MARKET, BY REGION, 2022–2025 (USD MILLION)
TABLE 66
DCS: INDUSTRIAL CONTROL & FACTORY AUTOMATION MARKET, BY REGION, 2026–2032 (USD MILLION)
TABLE 67
DCS: INDUSTRIAL CONTROL & FACTORY AUTOMATION MARKET IN NORTH AMERICA, BY COUNTRY, 2022–2025 (USD MILLION)
TABLE 68
DCS: INDUSTRIAL CONTROL & FACTORY AUTOMATION MARKET IN NORTH AMERICA, BY COUNTRY, 2026–2032 (USD MILLION)
TABLE 69
DCS: INDUSTRIAL CONTROL & FACTORY AUTOMATION MARKET IN EUROPE, BY COUNTRY, 2022–2025 (USD MILLION)
TABLE 70
DCS: INDUSTRIAL CONTROL & FACTORY AUTOMATION MARKET IN EUROPE, BY COUNTRY, 2026–2032 (USD MILLION)
TABLE 71
DCS: INDUSTRIAL CONTROL & FACTORY AUTOMATION MARKET IN ASIA PACIFIC, BY COUNTRY, 2022–2025 (USD MILLION)
TABLE 72
DCS: INDUSTRIAL CONTROL & FACTORY AUTOMATION MARKET IN ASIA PACIFIC, BY COUNTRY, 2026–2032 (USD MILLION)
TABLE 73
DCS: INDUSTRIAL CONTROL & FACTORY AUTOMATION MARKET IN ROW, BY REGION, 2022–2025 (USD MILLION)
TABLE 74
DCS: INDUSTRIAL CONTROL & FACTORY AUTOMATION MARKET IN ROW, BY REGION, 2026–2032 (USD MILLION)
TABLE 75
PLC: INDUSTRIAL CONTROL & FACTORY AUTOMATION MARKET, BY INDUSTRY, 2022–2025 (USD MILLION)
TABLE 76
PLC: INDUSTRIAL CONTROL & FACTORY AUTOMATION MARKET, BY INDUSTRY, 2026–2032 (USD MILLION)
TABLE 77
PLC: INDUSTRIAL CONTROL & FACTORY AUTOMATION MARKET, BY REGION, 2022–2025 (USD MILLION)
TABLE 78
PLC: INDUSTRIAL CONTROL & FACTORY AUTOMATION MARKET, BY REGION, 2026–2032 (USD MILLION)
TABLE 79
PLC: INDUSTRIAL CONTROL & FACTORY AUTOMATION MARKET IN NORTH AMERICA, BY COUNTRY, 2022–2025 (USD MILLION)
TABLE 80
PLC: INDUSTRIAL CONTROL & FACTORY AUTOMATION MARKET IN NORTH AMERICA, BY COUNTRY, 2026–2032 (USD MILLION)
TABLE 81
PLC: INDUSTRIAL CONTROL & FACTORY AUTOMATION MARKET IN EUROPE, BY COUNTRY, 2022–2025 (USD MILLION)
TABLE 82
PLC: INDUSTRIAL CONTROL & FACTORY AUTOMATION MARKET IN EUROPE, BY COUNTRY, 2026–2032 (USD MILLION)
TABLE 83
PLC: INDUSTRIAL CONTROL & FACTORY AUTOMATION MARKET IN ASIA PACIFIC, BY COUNTRY, 2022–2025 (USD MILLION)
TABLE 84
PLC: INDUSTRIAL CONTROL & FACTORY AUTOMATION MARKET IN ASIA PACIFIC, BY COUNTRY, 2026–2032 (USD MILLION)
TABLE 85
PLC: INDUSTRIAL CONTROL & FACTORY AUTOMATION MARKET IN ROW, BY REGION, 2022–2025 (USD MILLION)
TABLE 86
PLC: INDUSTRIAL CONTROL & FACTORY AUTOMATION MARKET IN ROW, BY REGION, 2026–2032 (USD MILLION)
TABLE 87
INDUSTRIAL PC: INDUSTRIAL CONTROL & FACTORY AUTOMATION MARKET, BY TYPE, 2022–2025 (USD MILLION)
TABLE 88
INDUSTRIAL PC: INDUSTRIAL CONTROL & FACTORY AUTOMATION MARKET, BY TYPE, 2026–2032 (USD MILLION)
TABLE 89
INDUSTRIAL PC: INDUSTRIAL CONTROL & FACTORY AUTOMATION MARKET, BY INDUSTRY, 2022–2025 (USD MILLION)
TABLE 90
INDUSTRIAL PC: INDUSTRIAL CONTROL & FACTORY AUTOMATION MARKET, BY INDUSTRY, 2026–2032 (USD MILLION)
TABLE 91
INDUSTRIAL PC: INDUSTRIAL CONTROL & FACTORY AUTOMATION MARKET, BY REGION, 2022–2025 (USD MILLION)
TABLE 92
INDUSTRIAL PC: INDUSTRIAL CONTROL & FACTORY AUTOMATION MARKET, BY REGION, 2026–2032 (USD MILLION)
TABLE 93
INDUSTRIAL PC: INDUSTRIAL CONTROL & FACTORY AUTOMATION MARKET IN NORTH AMERICA, BY COUNTRY, 2022–2025 (USD MILLION)
TABLE 94
INDUSTRIAL PC: INDUSTRIAL CONTROL & FACTORY AUTOMATION MARKET IN NORTH AMERICA, BY COUNTRY, 2026–2032 (USD MILLION)
TABLE 95
INDUSTRIAL PC: INDUSTRIAL CONTROL & FACTORY AUTOMATION MARKET IN EUROPE, BY COUNTRY, 2022–2025 (USD MILLION)
TABLE 96
INDUSTRIAL PC: INDUSTRIAL CONTROL & FACTORY AUTOMATION MARKET IN EUROPE, BY COUNTRY, 2026–2032 (USD MILLION)
TABLE 97
INDUSTRIAL PC: INDUSTRIAL CONTROL & FACTORY AUTOMATION MARKET IN ASIA PACIFIC, BY COUNTRY, 2022–2025 (USD MILLION)
TABLE 98
INDUSTRIAL PC: INDUSTRIAL CONTROL & FACTORY AUTOMATION MARKET IN ASIA PACIFIC, BY COUNTRY, 2026–2032 (USD MILLION)
TABLE 99
INDUSTRIAL PC: INDUSTRIAL CONTROL & FACTORY AUTOMATION MARKET IN ROW, BY REGION, 2022–2025 (USD MILLION)
TABLE 100
INDUSTRIAL PC: INDUSTRIAL CONTROL & FACTORY AUTOMATION MARKET IN ROW, BY REGION, 2026–2032 (USD MILLION)
TABLE 101
HMI: INDUSTRIAL CONTROL & FACTORY AUTOMATION MARKET, BY OFFERING, 2022–2025 (USD MILLION)
TABLE 102
HMI: INDUSTRIAL CONTROL & FACTORY AUTOMATION MARKET, BY OFFERING, 2026–2032 (USD MILLION)
TABLE 103
HMI: INDUSTRIAL CONTROL & FACTORY AUTOMATION MARKET, BY HARDWARE TYPE, 2022–2025 (USD MILLION)
TABLE 104
HMI: INDUSTRIAL CONTROL & FACTORY AUTOMATION MARKET, BY HARDWARE TYPE, 2026–2032 (USD MILLION)
TABLE 105
HMI: INDUSTRIAL CONTROL & FACTORY AUTOMATION MARKET, BY SOFTWARE DEPLOYMENT MODE, 2022–2025 (USD MILLION)
TABLE 106
HMI: INDUSTRIAL CONTROL & FACTORY AUTOMATION MARKET, BY SOFTWARE DEPLOYMENT MODE, 2026–2032 (USD MILLION)
TABLE 107
HMI: INDUSTRIAL CONTROL & FACTORY AUTOMATION MARKET, BY INDUSTRY, 2022–2025 (USD MILLION)
TABLE 108
HMI: INDUSTRIAL CONTROL & FACTORY AUTOMATION MARKET, BY INDUSTRY, 2026–2032 (USD MILLION)
TABLE 109
HMI: INDUSTRIAL CONTROL & FACTORY AUTOMATION MARKET, BY REGION, 2022–2025 (USD MILLION)
TABLE 110
HMI: INDUSTRIAL CONTROL & FACTORY AUTOMATION MARKET, BY REGION, 2026–2032 (USD MILLION)
TABLE 111
HMI: INDUSTRIAL CONTROL & FACTORY AUTOMATION MARKET IN NORTH AMERICA, BY COUNTRY, 2022–2025 (USD MILLION)
TABLE 112
HMI: INDUSTRIAL CONTROL & FACTORY AUTOMATION MARKET IN NORTH AMERICA, BY COUNTRY, 2026–2032 (USD MILLION)
TABLE 113
HMI: INDUSTRIAL CONTROL & FACTORY AUTOMATION MARKET IN EUROPE, BY COUNTRY, 2022–2025 (USD MILLION)
TABLE 114
HMI: INDUSTRIAL CONTROL & FACTORY AUTOMATION MARKET IN EUROPE, BY COUNTRY, 2026–2032 (USD MILLION)
TABLE 115
HMI: INDUSTRIAL CONTROL & FACTORY AUTOMATION MARKET IN ASIA PACIFIC, BY COUNTRY, 2022–2025 (USD MILLION)
TABLE 116
HMI: INDUSTRIAL CONTROL & FACTORY AUTOMATION MARKET IN ASIA PACIFIC, BY COUNTRY, 2026–2032 (USD MILLION)
TABLE 117
HMI: INDUSTRIAL CONTROL & FACTORY AUTOMATION MARKET IN ROW, BY REGION, 2022–2025 (USD MILLION)
TABLE 118
HMI: INDUSTRIAL CONTROL & FACTORY AUTOMATION MARKET IN ROW, BY REGION, 2026–2032 (USD MILLION)
TABLE 119
INDUSTRIAL SOFTWARE: INDUSTRIAL CONTROL & FACTORY AUTOMATION MARKET, BY TYPE, 2022–2025 (USD MILLION)
TABLE 120
INDUSTRIAL SOFTWARE: INDUSTRIAL CONTROL & FACTORY AUTOMATION MARKET, BY TYPE, 2026–2032 (USD MILLION)
TABLE 121
INDUSTRIAL SOFTWARE: INDUSTRIAL CONTROL & FACTORY AUTOMATION MARKET, BY INDUSTRY, 2022–2025 (USD MILLION)
TABLE 122
INDUSTRIAL SOFTWARE: INDUSTRIAL CONTROL & FACTORY AUTOMATION MARKET, BY INDUSTRY, 2026–2032 (USD MILLION)
TABLE 123
INDUSTRIAL SOFTWARE: INDUSTRIAL CONTROL & FACTORY AUTOMATION MARKET, BY REGION, 2022–2025 (USD MILLION)
TABLE 124
INDUSTRIAL SOFTWARE: INDUSTRIAL CONTROL & FACTORY AUTOMATION MARKET, BY REGION, 2026–2032 (USD MILLION)
TABLE 125
MES: INDUSTRIAL CONTROL & FACTORY AUTOMATION MARKET, BY OFFERING, 2022–2025 (USD MILLION)
TABLE 126
MES: INDUSTRIAL CONTROL & FACTORY AUTOMATION MARKET, BY OFFERING, 2026–2032 (USD MILLION)
TABLE 127
MES: INDUSTRIAL CONTROL & FACTORY AUTOMATION MARKET, BY DEPLOYMENT, 2022–2025 (USD MILLION)
TABLE 128
MES: INDUSTRIAL CONTROL & FACTORY AUTOMATION MARKET, BY DEPLOYMENT, 2026–2032 (USD MILLION)
TABLE 129
MES: INDUSTRIAL CONTROL & FACTORY AUTOMATION MARKET, BY INDUSTRY, 2022–2025 (USD MILLION)
TABLE 130
MES: INDUSTRIAL CONTROL & FACTORY AUTOMATION MARKET, BY INDUSTRY, 2026–2032 (USD MILLION)
TABLE 131
MES: INDUSTRIAL CONTROL & FACTORY AUTOMATION MARKET, BY REGION, 2022–2025 (USD MILLION)
TABLE 132
MES: INDUSTRIAL CONTROL & FACTORY AUTOMATION MARKET, BY REGION, 2026–2032 (USD MILLION)
TABLE 133
MES: INDUSTRIAL CONTROL & FACTORY AUTOMATION MARKET IN NORTH AMERICA, BY COUNTRY, 2022–2025 (USD MILLION)
TABLE 134
MES: INDUSTRIAL CONTROL & FACTORY AUTOMATION MARKET IN NORTH AMERICA, BY COUNTRY, 2026–2032 (USD MILLION)
TABLE 135
MES: INDUSTRIAL CONTROL & FACTORY AUTOMATION MARKET IN EUROPE, BY COUNTRY, 2022–2025 (USD MILLION)
TABLE 136
MES: INDUSTRIAL CONTROL & FACTORY AUTOMATION MARKET IN EUROPE, BY COUNTRY, 2026–2032 (USD MILLION)
TABLE 137
MES: INDUSTRIAL CONTROL & FACTORY AUTOMATION MARKET IN ASIA PACIFIC, BY COUNTRY, 2022–2025 (USD MILLION)
TABLE 138
MES: INDUSTRIAL CONTROL & FACTORY AUTOMATION MARKET IN ASIA PACIFIC, BY COUNTRY, 2026–2032 (USD MILLION)
TABLE 139
MES: INDUSTRIAL CONTROL & FACTORY AUTOMATION MARKET IN ROW, BY REGION, 2022–2025 (USD MILLION)
TABLE 140
MES: INDUSTRIAL CONTROL & FACTORY AUTOMATION MARKET IN ROW, BY REGION, 2026–2032 (USD MILLION)
TABLE 141
PAM: INDUSTRIAL CONTROL & FACTORY AUTOMATION MARKET, BY INDUSTRY, 2022–2025 (USD MILLION)
TABLE 142
PAM: INDUSTRIAL CONTROL & FACTORY AUTOMATION MARKET, BY INDUSTRY, 2026–2032 (USD MILLION)
TABLE 143
PAM: INDUSTRIAL CONTROL & FACTORY AUTOMATION MARKET, BY REGION, 2022–2025 (USD MILLION)
TABLE 144
PAM: INDUSTRIAL CONTROL & FACTORY AUTOMATION MARKET, BY REGION, 2026–2032 (USD MILLION)
TABLE 145
PAM: INDUSTRIAL CONTROL & FACTORY AUTOMATION MARKET IN NORTH AMERICA, BY COUNTRY, 2022–2025 (USD MILLION)
TABLE 146
PAM: INDUSTRIAL CONTROL & FACTORY AUTOMATION MARKET IN NORTH AMERICA, BY COUNTRY, 2026–2032 (USD MILLION)
TABLE 147
PAM: INDUSTRIAL CONTROL & FACTORY AUTOMATION MARKET IN EUROPE, BY COUNTRY, 2022–2025 (USD MILLION)
TABLE 148
PAM: INDUSTRIAL CONTROL & FACTORY AUTOMATION MARKET IN EUROPE, BY COUNTRY, 2026–2032 (USD MILLION)
TABLE 149
PAM: INDUSTRIAL CONTROL & FACTORY AUTOMATION MARKET IN ASIA PACIFIC, BY COUNTRY, 2022–2025 (USD MILLION)
TABLE 150
PAM: INDUSTRIAL CONTROL & FACTORY AUTOMATION MARKET IN ASIA PACIFIC, BY COUNTRY, 2026–2032 (USD MILLION)
TABLE 151
PAM: INDUSTRIAL CONTROL & FACTORY AUTOMATION MARKET IN ROW, BY REGION, 2022–2025 (USD MILLION)
TABLE 152
PAM: INDUSTRIAL CONTROL & FACTORY AUTOMATION MARKET IN ROW, BY REGION, 2026–2032 (USD MILLION)
TABLE 153
WMS: INDUSTRIAL CONTROL & FACTORY AUTOMATION MARKET, BY DEPLOYMENT, 2022–2025 (USD MILLION)
TABLE 154
WMS: INDUSTRIAL CONTROL & FACTORY AUTOMATION MARKET, BY DEPLOYMENT, 2026–2032 (USD MILLION)
TABLE 155
WMS: INDUSTRIAL CONTROL & FACTORY AUTOMATION MARKET, BY TIER TYPE, 2022–2025 (USD MILLION)
TABLE 156
WMS: INDUSTRIAL CONTROL & FACTORY AUTOMATION MARKET, BY TIER TYPE, 2026–2032 (USD MILLION)
TABLE 157
WMS: INDUSTRIAL CONTROL & FACTORY AUTOMATION MARKET, BY INDUSTRY, 2022–2025 (USD MILLION)
TABLE 158
WMS: INDUSTRIAL CONTROL & FACTORY AUTOMATION MARKET, BY INDUSTRY, 2026–2032 (USD MILLION)
TABLE 159
WMS: INDUSTRIAL CONTROL & FACTORY AUTOMATION MARKET, BY REGION, 2022–2025 (USD MILLION)
TABLE 160
WMS: INDUSTRIAL CONTROL & FACTORY AUTOMATION MARKET, BY REGION, 2026–2032 (USD MILLION)
TABLE 161
WMS: INDUSTRIAL CONTROL & FACTORY AUTOMATION MARKET IN NORTH AMERICA, BY COUNTRY, 2022–2025 (USD MILLION)
TABLE 162
WMS: INDUSTRIAL CONTROL & FACTORY AUTOMATION MARKET IN NORTH AMERICA, BY COUNTRY, 2026–2032 (USD MILLION)
TABLE 163
WMS: INDUSTRIAL CONTROL & FACTORY AUTOMATION MARKET IN EUROPE, BY COUNTRY, 2022–2025 (USD MILLION)
TABLE 164
WMS: INDUSTRIAL CONTROL & FACTORY AUTOMATION MARKET IN EUROPE, BY COUNTRY, 2026–2032 (USD MILLION)
TABLE 165
WMS: INDUSTRIAL CONTROL & FACTORY AUTOMATION MARKET IN ASIA PACIFIC, BY COUNTRY, 2022–2025 (USD MILLION)
TABLE 166
WMS: INDUSTRIAL CONTROL & FACTORY AUTOMATION MARKET IN ASIA PACIFIC, BY COUNTRY, 2026–2032 (USD MILLION)
TABLE 167
WMS: INDUSTRIAL CONTROL & FACTORY AUTOMATION MARKET IN ROW, BY REGION 2022–2025 (USD MILLION)
TABLE 168
WMS: INDUSTRIAL CONTROL & FACTORY AUTOMATION MARKET IN ROW, BY REGION, 2026–2032 (USD MILLION)
TABLE 169
MOM: INDUSTRIAL CONTROL & FACTORY AUTOMATION MARKET, BY INDUSTRY, 2022–2025 (USD MILLION)
TABLE 170
MOM: INDUSTRIAL CONTROL & FACTORY AUTOMATION MARKET, BY INDUSTRY, 2026–2032 (USD MILLION)
TABLE 171
MOM: INDUSTRIAL CONTROL & FACTORY AUTOMATION MARKET, BY REGION, 2022–2025 (USD MILLION)
TABLE 172
MOM: INDUSTRIAL CONTROL & FACTORY AUTOMATION MARKET, BY REGION, 2026–2032 (USD MILLION)
TABLE 173
MOM: INDUSTRIAL CONTROL & FACTORY AUTOMATION MARKET IN NORTH AMERICA, BY COUNTRY, 2022–2025 (USD MILLION)
TABLE 174
MOM: INDUSTRIAL CONTROL & FACTORY AUTOMATION MARKET IN NORTH AMERICA, BY COUNTRY, 2026–2032 (USD MILLION)
TABLE 175
MOM: INDUSTRIAL CONTROL & FACTORY AUTOMATION MARKET IN EUROPE, BY COUNTRY, 2022–2025 (USD MILLION)
TABLE 176
MOM: INDUSTRIAL CONTROL & FACTORY AUTOMATION MARKET IN EUROPE, BY COUNTRY, 2026–2032 (USD MILLION)
TABLE 177
MOM: INDUSTRIAL CONTROL & FACTORY AUTOMATION MARKET IN ASIA PACIFIC, BY COUNTRY, 2022–2025 (USD MILLION)
TABLE 178
MOM: INDUSTRIAL CONTROL & FACTORY AUTOMATION MARKET IN ASIA PACIFIC, BY COUNTRY, 2026–2032 (USD MILLION)
TABLE 179
MOM: INDUSTRIAL CONTROL & FACTORY AUTOMATION MARKET IN ROW, BY REGION, 2022–2025 (USD MILLION)
TABLE 180
MOM: INDUSTRIAL CONTROL & FACTORY AUTOMATION MARKET IN ROW, BY REGION, 2026–2032 (USD MILLION)
TABLE 181
ERP: INDUSTRIAL CONTROL & FACTORY AUTOMATION MARKET, BY OFFERING, 2022–2025 (USD MILLION)
TABLE 182
ERP: INDUSTRIAL CONTROL & FACTORY AUTOMATION MARKET, BY OFFERING, 2026–2032 (USD MILLION)
TABLE 183
ERP: INDUSTRIAL CONTROL & FACTORY AUTOMATION MARKET, BY SOFTWARE DEPLOYMENT, 2022–2025 (USD MILLION)
TABLE 184
ERP: INDUSTRIAL CONTROL & FACTORY AUTOMATION MARKET, BY SOFTWARE DEPLOYMENT, 2026–2032 (USD MILLION)
TABLE 185
CLOUD ERP: INDUSTRIAL CONTROL & FACTORY AUTOMATION MARKET, BY INDUSTRY, 2022–2025 (USD MILLION)
TABLE 186
CLOUD ERP: INDUSTRIAL CONTROL & FACTORY AUTOMATION MARKET, BY INDUSTRY, 2026–2032 (USD MILLION)
TABLE 187
CLOUD ERP: INDUSTRIAL CONTROL & FACTORY AUTOMATION MARKET, BY REGION, 2022–2025 (USD MILLION)
TABLE 188
CLOUD ERP: INDUSTRIAL CONTROL & FACTORY AUTOMATION MARKET, BY REGION, 2026–2032 (USD MILLION)
TABLE 189
CLOUD ERP: INDUSTRIAL CONTROL & FACTORY AUTOMATION MARKET IN NORTH AMERICA, BY COUNTRY, 2022–2025 (USD MILLION)
TABLE 190
CLOUD ERP: INDUSTRIAL CONTROL & FACTORY AUTOMATION MARKET IN NORTH AMERICA, BY COUNTRY, 2026–2032 (USD MILLION)
TABLE 191
CLOUD ERP: INDUSTRIAL CONTROL & FACTORY AUTOMATION MARKET IN EUROPE, BY COUNTRY, 2022–2025 (USD MILLION)
TABLE 192
CLOUD ERP: INDUSTRIAL CONTROL & FACTORY AUTOMATION MARKET IN EUROPE, BY COUNTRY, 2026–2032 (USD MILLION)
TABLE 193
CLOUD ERP: INDUSTRIAL CONTROL & FACTORY AUTOMATION MARKET IN ASIA PACIFIC, BY COUNTRY, 2022–2025 (USD MILLION)
TABLE 194
CLOUD ERP: INDUSTRIAL CONTROL & FACTORY AUTOMATION MARKET IN ASIA PACIFIC, BY COUNTRY, 2026–2032 (USD MILLION)
TABLE 195
CLOUD ERP: INDUSTRIAL CONTROL & FACTORY AUTOMATION MARKET IN ROW, BY REGION, 2022–2025 (USD MILLION)
TABLE 196
CLOUD ERP: INDUSTRIAL CONTROL & FACTORY AUTOMATION MARKET IN ROW, BY REGION, 2026–2032 (USD MILLION)
TABLE 197
QMS: INDUSTRIAL CONTROL & FACTORY AUTOMATION MARKET, BY INDUSTRY, 2022–2025 (USD MILLION)
TABLE 198
QMS: INDUSTRIAL CONTROL & FACTORY AUTOMATION MARKET, BY INDUSTRY, 2026–2032 (USD MILLION)
TABLE 199
QMS: INDUSTRIAL CONTROL & FACTORY AUTOMATION MARKET, BY REGION, 2022–2025 (USD MILLION)
TABLE 200
QMS: INDUSTRIAL CONTROL & FACTORY AUTOMATION MARKET, BY REGION, 2026–2032 (USD MILLION)
TABLE 201
QMS: INDUSTRIAL CONTROL & FACTORY AUTOMATION MARKET IN NORTH AMERICA, BY COUNTRY, 2022–2025 (USD MILLION)
TABLE 202
QMS: INDUSTRIAL CONTROL & FACTORY AUTOMATION MARKET IN NORTH AMERICA, BY COUNTRY, 2026–2032 (USD MILLION)
TABLE 203
QMS: INDUSTRIAL CONTROL & FACTORY AUTOMATION MARKET IN EUROPE, BY COUNTRY, 2022–2025 (USD MILLION)
TABLE 204
QMS: INDUSTRIAL CONTROL & FACTORY AUTOMATION MARKET IN EUROPE, BY COUNTRY, 2026–2032 (USD MILLION)
TABLE 205
QMS: INDUSTRIAL CONTROL & FACTORY AUTOMATION MARKET IN ASIA PACIFIC, BY COUNTRY, 2022–2025 (USD MILLION)
TABLE 206
QMS: INDUSTRIAL CONTROL & FACTORY AUTOMATION MARKET IN ASIA PACIFIC, BY COUNTRY, 2026–2032 (USD MILLION)
TABLE 207
QMS: INDUSTRIAL CONTROL & FACTORY AUTOMATION MARKET IN ROW, BY REGION, 2022–2025 (USD MILLION)
TABLE 208
QMS: INDUSTRIAL CONTROL & FACTORY AUTOMATION MARKET IN ROW, BY REGION, 2026–2032 (USD MILLION)
TABLE 209
CNC CONTROLLERS: INDUSTRIAL CONTROL & FACTORY AUTOMATION MARKET, BY OFFERING, 2022–2025 (USD MILLION)
TABLE 210
CNC CONTROLLERS: INDUSTRIAL CONTROL & FACTORY AUTOMATION MARKET, BY OFFERING, 2026–2032 (USD MILLION)
TABLE 211
CNC CONTROLLERS: INDUSTRIAL CONTROL & FACTORY AUTOMATION MARKET, BY INDUSTRY, 2022–2025 (USD MILLION)
TABLE 212
CNC CONTROLLERS: INDUSTRIAL CONTROL & FACTORY AUTOMATION MARKET, BY INDUSTRY, 2026–2032 (USD MILLION)
TABLE 213
CNC CONTROLLERS: INDUSTRIAL CONTROL & FACTORY AUTOMATION MARKET, BY REGION, 2022–2025 (USD MILLION)
TABLE 214
CNC CONTROLLERS: INDUSTRIAL CONTROL & FACTORY AUTOMATION MARKET, BY REGION, 2026–2032 (USD MILLION)
TABLE 215
CNC CONTROLLERS: INDUSTRIAL CONTROL & FACTORY AUTOMATION MARKET IN NORTH AMERICA, BY COUNTRY, 2022–2025 (USD MILLION)
TABLE 216
CNC CONTROLLERS: INDUSTRIAL CONTROL & FACTORY AUTOMATION MARKET IN NORTH AMERICA, BY COUNTRY, 2026–2032 (USD MILLION)
TABLE 217
CNC CONTROLLERS: INDUSTRIAL CONTROL & FACTORY AUTOMATION MARKET IN EUROPE, BY COUNTRY, 2022–2025 (USD MILLION)
TABLE 218
CNC CONTROLLERS: INDUSTRIAL CONTROL & FACTORY AUTOMATION MARKET IN EUROPE, BY COUNTRY, 2026–2032 (USD MILLION)
TABLE 219
CNC CONTROLLERS: INDUSTRIAL CONTROL & FACTORY AUTOMATION MARKET IN ASIA PACIFIC, BY COUNTRY, 2022–2025 (USD MILLION)
TABLE 220
CNC CONTROLLERS: INDUSTRIAL CONTROL & FACTORY AUTOMATION MARKET IN ASIA PACIFIC, BY COUNTRY, 2026–2032 (USD MILLION)
TABLE 221
CNC CONTROLLERS: INDUSTRIAL CONTROL & FACTORY AUTOMATION MARKET IN ROW, BY REGION, 2022–2025 (USD MILLION)
TABLE 222
CNC CONTROLLERS: INDUSTRIAL CONTROL & FACTORY AUTOMATION MARKET IN ROW, BY REGION, 2026–2032 (USD MILLION)
TABLE 223
INDUSTRIAL ROBOTICS: INDUSTRIAL CONTROL & FACTORY AUTOMATION MARKET, BY INDUSTRY, 2022–2025 (USD MILLION)
TABLE 224
INDUSTRIAL ROBOTICS: INDUSTRIAL CONTROL & FACTORY AUTOMATION MARKET, BY INDUSTRY, 2026–2032 (USD MILLION)
TABLE 225
INDUSTRIAL ROBOTICS: INDUSTRIAL CONTROL & FACTORY AUTOMATION MARKET, BY REGION, 2022–2025 (USD MILLION)
TABLE 226
INDUSTRIAL ROBOTICS: INDUSTRIAL CONTROL & FACTORY AUTOMATION MARKET, BY REGION, 2026–2032 (USD MILLION)
TABLE 227
INDUSTRIAL ROBOTICS MARKET: INDUSTRIAL CONTROL & FACTORY AUTOMATION MARKET, BY TYPE, 2022–2025 (USD MILLION)
TABLE 228
INDUSTRIAL ROBOTICS MARKET: INDUSTRIAL CONTROL & FACTORY AUTOMATION MARKET, BY TYPE, 2026–2032 (USD MILLION)
TABLE 229
INDUSTRIAL ROBOTS MARKET: INDUSTRIAL CONTROL & FACTORY AUTOMATION MARKET, BY ROBOT TYPE, 2022–2025 (USD MILLION)
TABLE 230
INDUSTRIAL ROBOTS MARKET: : INDUSTRIAL CONTROL & FACTORY AUTOMATION MARKET, BY ROBOT TYPE, 2026–2032 (USD MILLION)
TABLE 231
INDUSTRIAL ROBOTS: INDUSTRIAL CONTROL & FACTORY AUTOMATION MARKET, BY INDUSTRY, 2022–2025 (USD MILLION)
TABLE 232
INDUSTRIAL ROBOTS: INDUSTRIAL CONTROL & FACTORY AUTOMATION MARKET, BY INDUSTRY, 2026–2032 (USD MILLION)
TABLE 233
INDUSTRIAL ROBOTS: INDUSTRIAL CONTROL & FACTORY AUTOMATION MARKET, BY REGION, 2022–2025 (USD MILLION)
TABLE 234
INDUSTRIAL ROBOTS: INDUSTRIAL CONTROL & FACTORY AUTOMATION MARKET, BY REGION, 2026–2032 (USD MILLION)
TABLE 235
INDUSTRIAL ROBOTS: INDUSTRIAL CONTROL & FACTORY AUTOMATION MARKET IN NORTH AMERICA, BY COUNTRY, 2022–2025 (USD MILLION)
TABLE 236
INDUSTRIAL ROBOTS: INDUSTRIAL CONTROL & FACTORY AUTOMATION MARKET IN NORTH AMERICA, BY COUNTRY, 2026–2032 (USD MILLION)
TABLE 237
INDUSTRIAL ROBOTS: INDUSTRIAL CONTROL & FACTORY AUTOMATION MARKET IN EUROPE, BY COUNTRY, 2022–2025 (USD MILLION)
TABLE 238
INDUSTRIAL ROBOTS: INDUSTRIAL CONTROL & FACTORY AUTOMATION MARKET IN EUROPE, BY COUNTRY, 2026–2032 (USD MILLION)
TABLE 239
INDUSTRIAL ROBOTS: INDUSTRIAL CONTROL & FACTORY AUTOMATION MARKET IN ASIA PACIFIC, BY COUNTRY, 2022–2025 (USD MILLION)
TABLE 240
INDUSTRIAL ROBOTS: INDUSTRIAL CONTROL & FACTORY AUTOMATION MARKET IN ASIA PACIFIC, BY COUNTRY, 2026–2032 (USD MILLION)
TABLE 241
INDUSTRIAL ROBOTS: INDUSTRIAL CONTROL & FACTORY AUTOMATION MARKET IN ROW, BY REGION, 2022–2025 (USD MILLION)
TABLE 242
INDUSTRIAL ROBOTS: INDUSTRIAL CONTROL & FACTORY AUTOMATION MARKET IN ROW, BY REGION, 2026–2032 (USD MILLION)
TABLE 243
TRADITIONAL INDUSTRIAL ROBOTS MARKET, BY TYPE, 2022–2025 (USD MILLION)
TABLE 244
TRADITIONAL INDUSTRIAL ROBOTS MARKET, BY TYPE, 2026–2032 (USD MILLION)
TABLE 245
TRADITIONAL INDUSTRIAL ROBOTS MARKET, BY TYPE, 2022–2025 (THOUSAND UNITS)
TABLE 246
TRADITIONAL INDUSTRIAL ROBOTS MARKET, BY TYPE, 2026–2032 (THOUSAND UNITS)
TABLE 247
ROBOT END EFFECTORS: INDUSTRIAL CONTROL & FACTORY AUTOMATION MARKET, BY INDUSTRY, 2022–2025 (USD MILLION)
TABLE 248
ROBOT END EFFECTORS: INDUSTRIAL CONTROL & FACTORY AUTOMATION MARKET, BY INDUSTRY, 2026–2032 (USD MILLION)
TABLE 249
ROBOT END EFFECTORS: INDUSTRIAL CONTROL & FACTORY AUTOMATION MARKET, BY REGION, 2022–2025 (USD MILLION)
TABLE 250
ROBOT END EFFECTORS: INDUSTRIAL CONTROL & FACTORY AUTOMATION MARKET, BY REGION, 2026–2032 (USD MILLION)
TABLE 251
ROBOT END EFFECTORS: INDUSTRIAL CONTROL & FACTORY AUTOMATION MARKET IN NORTH AMERICA, BY COUNTRY, 2022–2025 (USD MILLION)
TABLE 252
ROBOT END EFFECTORS: INDUSTRIAL CONTROL & FACTORY AUTOMATION MARKET IN NORTH AMERICA, BY COUNTRY, 2026–2032 (USD MILLION)
TABLE 253
ROBOT END EFFECTORS: INDUSTRIAL CONTROL & FACTORY AUTOMATION MARKET IN EUROPE, BY COUNTRY, 2022–2025 (USD MILLION)
TABLE 254
ROBOT END EFFECTORS: INDUSTRIAL CONTROL & FACTORY AUTOMATION MARKET IN EUROPE, BY COUNTRY, 2026–2032 (USD MILLION)
TABLE 255
ROBOT END EFFECTORS: INDUSTRIAL CONTROL & FACTORY AUTOMATION MARKET IN ASIA PACIFIC, BY COUNTRY, 2022–2025 (USD MILLION)
TABLE 256
ROBOT END EFFECTORS: INDUSTRIAL CONTROL & FACTORY AUTOMATION MARKET IN ASIA PACIFIC, BY COUNTRY, 2026–2032 (USD MILLION)
TABLE 257
ROBOT END EFFECTOR: INDUSTRIAL CONTROL & FACTORY AUTOMATION MARKET IN ROW, BY REGION, 2022–2025 (USD MILLION)
TABLE 258
ROBOT END EFFECTOR: INDUSTRIAL CONTROL & FACTORY AUTOMATION MARKET IN ROW, BY REGION, 2026–2032 (USD MILLION)
TABLE 259
INDUSTRIAL 3D PRINTING: INDUSTRIAL CONTROL & FACTORY AUTOMATION MARKET, BY OFFERING, 2022–2025 (USD MILLION)
TABLE 260
INDUSTRIAL 3D PRINTING: INDUSTRIAL CONTROL & FACTORY AUTOMATION MARKET, BY OFFERING, 2026–2032 (USD MILLION)
TABLE 261
INDUSTRIAL 3D PRINTING: INDUSTRIAL CONTROL & FACTORY AUTOMATION MARKET, BY INDUSTRY, 2022–2025 (USD MILLION)
TABLE 262
INDUSTRIAL 3D PRINTING: INDUSTRIAL CONTROL & FACTORY AUTOMATION MARKET, BY INDUSTRY, 2026–2032 (USD MILLION)
TABLE 263
INDUSTRIAL 3D PRINTING: INDUSTRIAL CONTROL & FACTORY AUTOMATION MARKET, BY REGION, 2022–2025 (USD MILLION)
TABLE 264
INDUSTRIAL 3D PRINTING: INDUSTRIAL CONTROL & FACTORY AUTOMATION MARKET, BY REGION, 2026–2032 (USD MILLION)
TABLE 265
INDUSTRIAL 3D PRINTING: INDUSTRIAL CONTROL & FACTORY AUTOMATION MARKET IN NORTH AMERICA, BY COUNTRY, 2022–2025 (USD MILLION)
TABLE 266
INDUSTRIAL 3D PRINTING: INDUSTRIAL CONTROL & FACTORY AUTOMATION MARKET IN NORTH AMERICA, BY COUNTRY, 2026–2032 (USD MILLION)
TABLE 267
INDUSTRIAL 3D PRINTING: INDUSTRIAL CONTROL & FACTORY AUTOMATION MARKET IN EUROPE, BY COUNTRY, 2022–2025 (USD MILLION)
TABLE 268
INDUSTRIAL 3D PRINTING: INDUSTRIAL CONTROL & FACTORY AUTOMATION MARKET IN EUROPE, BY COUNTRY, 2026–2032 (USD MILLION)
TABLE 269
INDUSTRIAL 3D PRINTING: INDUSTRIAL CONTROL & FACTORY AUTOMATION MARKET IN ASIA PACIFIC, BY COUNTRY, 2022–2025 (USD MILLION)
TABLE 270
INDUSTRIAL 3D PRINTING: INDUSTRIAL CONTROL & FACTORY AUTOMATION MARKET IN ASIA PACIFIC, BY COUNTRY, 2026–2032 (USD MILLION)
TABLE 271
INDUSTRIAL 3D PRINTING: INDUSTRIAL CONTROL & FACTORY AUTOMATION MARKET IN ROW, BY REGION, 2022–2025 (USD MILLION)
TABLE 272
INDUSTRIAL 3D PRINTING: INDUSTRIAL CONTROL & FACTORY AUTOMATION MARKET IN ROW, BY REGION, 2026–2032 (USD MILLION)
TABLE 273
PROCESS ANALYZERS: INDUSTRIAL CONTROL & FACTORY AUTOMATION MARKET, BY TYPE, 2022–2025 (USD MILLION)
TABLE 274
PROCESS ANALYZERS: INDUSTRIAL CONTROL & FACTORY AUTOMATION MARKET, BY TYPE, 2026–2032 (USD MILLION)
TABLE 275
GAS ANALYZERS: INDUSTRIAL CONTROL & FACTORY AUTOMATION MARKET, BY TYPE, 2022–2025 (USD MILLION)
TABLE 276
GAS ANALYZERS: INDUSTRIAL CONTROL & FACTORY AUTOMATION MARKET, BY TYPE, 2026–2032 (USD MILLION)
TABLE 277
LIQUID ANALYZERS: INDUSTRIAL CONTROL & FACTORY AUTOMATION MARKET, BY TYPE, 2022–2025 (USD MILLION)
TABLE 278
LIQUID ANALYZERS: INDUSTRIAL CONTROL & FACTORY AUTOMATION MARKET, BY TYPE, 2026–2032 (USD MILLION)
TABLE 279
PROCESS ANALYZERS: INDUSTRIAL CONTROL & FACTORY AUTOMATION MARKET, BY INDUSTRY, 2022–2025 (USD MILLION)
TABLE 280
PROCESS ANALYZERS: INDUSTRIAL CONTROL & FACTORY AUTOMATION MARKET, BY INDUSTRY, 2026–2032 (USD MILLION)
TABLE 281
PROCESS ANALYZERS: INDUSTRIAL CONTROL & FACTORY AUTOMATION MARKET, BY REGION, 2022–2025 (USD MILLION)
TABLE 282
PROCESS ANALYZERS: INDUSTRIAL CONTROL & FACTORY AUTOMATION MARKET, BY REGION, 2026–2032 (USD MILLION)
TABLE 283
PROCESS ANALYZERS: INDUSTRIAL CONTROL & FACTORY AUTOMATION MARKET IN NORTH AMERICA, BY COUNTRY, 2022–2025 (USD MILLION)
TABLE 284
PROCESS ANALYZERS: INDUSTRIAL CONTROL & FACTORY AUTOMATION MARKET IN NORTH AMERICA, BY COUNTRY, 2026–2032 (USD MILLION)
TABLE 285
PROCESS ANALYZERS: INDUSTRIAL CONTROL & FACTORY AUTOMATION MARKET IN EUROPE, BY COUNTRY, 2022–2025 (USD MILLION)
TABLE 286
PROCESS ANALYZERS: INDUSTRIAL CONTROL & FACTORY AUTOMATION MARKET IN EUROPE, BY COUNTRY, 2026–2032 (USD MILLION)
TABLE 287
PROCESS ANALYZER: INDUSTRIAL CONTROL & FACTORY AUTOMATION MARKET IN ASIA PACIFIC, BY COUNTRY, 2022–2025 (USD MILLION)
TABLE 288
PROCESS ANALYZERS: INDUSTRIAL CONTROL & FACTORY AUTOMATION MARKET IN ASIA PACIFIC, BY COUNTRY, 2026–2032 (USD MILLION)
TABLE 289
PROCESS ANALYZERS: INDUSTRIAL CONTROL & FACTORY AUTOMATION MARKET IN ROW, BY REGION, 2022–2025 (USD MILLION)
TABLE 290
PROCESS ANALYZERS: INDUSTRIAL CONTROL & FACTORY AUTOMATION MARKET IN ROW, BY REGION, 2026–2032 (USD MILLION)
TABLE 291
FIELD INSTRUMENTATION: INDUSTRIAL CONTROL & FACTORY AUTOMATION MARKET, BY TYPE, 2022–2025 (USD MILLION)
TABLE 292
FIELD INSTRUMENTATION: INDUSTRIAL CONTROL & FACTORY AUTOMATION MARKET, BY TYPE, 2026–2032 (USD MILLION)
TABLE 293
FIELD INSTRUMENTATION: INDUSTRIAL CONTROL & FACTORY AUTOMATION MARKET, BY INDUSTRY, 2022–2025 (USD MILLION)
TABLE 294
FIELD INSTRUMENTATION: INDUSTRIAL CONTROL & FACTORY AUTOMATION MARKET, BY INDUSTRY, 2026–2032 (USD MILLION)
TABLE 295
FIELD INSTRUMENTATION: INDUSTRIAL CONTROL & FACTORY AUTOMATION MARKET, BY REGION, 2022–2025 (USD MILLION)
TABLE 296
FIELD INSTRUMENTATION: INDUSTRIAL CONTROL & FACTORY AUTOMATION MARKET, BY REGION, 2026–2032 (USD MILLION)
TABLE 297
FIELD INSTRUMENTATION: INDUSTRIAL CONTROL & FACTORY AUTOMATION MARKET IN NORTH AMERICA, BY COUNTRY, 2022–2025 (USD MILLION)
TABLE 298
FIELD INSTRUMENTATION: INDUSTRIAL CONTROL & FACTORY AUTOMATION MARKET IN NORTH AMERICA, BY COUNTRY, 2026–2032 (USD MILLION)
TABLE 299
FIELD INSTRUMENTATION: INDUSTRIAL CONTROL & FACTORY AUTOMATION MARKET IN EUROPE, BY COUNTRY, 2022–2025 (USD MILLION)
TABLE 300
FIELD INSTRUMENTATION: INDUSTRIAL CONTROL & FACTORY AUTOMATION MARKET IN EUROPE, BY COUNTRY, 2026–2032 (USD MILLION)
TABLE 301
FIELD INSTRUMENTATION: INDUSTRIAL CONTROL & FACTORY AUTOMATION MARKET IN ASIA PACIFIC, BY COUNTRY, 2022–2025 (USD MILLION)
TABLE 302
FIELD INSTRUMENTATION: INDUSTRIAL CONTROL & FACTORY AUTOMATION MARKET IN ASIA PACIFIC, BY COUNTRY, 2026–2032 (USD MILLION)
TABLE 303
FIELD INSTRUMENTATION: INDUSTRIAL CONTROL & FACTORY AUTOMATION MARKET IN ROW, BY REGION, 2022–2025 (USD MILLION)
TABLE 304
FIELD INSTRUMENTATION: INDUSTRIAL CONTROL & FACTORY AUTOMATION MARKET IN ROW, BY REGION, 2026–2032 (USD MILLION)
TABLE 305
LEVEL TRANSMITTERS: INDUSTRIAL CONTROL & FACTORY AUTOMATION MARKET, BY INDUSTRY, 2022–2025 (USD MILLION)
TABLE 306
LEVEL TRANSMITTERS: INDUSTRIAL CONTROL & FACTORY AUTOMATION MARKET, BY INDUSTRY, 2026–2032 (USD MILLION)
TABLE 307
LEVEL TRANSMITTERS: INDUSTRIAL CONTROL & FACTORY AUTOMATION MARKET, BY REGION, 2022–2025 (USD MILLION)
TABLE 308
LEVEL TRANSMITTERS: INDUSTRIAL CONTROL & FACTORY AUTOMATION MARKET, BY REGION, 2026–2032 (USD MILLION)
TABLE 309
PRESSURE TRANSMITTERS: INDUSTRIAL CONTROL & FACTORY AUTOMATION MARKET, BY INDUSTRY, 2022–2025 (USD MILLION)
TABLE 310
PRESSURE TRANSMITTERS: INDUSTRIAL CONTROL & FACTORY AUTOMATION MARKET, BY INDUSTRY, 2026–2032 (USD MILLION)
TABLE 311
PRESSURE TRANSMITTERS: INDUSTRIAL CONTROL & FACTORY AUTOMATION MARKET, BY REGION, 2022–2025 (USD MILLION)
TABLE 312
PRESSURE TRANSMITTERS: INDUSTRIAL CONTROL & FACTORY AUTOMATION MARKET, BY REGION, 2026–2032 (USD MILLION)
TABLE 313
TEMPERATURE TRANSMITTERS: INDUSTRIAL CONTROL & FACTORY AUTOMATION MARKET, BY INDUSTRY, 2022–2025 (USD MILLION)
TABLE 314
TEMPERATURE TRANSMITTERS: INDUSTRIAL CONTROL & FACTORY AUTOMATION MARKET, BY INDUSTRY, 2026–2032 (USD MILLION)
TABLE 315
TEMPERATURE TRANSMITTERS: INDUSTRIAL CONTROL & FACTORY AUTOMATION MARKET, BY REGION, 2022–2025 (USD MILLION)
TABLE 316
TEMPERATURE TRANSMITTERS: INDUSTRIAL CONTROL & FACTORY AUTOMATION MARKET, BY REGION, 2026–2032 (USD MILLION)
TABLE 317
OTHER TRANSMITTERS: INDUSTRIAL CONTROL & FACTORY AUTOMATION MARKET, BY INDUSTRY, 2022–2025 (USD MILLION)
TABLE 318
OTHER TRANSMITTERS: INDUSTRIAL CONTROL & FACTORY AUTOMATION MARKET, BY INDUSTRY, 2026–2032 (USD MILLION)
TABLE 319
OTHER TRANSMITTERS: INDUSTRIAL CONTROL & FACTORY AUTOMATION MARKET, BY REGION, 2022–2025 (USD MILLION)
TABLE 320
OTHER TRANSMITTERS: INDUSTRIAL CONTROL & FACTORY AUTOMATION MARKET, BY REGION, 2026–2032 (USD MILLION)
TABLE 321
FLOW METERS: INDUSTRIAL CONTROL & FACTORY AUTOMATION MARKET, BY TYPE, 2022–2025 (USD MILLION)
TABLE 322
FLOW METERS: INDUSTRIAL CONTROL & FACTORY AUTOMATION MARKET, BY TYPE, 2026–2032 (USD MILLION)
TABLE 323
FLOW METERS: INDUSTRIAL CONTROL & FACTORY AUTOMATION MARKET, BY INDUSTRY, 2022–2025 (USD MILLION)
TABLE 324
FLOW METERS: INDUSTRIAL CONTROL & FACTORY AUTOMATION MARKET, BY INDUSTRY, 2026–2032 (USD MILLION)
TABLE 325
FLOW METERS: INDUSTRIAL CONTROL & FACTORY AUTOMATION MARKET, BY REGION, 2022–2025 (USD MILLION)
TABLE 326
FLOW METERS: INDUSTRIAL CONTROL & FACTORY AUTOMATION MARKET, BY REGION, 2026–2032 (USD MILLION)
TABLE 327
FLOW METERS: INDUSTRIAL CONTROL & FACTORY AUTOMATION MARKET IN NORTH AMERICA, BY COUNTRY, 2022–2025 (USD MILLION)
TABLE 328
FLOW METERS: INDUSTRIAL CONTROL & FACTORY AUTOMATION MARKET IN NORTH AMERICA, BY COUNTRY, 2026–2032 (USD MILLION)
TABLE 329
FLOW METERS: INDUSTRIAL CONTROL & FACTORY AUTOMATION MARKET IN EUROPE, BY COUNTRY, 2022–2025 (USD MILLION)
TABLE 330
FLOW METERS: INDUSTRIAL CONTROL & FACTORY AUTOMATION MARKET IN EUROPE, BY COUNTRY, 2026–2032 (USD MILLION)
TABLE 331
FLOW METERS: INDUSTRIAL CONTROL & FACTORY AUTOMATION MARKET IN ASIA PACIFIC BY COUNTRY, 2022–2025 (USD MILLION)
TABLE 332
FLOW METERS: INDUSTRIAL CONTROL & FACTORY AUTOMATION MARKET IN ASIA PACIFIC, BY COUNTRY, 2026–2032 (USD MILLION)
TABLE 333
FLOW METERS: INDUSTRIAL CONTROL & FACTORY AUTOMATION MARKET IN ROW, BY REGION, 2022–2025 (USD MILLION)
TABLE 334
FLOW METER: INDUSTRIAL CONTROL & FACTORY AUTOMATION MARKET IN ROW, BY REGION, 2026–2032 (USD MILLION)
TABLE 335
INDUSTRIAL COMMUNICATION: INDUSTRIAL CONTROL & FACTORY AUTOMATION MARKET, BY OFFERING, 2022–2025 (USD MILLION)
TABLE 336
INDUSTRIAL COMMUNICATION: INDUSTRIAL CONTROL & FACTORY AUTOMATION MARKET, BY OFFERING, 2026–2032 (USD MILLION)
TABLE 337
INDUSTRIAL COMMUNICATION: INDUSTRIAL CONTROL & FACTORY AUTOMATION MARKET, BY COMPONENT, 2022–2025 (USD MILLION)
TABLE 338
INDUSTRIAL COMMUNICATION: INDUSTRIAL CONTROL & FACTORY AUTOMATION MARKET, BY COMPONENT, 2026–2032 (USD MILLION)
TABLE 339
INDUSTRIAL COMMUNICATION: INDUSTRIAL CONTROL & FACTORY AUTOMATION MARKET, BY INDUSTRY, 2022–2025 (USD MILLION)
TABLE 340
INDUSTRIAL COMMUNICATION: INDUSTRIAL CONTROL & FACTORY AUTOMATION MARKET, BY INDUSTRY, 2026–2032 (USD MILLION)
TABLE 341
INDUSTRIAL COMMUNICATION: INDUSTRIAL CONTROL & FACTORY AUTOMATION MARKET, BY REGION, 2022–2025 (USD MILLION)
TABLE 342
INDUSTRIAL COMMUNICATION: INDUSTRIAL CONTROL & FACTORY AUTOMATION MARKET, BY REGION, 2026–2032 (USD MILLION)
TABLE 343
INDUSTRIAL COMMUNICATION: INDUSTRIAL CONTROL & FACTORY AUTOMATION MARKET IN NORTH AMERICA, BY COUNTRY, 2022–2025 (USD MILLION)
TABLE 344
INDUSTRIAL COMMUNICATION: INDUSTRIAL CONTROL & FACTORY AUTOMATION MARKET IN NORTH AMERICA, BY COUNTRY, 2026–2032 (USD MILLION)
TABLE 345
INDUSTRIAL COMMUNICATION: INDUSTRIAL CONTROL & FACTORY AUTOMATION MARKET IN EUROPE, BY COUNTRY, 2022–2025 (USD MILLION)
TABLE 346
INDUSTRIAL COMMUNICATION: INDUSTRIAL CONTROL & FACTORY AUTOMATION MARKET IN EUROPE, BY COUNTRY, 2026–2032 (USD MILLION)
TABLE 347
INDUSTRIAL COMMUNICATION: INDUSTRIAL CONTROL & FACTORY AUTOMATION MARKET IN ASIA PACIFIC, BY COUNTRY, 2022–2025 (USD MILLION)
TABLE 348
INDUSTRIAL COMMUNICATION: INDUSTRIAL CONTROL & FACTORY AUTOMATION MARKET IN ASIA PACIFIC, BY COUNTRY, 2026–2032 (USD MILLION)
TABLE 349
INDUSTRIAL COMMUNICATION: INDUSTRIAL CONTROL & FACTORY AUTOMATION MARKET IN ROW, BY REGION, 2022–2025 (USD MILLION)
TABLE 350
INDUSTRIAL COMMUNICATION: INDUSTRIAL CONTROL & FACTORY AUTOMATION MARKET IN ROW, BY REGION, 2026–2032 (USD MILLION)
TABLE 351
INDUSTRIAL MONITORING & SAFETY: INDUSTRIAL CONTROL & FACTORY AUTOMATION MARKET, BY TYPE, 2022–2025 (USD MILLION)
TABLE 352
INDUSTRIAL MONITORING & SAFETY: INDUSTRIAL CONTROL & FACTORY AUTOMATION MARKET, BY TYPE, 2026–2032 (USD MILLION)
TABLE 353
INDUSTRIAL MONITORING & SAFETY: INDUSTRIAL CONTROL & FACTORY AUTOMATION MARKET, BY INDUSTRY, 2022–2025 (USD MILLION)
TABLE 354
INDUSTRIAL MONITORING & SAFETY: INDUSTRIAL CONTROL & FACTORY AUTOMATION MARKET, BY INDUSTRY, 2026–2032 (USD MILLION)
TABLE 355
INDUSTRIAL MONITORING & SAFETY: INDUSTRIAL CONTROL & FACTORY AUTOMATION MARKET, BY REGION, 2022–2025 (USD MILLION)
TABLE 356
INDUSTRIAL MONITORING & SAFETY: INDUSTRIAL CONTROL & FACTORY AUTOMATION MARKET, BY REGION, 2026–2032 (USD MILLION)
TABLE 357
INDUSTRIAL SENSORS: INDUSTRIAL CONTROL & FACTORY AUTOMATION MARKET, BY TYPE, 2022–2025 (USD MILLION)
TABLE 358
INDUSTRIAL SENSOR: INDUSTRIAL CONTROL & FACTORY AUTOMATION MARKET, BY TYPE, 2026–2032 (USD MILLION)
TABLE 359
INDUSTRIAL SENSORS: INDUSTRIAL CONTROL & FACTORY AUTOMATION MARKET, BY SENSOR TYPE, 2022–2025 (USD MILLION)
TABLE 360
INDUSTRIAL SENSORS: INDUSTRIAL CONTROL & FACTORY AUTOMATION MARKET, BY SENSOR TYPE, 2026–2032 (USD MILLION)
TABLE 361
INDUSTRIAL SENSORS: INDUSTRIAL CONTROL & FACTORY AUTOMATION MARKET, BY INDUSTRY, 2022–2025 (USD MILLION)
TABLE 362
INDUSTRIAL SENSORS: INDUSTRIAL CONTROL & FACTORY AUTOMATION MARKET, BY INDUSTRY, 2026–2032 (USD MILLION)
TABLE 363
INDUSTRIAL SENSORS: INDUSTRIAL CONTROL & FACTORY AUTOMATION MARKET, BY REGION, 2022–2025 (USD MILLION)
TABLE 364
INDUSTRIAL SENSORS: INDUSTRIAL CONTROL & FACTORY AUTOMATION MARKET, BY REGION, 2026–2032 (USD MILLION)
TABLE 365
INDUSTRIAL SENSORS: INDUSTRIAL CONTROL & FACTORY AUTOMATION MARKET IN NORTH AMERICA, BY COUNTRY, 2022–2025 (USD MILLION)
TABLE 366
INDUSTRIAL SENSORS: INDUSTRIAL CONTROL & FACTORY AUTOMATION MARKET IN NORTH AMERICA, BY COUNTRY, 2026–2032 (USD MILLION)
TABLE 367
INDUSTRIAL SENSORS: INDUSTRIAL CONTROL & FACTORY AUTOMATION MARKET IN EUROPE, BY COUNTRY, 2022–2025 (USD MILLION)
TABLE 368
INDUSTRIAL SENSORS: INDUSTRIAL CONTROL & FACTORY AUTOMATION MARKET IN EUROPE, BY COUNTRY, 2026–2032 (USD MILLION)
TABLE 369
INDUSTRIAL SENSORS: INDUSTRIAL CONTROL & FACTORY AUTOMATION MARKET IN ASIA PACIFIC, BY COUNTRY, 2022–2025 (USD MILLION)
TABLE 370
INDUSTRIAL SENSORS: INDUSTRIAL CONTROL & FACTORY AUTOMATION MARKET IN ASIA PACIFIC, BY COUNTRY, 2026–2032 (USD MILLION)
TABLE 371
INDUSTRIAL SENSORS: INDUSTRIAL CONTROL & FACTORY AUTOMATION MARKET IN ROW, BY REGION, 2022–2025 (USD MILLION)
TABLE 372
INDUSTRIAL SENSORS: INDUSTRIAL CONTROL & FACTORY AUTOMATION MARKET IN ROW, BY REGION, 2026–2032 (USD MILLION)
TABLE 373
MACHINE CONDITION MONITORING: INDUSTRIAL CONTROL & FACTORY AUTOMATION MARKET, BY INDUSTRY, 2022–2025 (USD MILLION)
TABLE 374
MACHINE CONDITION MONITORING: INDUSTRIAL CONTROL & FACTORY AUTOMATION MARKET, BY INDUSTRY, 2026–2032 (USD MILLION)
TABLE 375
MACHINE CONDITION MONITORING: INDUSTRIAL CONTROL & FACTORY AUTOMATION MARKET, BY REGION, 2022–2025 (USD MILLION)
TABLE 376
MACHINE CONDITION MONITORING: INDUSTRIAL CONTROL & FACTORY AUTOMATION MARKET, BY REGION, 2026–2032 (USD MILLION)
TABLE 377
MACHINE CONDITION MONITORING: INDUSTRIAL CONTROL & FACTORY AUTOMATION MARKET IN NORTH AMERICA, BY COUNTRY, 2022–2025 (USD MILLION)
TABLE 378
MACHINE CONDITION MONITORING: INDUSTRIAL CONTROL & FACTORY AUTOMATION MARKET IN NORTH AMERICA, BY COUNTRY, 2026–2032 (USD MILLION)
TABLE 379
MACHINE CONDITION MONITORING: INDUSTRIAL CONTROL & FACTORY AUTOMATION MARKET IN EUROPE, BY COUNTRY, 2022–2025 (USD MILLION)
TABLE 380
MACHINE CONDITION MONITORING: INDUSTRIAL CONTROL & FACTORY AUTOMATION MARKET IN EUROPE, BY COUNTRY, 2026–2032 (USD MILLION)
TABLE 381
MACHINE CONDITION MONITORING: INDUSTRIAL CONTROL & FACTORY AUTOMATION MARKET IN ASIA PACIFIC, BY COUNTRY, 2022–2025 (USD MILLION)
TABLE 382
MACHINE CONDITION MONITORING: INDUSTRIAL CONTROL & FACTORY AUTOMATION MARKET IN ASIA PACIFIC, BY COUNTRY, 2026–2032 (USD MILLION)
TABLE 383
MACHINE CONDITION MONITORING: INDUSTRIAL CONTROL & FACTORY AUTOMATION MARKET IN ROW, BY REGION, 2022–2025 (USD MILLION)
TABLE 384
MACHINE CONDITION MONITORING: INDUSTRIAL CONTROL & FACTORY AUTOMATION MARKET IN ROW, BY REGION, 2026–2032 (USD MILLION)
TABLE 385
MACHINE SAFETY: INDUSTRIAL CONTROL & FACTORY AUTOMATION MARKET, BY COMPONENT, 2022–2025 (USD MILLION)
TABLE 386
MACHINE SAFETY: INDUSTRIAL CONTROL & FACTORY AUTOMATION MARKET, COMPONENT, 2026–2032 (USD MILLION)
TABLE 387
MACHINE SAFETY: INDUSTRIAL CONTROL & FACTORY AUTOMATION MARKET, BY INDUSTRY, 2022–2025 (USD MILLION)
TABLE 388
MACHINE SAFETY: INDUSTRIAL CONTROL & FACTORY AUTOMATION MARKET, BY INDUSTRY, 2026–2032 (USD MILLION)
TABLE 389
MACHINE SAFETY: INDUSTRIAL CONTROL & FACTORY AUTOMATION MARKET, BY REGION, 2022–2025 (USD MILLION)
TABLE 390
MACHINE SAFETY: INDUSTRIAL CONTROL & FACTORY AUTOMATION MARKET, BY REGION, 2026–2032 (USD MILLION)
TABLE 391
MACHINE SAFETY: INDUSTRIAL CONTROL & FACTORY AUTOMATION MARKET IN NORTH AMERICA, BY COUNTRY, 2022–2025 (USD MILLION)
TABLE 392
MACHINE SAFETY: INDUSTRIAL CONTROL & FACTORY AUTOMATION MARKET IN NORTH AMERICA, BY COUNTRY, 2026–2032 (USD MILLION)
TABLE 393
MACHINE SAFETY: INDUSTRIAL CONTROL & FACTORY AUTOMATION MARKET IN EUROPE, BY COUNTRY, 2022–2025 (USD MILLION)
TABLE 394
MACHINE SAFETY: INDUSTRIAL CONTROL & FACTORY AUTOMATION MARKET IN EUROPE, BY COUNTRY, 2026–2032 (USD MILLION)
TABLE 395
MACHINE SAFETY: INDUSTRIAL CONTROL & FACTORY AUTOMATION MARKET IN ASIA PACIFIC, BY COUNTRY, 2022–2025 (USD MILLION)
TABLE 396
MACHINE SAFETY: INDUSTRIAL CONTROL & FACTORY AUTOMATION MARKET IN ASIA PACIFIC, BY COUNTRY, 2026–2032 (USD MILLION)
TABLE 397
MACHINE SAFETY: INDUSTRIAL CONTROL & FACTORY AUTOMATION MARKET IN ROW, BY REGION, 2022–2025 (USD MILLION)
TABLE 398
MACHINE SAFETY: INDUSTRIAL CONTROL & FACTORY AUTOMATION MARKET IN ROW, BY REGION, 2026–2032 (USD MILLION)
TABLE 399
SOLID-STATE RELAYS: INDUSTRIAL CONTROL & FACTORY AUTOMATION MARKET, BY MOUNTING TYPE, 2022–2025 (USD MILLION)
TABLE 400
SOLID-STATE RELAY: INDUSTRIAL CONTROL & FACTORY AUTOMATION MARKET, BY MOUNTING TYPE, 2026–2032 (USD MILLION)
TABLE 401
SOLID-STATE RELAYS: INDUSTRIAL CONTROL & FACTORY AUTOMATION MARKET, BY TYPE, 2022–2025 (USD MILLION)
TABLE 402
SOLID-STATE RELAYS: INDUSTRIAL CONTROL & FACTORY AUTOMATION MARKET, BY TYPE, 2026–2032 (USD MILLION)
TABLE 403
SOLID-STATE RELAYS: INDUSTRIAL CONTROL & FACTORY AUTOMATION MARKET, BY INDUSTRY, 2022–2025 (USD MILLION)
TABLE 404
SOLID-STATE RELAYS: INDUSTRIAL CONTROL & FACTORY AUTOMATION MARKET, BY INDUSTRY, 2026–2032 (USD MILLION)
TABLE 405
SOLID-STATE RELAYS: INDUSTRIAL CONTROL & FACTORY AUTOMATION MARKET, BY REGION, 2022–2025 (USD MILLION)
TABLE 406
SOLID-STATE RELAYS: INDUSTRIAL CONTROL & FACTORY AUTOMATION MARKET, BY REGION, 2026–2032 (USD MILLION)
TABLE 407
SOLID-STATE RELAYS: INDUSTRIAL CONTROL & FACTORY AUTOMATION MARKET IN NORTH AMERICA, BY COUNTRY, 2022–2025 (USD MILLION)
TABLE 408
SOLID-STATE RELAYS: INDUSTRIAL CONTROL & FACTORY AUTOMATION MARKET IN NORTH AMERICA, BY COUNTRY, 2026–2032 (USD MILLION)
TABLE 409
SOLID-STATE RELAYS: INDUSTRIAL CONTROL & FACTORY AUTOMATION MARKET IN EUROPE, BY COUNTRY, 2022–2025 (USD MILLION)
TABLE 410
SOLID-STATE RELAYS: INDUSTRIAL CONTROL & FACTORY AUTOMATION MARKET IN EUROPE, BY COUNTRY, 2026–2032 (USD MILLION)
TABLE 411
SOLID-STATE RELAYS: INDUSTRIAL CONTROL & FACTORY AUTOMATION MARKET IN ASIA PACIFIC, BY COUNTRY, 2022–2025 (USD MILLION)
TABLE 412
SOLID-STATE RELAYS: INDUSTRIAL CONTROL & FACTORY AUTOMATION MARKET IN ASIA PACIFIC, BY COUNTRY, 2026–2032 (USD MILLION)
TABLE 413
SOLID-STATE RELAYS: INDUSTRIAL CONTROL & FACTORY AUTOMATION MARKET IN ROW, BY REGION, 2022–2025 (USD MILLION)
TABLE 414
SOLID STATE RELAY: INDUSTRIAL CONTROL & FACTORY AUTOMATION MARKET IN ROW, BY REGION, 2026–2032 (USD MILLION)
TABLE 415
MACHINE VISION SYSTEMS: INDUSTRIAL CONTROL & FACTORY AUTOMATION MARKET, BY COMPONENT, 2022–2025 (USD MILLION)
TABLE 416
MACHINE VISION SYSTEMS: INDUSTRIAL CONTROL & FACTORY AUTOMATION MARKET, BY COMPONENT, 2026–2032 (USD MILLION)
TABLE 417
MACHINE VISION SYSTEMS: INDUSTRIAL CONTROL & FACTORY AUTOMATION MARKET, BY INDUSTRY, 2022–2025 (USD MILLION)
TABLE 418
MACHINE VISION SYSTEMS: INDUSTRIAL CONTROL & FACTORY AUTOMATION MARKET, BY INDUSTRY, 2026–2032 (USD MILLION)
TABLE 419
MACHINE VISION SYSTEMS: INDUSTRIAL CONTROL & FACTORY AUTOMATION MARKET, BY REGION, 2022–2025 (USD MILLION)
TABLE 420
MACHINE VISION SYSTEMS: INDUSTRIAL CONTROL & FACTORY AUTOMATION MARKET, BY REGION, 2026–2032 (USD MILLION)
TABLE 421
MACHINE VISION SYSTEMS: INDUSTRIAL CONTROL & FACTORY AUTOMATION MARKET IN NORTH AMERICA, BY COUNTRY, 2022–2025 (USD MILLION)
TABLE 422
MACHINE VISION SYSTEM: INDUSTRIAL CONTROL & FACTORY AUTOMATION MARKET IN NORTH AMERICA, BY COUNTRY, 2026–2032 (USD MILLION)
TABLE 423
MACHINE VISION SYSTEM: INDUSTRIAL CONTROL & FACTORY AUTOMATION MARKET IN EUROPE, BY COUNTRY, 2022–2025 (USD MILLION)
TABLE 424
MACHINE VISION SYSTEM: INDUSTRIAL CONTROL & FACTORY AUTOMATION MARKET IN EUROPE, BY COUNTRY, 2026–2032 (USD MILLION)
TABLE 425
MACHINE VISION SYSTEM: INDUSTRIAL CONTROL & FACTORY AUTOMATION MARKET IN ASIA PACIFIC, BY COUNTRY, 2022–2025 (USD MILLION)
TABLE 426
MACHINE VISION SYSTEM: INDUSTRIAL CONTROL & FACTORY AUTOMATION MARKET IN ASIA PACIFIC, BY COUNTRY, 2026–2032 (USD MILLION)
TABLE 427
MACHINE VISION SYSTEM: INDUSTRIAL CONTROL & FACTORY AUTOMATION MARKET IN ROW, BY REGION, 2022–2025 (USD MILLION)
TABLE 428
MACHINE VISION SYSTEM: INDUSTRIAL CONTROL & FACTORY AUTOMATION MARKET IN ROW, BY REGION, 2026–2032 (USD MILLION)
TABLE 429
MACHINE VISION SYSTEMS: INDUSTRIAL CONTROL & FACTORY AUTOMATION MARKET, BY SYSTEM TYPE, 2022–2025 (USD MILLION)
TABLE 430
MACHINE VISION SYSTEM: INDUSTRIAL CONTROL & FACTORY AUTOMATION MARKET, BY SYSTEM TYPE, 2026–2032 (USD MILLION)
TABLE 431
PREDICTIVE MAINTENANCE: INDUSTRIAL CONTROL & FACTORY AUTOMATION MARKET, BY INDUSTRY, 2022–2025 (USD MILLION)
TABLE 432
PREDICTIVE MAINTENANCE: INDUSTRIAL CONTROL & FACTORY AUTOMATION MARKET, BY INDUSTRY, 2026–2032 (USD MILLION)
TABLE 433
PREDICTIVE MAINTENANCE: INDUSTRIAL CONTROL & FACTORY AUTOMATION MARKET, BY REGION, 2022–2025 (USD MILLION)
TABLE 434
PREDICTIVE MAINTENANCE: INDUSTRIAL CONTROL & FACTORY AUTOMATION MARKET, REGION, 2026–2032 (USD MILLION)
TABLE 435
PREDICTIVE MAINTENANCE: INDUSTRIAL CONTROL & FACTORY AUTOMATION MARKET IN NORTH AMERICA, BY COUNTRY, 2022–2025 (USD MILLION)
TABLE 436
PREDICTIVE MAINTENANCE: INDUSTRIAL CONTROL & FACTORY AUTOMATION MARKET IN NORTH AMERICA, BY COUNTRY, 2026–2032 (USD MILLION)
TABLE 437
PREDICTIVE MAINTENANCE: INDUSTRIAL CONTROL & FACTORY AUTOMATION MARKET IN EUROPE, BY COUNTRY, 2022–2025 (USD MILLION)
TABLE 438
PREDICTIVE MAINTENANCE: INDUSTRIAL CONTROL & FACTORY AUTOMATION MARKET IN EUROPE, BY COUNTRY, 2026–2032 (USD MILLION)
TABLE 439
PREDICTIVE MAINTENANCE: INDUSTRIAL CONTROL & FACTORY AUTOMATION MARKET IN ASIA PACIFIC, BY COUNTRY, 2022–2025 (USD MILLION)
TABLE 440
PREDICTIVE MAINTENANCE: INDUSTRIAL CONTROL & FACTORY AUTOMATION MARKET IN ASIA PACIFIC, BY COUNTRY, 2026–2032 (USD MILLION)
TABLE 441
PREDICTIVE MAINTENANCE: INDUSTRIAL CONTROL & FACTORY AUTOMATION MARKET IN ROW, BY REGION, 2022–2025 (USD MILLION)
TABLE 442
PREDICTIVE MAINTENANCE: INDUSTRIAL CONTROL & FACTORY AUTOMATION MARKET IN ROW, BY REGION, 2026–2032 (USD MILLION)
TABLE 443
INDUSTRIAL CONTROL & FACTORY AUTOMATION MARKET, BY INDUSTRY, 2022–2025 (USD MILLION)
TABLE 444
INDUSTRIAL CONTROL & FACTORY AUTOMATION MARKET, BY INDUSTRY, 2026–2032 (USD MILLION)
TABLE 445
INDUSTRIAL CONTROL & FACTORY AUTOMATION MARKET, BY REGION, 2022–2025 (USD MILLION)
TABLE 446
INDUSTRIAL CONTROL & FACTORY AUTOMATION MARKET, BY REGION, 2026–2032 (USD MILLION)
TABLE 447
NORTH AMERICA: INDUSTRIAL CONTROL & FACTORY AUTOMATION MARKET, BY COUNTRY, 2022–2025 (USD MILLION)
TABLE 448
NORTH AMERICA: INDUSTRIAL CONTROL & FACTORY AUTOMATION MARKET, BY COUNTRY, 2026–2032 (USD MILLION)
TABLE 449
NORTH AMERICA: INDUSTRIAL CONTROL & FACTORY AUTOMATION MARKET, BY COMPONENT, 2022–2025 (USD MILLION)
TABLE 450
NORTH AMERICA: INDUSTRIAL CONTROL & FACTORY AUTOMATION MARKET, BY COMPONENT, 2026–2032 (USD MILLION)
TABLE 451
EUROPE: INDUSTRIAL CONTROL & FACTORY AUTOMATION MARKET, BY COUNTRY, 2022–2025 (USD MILLION)
TABLE 452
EUROPE: INDUSTRIAL CONTROL & FACTORY AUTOMATION MARKET, BY COUNTRY, 2026–2032 (USD MILLION)
TABLE 453
EUROPE: INDUSTRIAL CONTROL & FACTORY AUTOMATION MARKET, BY COMPONENT, 2022–2025 (USD MILLION)
TABLE 454
EUROPE: INDUSTRIAL CONTROL & FACTORY AUTOMATION MARKET, BY COMPONENT, 2026–2032 (USD MILLION)
TABLE 455
ASIA PACIFIC: INDUSTRIAL CONTROL & FACTORY AUTOMATION MARKET, BY COUNTRY, 2022–2025 (USD MILLION)
TABLE 456
ASIA PACIFIC: INDUSTRIAL CONTROL & FACTORY AUTOMATION MARKET, BY COUNTRY, 2026–2032 (USD MILLION)
TABLE 457
ASIA PACIFIC: INDUSTRIAL CONTROL & FACTORY AUTOMATION MARKET, BY COMPONENT, 2022–2025 (USD MILLION)
TABLE 458
ASIA PACIFIC: INDUSTRIAL CONTROL & FACTORY AUTOMATION MARKET, BY COMPONENT, 2026–2032 (USD MILLION)
TABLE 459
ROW: INDUSTRIAL CONTROL & FACTORY AUTOMATION MARKET, BY REGION, 2022–2025 (USD MILLION)
TABLE 460
ROW: INDUSTRIAL CONTROL & FACTORY AUTOMATION MARKET, BY REGION, 2026–2032 (USD MILLION)
TABLE 461
ROW: INDUSTRIAL CONTROL & FACTORY AUTOMATION MARKET, BY COMPONENT, 2022–2025 (USD MILLION)
TABLE 462
ROW: INDUSTRIAL CONTROL & FACTORY AUTOMATION MARKET, BY COMPONENT, 2026–2032 (USD MILLION)
TABLE 463
MIDDLE EAST & AFRICA: INDUSTRIAL CONTROL & FACTORY AUTOMATION MARKET, BY COUNTRY, 2022–2025 (USD MILLION)
TABLE 464
MIDDLE EAST & AFRICA: INDUSTRIAL CONTROL & FACTORY AUTOMATION MARKET, BY COUNTRY, 2026–2032 (USD MILLION)
TABLE 465
SOUTH AMERICA: INDUSTRIAL CONTROL & FACTORY AUTOMATION MARKET, BY COUNTRY, 2022–2025 (USD MILLION)
TABLE 466
SOUTH AMERICA: INDUSTRIAL CONTROL & FACTORY AUTOMATION MARKET, BY COUNTRY, 2026–2032 (USD MILLION)
TABLE 467
INDUSTRIAL CONTROL & FACTORY AUTOMATION MARKET: KEY PLAYER STRATEGIES/RIGHT TO WIN, 2023–2026
TABLE 468
PROCESS ANALYZERS MARKET SHARE ANALYSIS, 2025
TABLE 469
MACHINE SAFETY MARKET SHARE ANALYSIS, 2025
TABLE 470
PROCESS ANALYZERS MARKET: REGION FOOTPRINT
TABLE 471
PROCESS ANALYZERS MARKET: LIQUID ANALYZER TYPE FOOTPRINT
TABLE 472
PROCESS ANALYZERS MARKET: GAS ANALYZER TYPE FOOTPRINT
TABLE 473
PROCESS ANALYZERS MARKET: INDUSTRY FOOTPRINT
TABLE 474
MACHINE SAFETY MARKET: REGION FOOTPRINT
TABLE 475
MACHINE SAFETY MARKET: INDUSTRY FOOTPRINT
TABLE 476
MACHINE SAFETY MARKET: OFFERING FOOTPRINT
TABLE 477
MACHINE SAFETY MARKET: COMPONENT FOOTPRINT
TABLE 478
INDUSTRIAL CONTROL & FACTORY AUTOMATION MARKET: DETAILED LIST OF KEY STARTUPS/SMES
TABLE 479
PROCESS ANALYZERS MARKET: COMPETITIVE BENCHMARKING OF KEY STARTUPS/SMES
TABLE 480
MACHINE SAFETY MARKET: COMPETITIVE BENCHMARKING OF KEY STARTUPS/SMES, 2024
TABLE 481
INDUSTRIAL CONTROL & FACTORY AUTOMATION MARKET: PRODUCT LAUNCHES, MAY 2023−MAY 2026
TABLE 482
INDUSTRIAL CONTROL & FACTORY AUTOMATION MARKET: DEALS, MAY 2023−MAY 2026
TABLE 483
INDUSTRIAL CONTROL & FACTORY AUTOMATION MARKET: EXPANSIONS, MAY 2023−MAY 2026
TABLE 484
ABB: COMPANY OVERVIEW
TABLE 485
ABB: PRODUCTS/SOLUTIONS/SERVICES OFFERED
TABLE 486
ABB: PRODUCT LAUNCHES/DEVELOPMENTS
TABLE 488
ABB: EXPANSIONS
TABLE 489
SIEMENS: COMPANY OVERVIEW
TABLE 490
SIEMENS: PRODUCTS/SOLUTIONS/SERVICES OFFERED
TABLE 491
SIEMENS: PRODUCT LAUNCHES
TABLE 493
HONEYWELL INTERNATIONAL INC.: COMPANY OVERVIEW
TABLE 494
HONEYWELL INTERNATIONAL INC.: PRODUCTS/SOLUTIONS/SERVICES OFFERED
TABLE 495
HONEYWELL INTERNATIONAL INC.: PRODUCT LAUNCHES
TABLE 496
HONEYWELL INTERNATIONAL INC.: DEALS
TABLE 497
HONEYWELL INTERNATIONAL INC.: OTHER DEVELOPMENTS
TABLE 498
SCHNEIDER ELECTRIC: COMPANY OVERVIEW
TABLE 499
SCHNEIDER ELECTRIC: PRODUCTS/SOLUTIONS/SERVICES OFFERED
TABLE 500
SCHNEIDER ELECTRIC: PRODUCT LAUNCHES
TABLE 501
SCHNEIDER ELECTRIC: DEALS
TABLE 502
ROCKWELL AUTOMATION: COMPANY OVERVIEW
TABLE 503
ROCKWELL AUTOMATION: PRODUCTS/SOLUTIONS/SERVICES OFFERED
TABLE 504
ROCKWELL AUTOMATION: PRODUCT LAUNCHES
TABLE 505
ROCKWELL AUTOMATION: DEALS
TABLE 506
ROCKWELL AUTOMATION: EXPANSIONS
TABLE 507
EMERSON ELECTRIC CO.: COMPANY OVERVIEW
TABLE 508
EMERSON ELECTRIC CO.: PRODUCTS/SOLUTIONS/SERVICES OFFERED
TABLE 509
EMERSON ELECTRIC CO.: PRODUCT LAUNCHES
TABLE 510
EMERSON ELECTRIC CO.: DEALS
TABLE 511
YOKOGAWA ELECTRIC CORPORATION: COMPANY OVERVIEW
TABLE 512
YOKOGAWA ELECTRIC CORPORATION: PRODUCTS/SOLUTIONS/SERVICES OFFERED
TABLE 513
YOKOGAWA ELECTRIC CORPORATION: PRODUCT LAUNCHES
TABLE 514
YOKOGAWA ELECTRIC CORPORATION: DEALS
TABLE 515
FANUC CORPORATION: COMPANY OVERVIEW
TABLE 516
FANUC CORPORATION: PRODUCTS/SOLUTIONS/SERVICES OFFERED
TABLE 517
FANUC CORPORATION: PRODUCT LAUNCHES
TABLE 518
FANUC CORPORATION: DEALS
TABLE 519
FANUC CORPORATION: EXPANSIONS
TABLE 520
MITSUBISHI ELECTRIC CORPORATION: COMPANY OVERVIEW
TABLE 521
MITSUBISHI ELECTRIC CORPORATION: PRODUCTS/SOLUTIONS/SERVICES OFFERED
TABLE 522
MITSUBISHI ELECTRIC CORPORATION: PRODUCT LAUNCHES
TABLE 523
MITSUBISHI ELECTRIC CORPORATION: DEALS
TABLE 524
OMRON CORPORATION: COMPANY OVERVIEW
TABLE 525
OMRON CORPORATION: PRODUCTS/SOLUTIONS/SERVICES OFFERED
TABLE 526
OMRON CORPORATION: PRODUCT LAUNCHES
TABLE 527
GE VERNOVA: COMPANY OVERVIEW
TABLE 528
GE VERNOVA: PRODUCTS/SOLUTIONS/SERVICES OFFERED
TABLE 529
GE VERNOVA: PRODUCT LAUNCHES
TABLE 530
ENDRESS+HAUSER GROUP SERVICES AG: COMPANY OVERVIEW
TABLE 531
ENDRESS+HAUSER GROUP SERVICES AG: PRODUCTS/SOLUTIONS/SERVICES OFFERED
TABLE 532
ENDRESS+HAUSER GROUP SERVICES AG: PRODUCT LAUNCHES
TABLE 533
ENDRESS+HAUSER GROUP SERVICES AG: DEALS
TABLE 534
ENDRESS+HAUSER GROUP SERVICES AG: EXPANSIONS
TABLE 535
FUJI ELECTRIC CO., LTD.: COMPANY OVERVIEW
TABLE 536
HITACHI, LTD.: COMPANY OVERVIEW
TABLE 537
KROHNE MESSTECHNIK GMBH: COMPANY OVERVIEW
TABLE 538
AZBIL CORPORATION: COMPANY OVERVIEW
TABLE 539
WIKA ALEXANDER WIEGAND SE & CO. KG: COMPANY OVERVIEW
TABLE 540
DWYER INSTRUMENTS, LLC: COMPANY OVERVIEW
TABLE 541
STRATASYS: COMPANY OVERVIEW
TABLE 542
3D SYSTEMS, INC.: COMPANY OVERVIEW
TABLE 543
VEGA GRIESHABER KG: COMPANY OVERVIEW
TABLE 544
TRIDITIVE: COMPANY OVERVIEW
TABLE 545
ROBOZE: COMPANY OVERVIEW
TABLE 546
ZIVID: COMPANY OVERVIEW
TABLE 547
INXPECT S.P.A.: COMPANY OVERVIEW
TABLE 548
ULTIMAKER: COMPANY OVERVIEW
TABLE 549
NANO DIMENSION: COMPANY OVERVIEW
TABLE 550
ONROBOT A/S: COMPANY OVERVIEW
TABLE 551
ADDVERB TECHNOLOGIES LIMITED: COMPANY OVERVIEW
TABLE 552
LOCUS ROBOTICS: COMPANY OVERVIEW
TABLE 553
EIRATECH ROBOTICS LTD.: COMPANY OVERVIEW
TABLE 554
GREYORANGE: COMPANY OVERVIEW
TABLE 555
SOFTGRIPPING: COMPANY OVERVIEW
TABLE 556
TEGAN INNOVATIONS: COMPANY OVERVIEW
TABLE 557
PERKINELMER: COMPANY OVERVIEW
TABLE 558
NOVA ANALYTICAL SYSTEMS: COMPANY OVERVIEW
TABLE 559
EAO AG: COMPANY OVERVIEW
TABLE 560
INDUCTIVE AUTOMATION, LLC: COMPANY OVERVIEW
TABLE 561
BECKHOFF AUTOMATION: COMPANY OVERVIEW
TABLE 562
ACNODES CORPORATION: COMPANY OVERVIEW
TABLE 563
ADITECH ICT PVT. LTD.: COMPANY OVERVIEW
TABLE 564
BREEZE TECHNOLOGIES: COMPANY OVERVIEW
TABLE 565
ELICHENS: COMPANY OVERVIEW
TABLE 566
BANNER ENGINEERING CORP.: COMPANY OVERVIEW
TABLE 567
BALLUFF GMBH: COMPANY OVERVIEW
TABLE 568
BAUMER: COMPANY OVERVIEW
TABLE 569
PILZ GMBH & CO. KG: COMPANY OVERVIEW
TABLE 570
QUALITAS TECHNOLOGIES: COMPANY OVERVIEW
TABLE 571
ING. PUNZENBERGER COPA-DATA GMBH: COMPANY OVERVIEW
TABLE 572
SPRECHER AUTOMATION GMBH: COMPANY OVERVIEW
TABLE 573
EPICOR SOFTWARE CORPORATION: COMPANY OVERVIEW
TABLE 574
EXTENSIV: COMPANY OVERVIEW
TABLE 575
CRYSTAL INSTRUMENTS: COMPANY OVERVIEW
TABLE 576
42Q: COMPANY OVERVIEW
TABLE 577
AEGIS INDUSTRIAL SOFTWARE CORPORATION: COMPANY OVERVIEW
TABLE 578
INDUSTRIAL CONTROL & FACTORY AUTOMATION MARKET: LIMITATIONS AND ASSOCIATED RISKS
FIGURE 1
INDUSTRIAL CONTROL & FACTORY AUTOMATION MARKET SEGMENTATION AND REGIONAL SCOPE
FIGURE 2
DURATION COVERED
FIGURE 4
GLOBAL INDUSTRIAL CONTROL & FACTORY AUTOMATION MARKET, 2022–2032
FIGURE 5
MAJOR STRATEGIES ADOPTED BY KEY PLAYERS IN INDUSTRIAL CONTROL & FACTORY AUTOMATION MARKET, 2022–2025
FIGURE 6
DISRUPTIONS INFLUENCING GROWTH OF INDUSTRIAL CONTROL & FACTORY AUTOMATION MARKET
FIGURE 7
HIGH-GROWTH SEGMENTS IN INDUSTRIAL CONTROL & FACTORY AUTOMATION MARKET, 2026–2032
FIGURE 8
ASIA PACIFIC TO REGISTER HIGHEST CAGR IN INDUSTRIAL CONTROL & FACTORY AUTOMATION MARKET DURING FORECAST PERIOD
FIGURE 9
RISING INDUSTRIAL DIGITALIZATION AND AUTOMATION INVESTMENTS TO FUEL MARKET EXPANSION
FIGURE 10
INDUSTRIAL SOFTWARE TO ACCOUNT FOR LARGEST MARKET SHARE IN 2032
FIGURE 11
AUTOMOTIVE INDUSTRY TO ACCOUNT FOR LARGEST MARKET SHARE DURING FORECAST PERIOD
FIGURE 12
INDUSTRIAL SOFTWARE AND CHINA TO HOLD LARGEST SHARES OF ASIA PACIFIC MARKET IN 2032
FIGURE 13
INDIA TO EXHIBIT HIGHEST CAGR DURING FORECAST PERIOD
FIGURE 14
INDUSTRIAL CONTROL & FACTORY AUTOMATION MARKET: DRIVERS, RESTRAINTS, OPPORTUNITIES, AND CHALLENGES
FIGURE 15
IMPACT ANALYSIS: DRIVERS
FIGURE 16
IMPACT ANALYSIS: RESTRAINTS
FIGURE 17
IMPACT ANALYSIS: OPPORTUNITIES
FIGURE 18
IMPACT ANALYSIS: CHALLENGES
FIGURE 19
INDUSTRIAL CONTROL & FACTORY AUTOMATION MARKET: PORTER’S FIVE FORCES ANALYSIS
FIGURE 20
INDUSTRIAL CONTROL & FACTORY AUTOMATION MARKET: VALUE CHAIN ANALYSIS
FIGURE 21
INDUSTRIAL CONTROL & FACTORY AUTOMATION MARKET: ECOSYSTEM ANALYSIS
FIGURE 22
TRADITIONAL INDUSTRIAL ROBOTS: AVERAGE SELLING PRICE TREND, BY TYPE, 2022–2025
FIGURE 23
INDUSTRIAL ROBOTS: AVERAGE SELLING PRICE TREND OF ARTICULATED ROBOTS, BY REGION, 2022–2025
FIGURE 24
PROCESS ANALYZERS: REGION-WISE AVERAGE SELLING PRICE TREND, 2021–2025
FIGURE 25
IMPORT DATA FOR HS CODE 847950-COMPLIANT PRODUCTS FOR TOP FIVE COUNTRIES, 2021–2025
FIGURE 26
EXPORT DATA FOR HS CODE 847950-COMPLIANT PRODUCTS FOR TOP FIVE COUNTRIES, 2021–2025
FIGURE 27
TRENDS/DISRUPTIONS INFLUENCING CUSTOMER BUSINESS
FIGURE 28
INVESTMENT AND FUNDING SCENARIO, 2021–2025
FIGURE 29
INDUSTRIAL CONTROL & FACTORY AUTOMATION MARKET: PATENT ANALYSIS, 2015–2025
FIGURE 30
INDUSTRIAL CONTROL & FACTORY AUTOMATION MARKET: DECISION-MAKING FACTORS
FIGURE 31
INFLUENCE OF STAKEHOLDERS ON BUYING PROCESS FOR TOP 3 INDUSTRIES
FIGURE 32
KEY BUYING CRITERIA FOR TOP 3 INDUSTRIES
FIGURE 33
INDUSTRIAL CONTROL & FACTORY AUTOMATION MARKET: ADOPTION BARRIERS & INTERNAL CHALLENGES
FIGURE 34
INDUSTRIAL CONTROL & FACTORY AUTOMATION MARKET, BY COMPONENT
FIGURE 35
INDUSTRIAL SOFTWARE HOLDS LARGEST MARKET SHARE DURING FORECAST PERIOD
FIGURE 36
INDUSTRIAL CONTROL SYSTEMS MARKET, BY TYPE
FIGURE 37
INDUSTRIAL SOFTWARE MARKET, BY TYPE
FIGURE 38
INDUSTRIAL ROBOTICS MARKET, BY TYPE
FIGURE 39
PROCESS ANALYZERS MARKET, BY TYPE
FIGURE 40
FIELD INSTRUMENTATION MARKET, BY TYPE
FIGURE 41
FLOW METERS MARKET, BY TYPE
FIGURE 42
INDUSTRIAL COMMUNICATION MARKET, BY OFFERING
FIGURE 43
INDUSTRIAL MONITORING & SAFETY MARKET, BY TYPE
FIGURE 44
INDUSTRIAL CONTROL & FACTORY AUTOMATION MARKET, BY INDUSTRY
FIGURE 45
MEDICAL DEVICES INDUSTRY TO REGISTER HIGHEST CAGR DURING FORECAST PERIOD
FIGURE 46
INDUSTRIAL CONTROL & FACTORY AUTOMATION MARKET, BY REGION
FIGURE 47
ASIA PACIFIC TO REGISTER HIGHEST CAGR DURING FORECAST PERIOD
FIGURE 48
INDIA TO REGISTER HIGHEST CAGR DURING FORECAST PERIOD
FIGURE 49
NORTH AMERICA: INDUSTRIAL CONTROL & FACTORY AUTOMATION MARKET SNAPSHOT
FIGURE 50
US TO ACCOUNT FOR LARGEST SHARE OF INDUSTRIAL CONTROL & FACTORY AUTOMATION MARKET IN NORTH AMERICA IN 2026
FIGURE 51
EUROPE: INDUSTRIAL CONTROL & FACTORY AUTOMATION MARKET SNAPSHOT
FIGURE 52
GERMANY TO ACCOUNT FOR LARGEST SHARE OF INDUSTRIAL CONTROL & FACTORY AUTOMATION MARKET IN EUROPE IN 2026
FIGURE 53
ASIA PACIFIC: INDUSTRIAL CONTROL & FACTORY AUTOMATION MARKET SNAPSHOT
FIGURE 54
CHINA TO ACCOUNT FOR LARGEST SHARE OF INDUSTRIAL CONTROL & FACTORY AUTOMATION MARKET IN ASIA PACIFIC IN 2026
FIGURE 55
ROW: INDUSTRIAL CONTROL & FACTORY AUTOMATION MARKET SNAPSHOT
FIGURE 56
SOUTH AMERICA TO REGISTER HIGHER CAGR DURING FORECAST PERIOD
FIGURE 57
PROCESS ANALYZERS MARKET: REVENUE ANALYSIS OF KEY PLAYERS, 2021–2025
FIGURE 58
MACHINE SAFETY MARKET: REVENUE ANALYSIS OF KEY PLAYERS, 2021–2025 (USD MILLION)
FIGURE 59
PROCESS ANALYZERS MARKET SHARE OF KEY PLAYERS, 2025
FIGURE 60
MACHINE SAFETY MARKET SHARE ANALYSIS OF KEY PLAYERS, 2025
FIGURE 61
PROCESS ANALYZERS MARKET: COMPANY VALUATION
FIGURE 62
PROCESS ANALYZERS MARKET: FINANCIAL METRICS (EV/EBITDA)
FIGURE 63
MACHINE SAFETY MARKET: COMPANY VALUATION
FIGURE 64
MACHINE SAFETY MARKET: FINANCIAL METRICS (EV/EBITDA)
FIGURE 65
PROCESS ANALYZERS MARKET: BRAND COMPARISON OF KEY PLAYERS
FIGURE 66
MACHINE SAFETY MARKET: BRAND COMPARISON OF KEY PLAYERS
FIGURE 67
PROCESS ANALYZERS MARKET: COMPANY EVALUATION MATRIX (KEY PLAYERS), 2025
FIGURE 68
MACHINE SAFETY MARKET: COMPANY EVALUATION MATRIX (KEY PLAYERS), 2025
FIGURE 69
PROCESS ANALYZERS MARKET: COMPANY FOOTPRINT, 2025
FIGURE 70
MACHINE SAFETY MARKET: COMPANY FOOTPRINT, 2025
FIGURE 71
PROCESS ANALYZERS MARKET: COMPANY EVALUATION MATRIX (STARTUPS/SMES), 2025
FIGURE 72
MACHINE SAFETY MARKET: COMPANY EVALUATION MATRIX (STARTUPS/SMES), 2025
FIGURE 73
ABB: COMPANY SNAPSHOT
FIGURE 74
SIEMENS: COMPANY SNAPSHOT
FIGURE 75
HONEYWELL INTERNATIONAL INC.: COMPANY SNAPSHOT
FIGURE 76
SCHNEIDER ELECTRIC: COMPANY SNAPSHOT
FIGURE 77
ROCKWELL AUTOMATION: COMPANY SNAPSHOT
FIGURE 78
EMERSON ELECTRIC CO.: COMPANY SNAPSHOT
FIGURE 79
YOKOGAWA ELECTRIC CORPORATION: COMPANY SNAPSHOT
FIGURE 80
FANUC CORPORATION: COMPANY SNAPSHOT
FIGURE 81
MITSUBISHI ELECTRIC CORPORATION: COMPANY SNAPSHOT
FIGURE 82
OMRON CORPORATION: COMPANY SNAPSHOT
FIGURE 83
GE VERNOVA: COMPANY SNAPSHOT
FIGURE 84
ENDRESS+HAUSER GROUP SERVICES AG: COMPANY SNAPSHOT
FIGURE 85
INDUSTRIAL CONTROL & FACTORY AUTOMATION MARKET: RESEARCH DESIGN
FIGURE 86
MARKET SIZE ESTIMATION METHODOLOGY: BOTTOM-UP APPROACH
FIGURE 87
MARKET SIZE ESTIMATION METHODOLOGY: TOP-DOWN APPROACH
FIGURE 88
PROCESS ANALYZERS MARKET SIZE ESTIMATION METHODOLOGY (SUPPLY SIDE)
FIGURE 89
MACHINE SAFETY MARKET SIZE ESTIMATION METHODOLOGY (SUPPLY SIDE)
FIGURE 90
INDUSTRIAL CONTROL & FACTORY AUTOMATION MARKET: DATA TRIANGULATION
FIGURE 91
INDUSTRIAL CONTROL & FACTORY AUTOMATION MARKET: RESEARCH ASSUMPTIONS


 Exclusive indicates content/data unique to MarketsandMarkets and not available with any competitors.
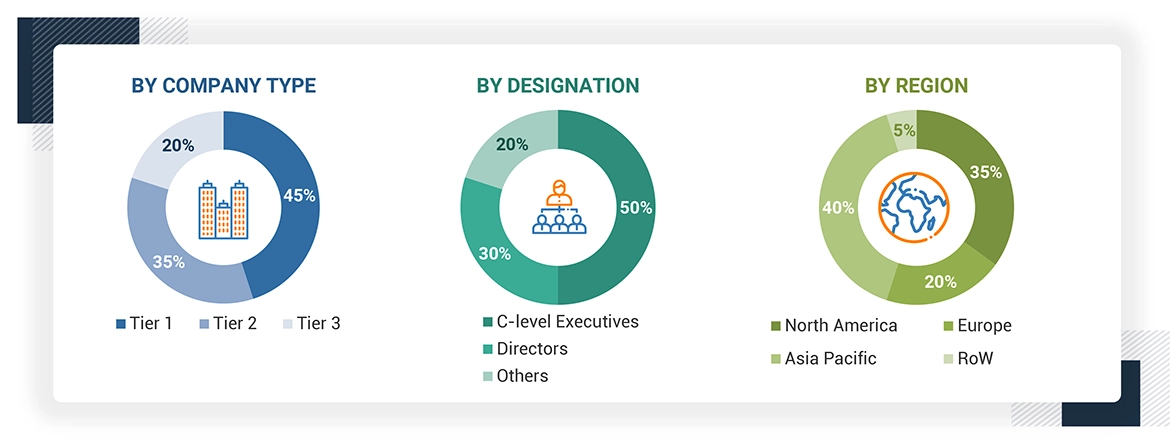
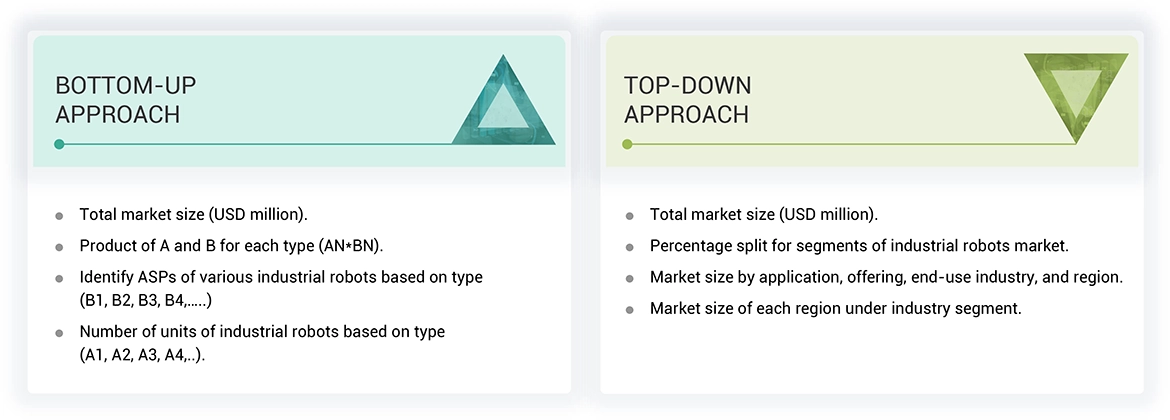


Blake
Apr, 2026
How does investment in industrial 3D printing compare to traditional automation technologies in terms of ROI, adoption risk, and integration complexity?.
Paul
Apr, 2026
What market entry strategies (local manufacturing, partnerships, or distribution networks) are proving most effective for new entrants in this space?.