
Cybersecurity Insurance Market

Cybersecurity Insurance Market by (Analytics Platforms, Disaster Recovery & Business Continuity, Risk Assessment, Resilience), Coverage (Data Breach, Cyber Liability), by Type (Packaged, Standalone), by Provider (Technology, Insurance) - Global Forecast to 2030


OVERVIEW
Source: Secondary Research, Interviews with Experts, MarketsandMarkets Analysis
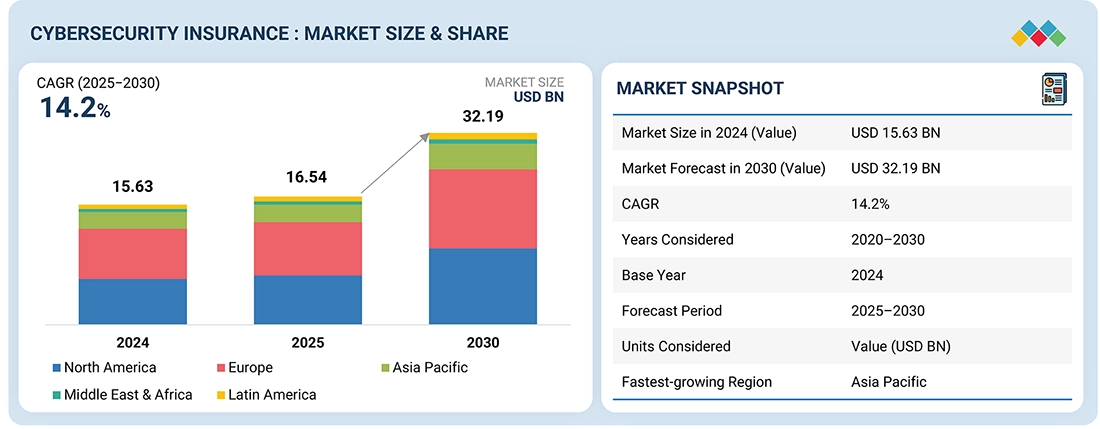
The cybersecurity insurance market is expected to grow from USD 16.54 billion in 2025 to USD 32.19 billion by 2030 at a compounded annual growth rate (CAGR) of 14.2% during the forecast period. The cybersecurity insurance market is driven by a confluence of factors that reflect the evolving threat landscape and increased digital dependency across industries. The rising frequency and sophistication of cyberattacks, especially ransomware, phishing, and data breaches, have made cyber insurance a critical risk transfer mechanism for organizations of all sizes. Regulatory pressures such as GDPR, CCPA, NIS2, and other national privacy laws are compelling businesses to adopt cyber insurance to mitigate potential non-compliance penalties. At the same time, the rapid adoption of digital technologies, cloud services, IoT, and remote work models has significantly expanded the attack surface, increasing exposure to cyber risks. This has placed cybersecurity at the forefront of board-level risk discussions, with investors and leadership prioritizing risk mitigation strategies, including cyber insurance.
KEY TAKEAWAYS
- The North America cybersecurity insurance market accounted for a 64.9% revenue share in 2025.
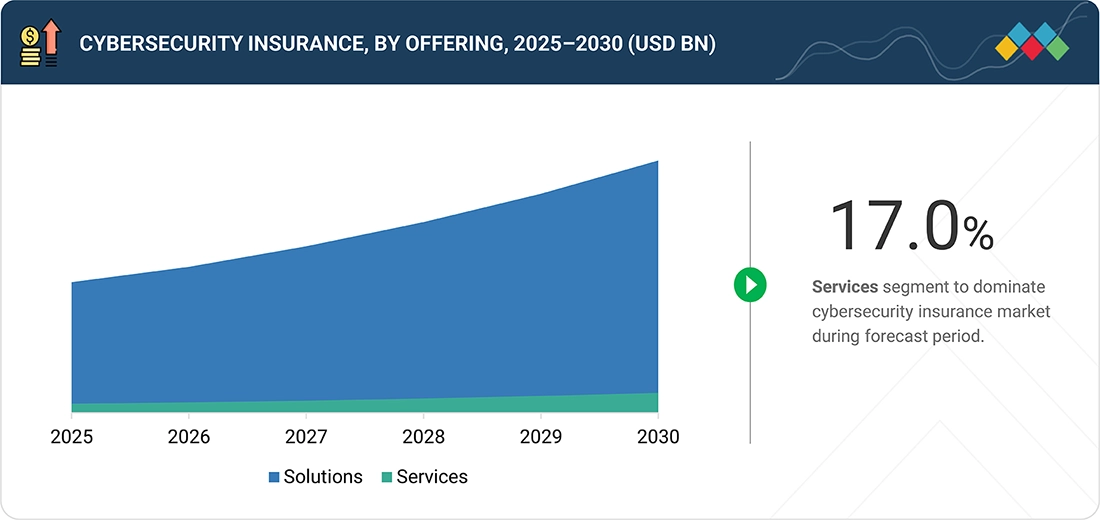
- By offering, the services segment is expected to register the highest CAGR of 17.4%.
- By insurance coverage, the data breach segment is projected to grow at the fastest rate from 2025 to 2030.
- Company BitSight, Mitratech, and ReadSeal were identified as some of the star players in the cybersecurity insurance market (global), given their strong market share and product footprint.
- Companies Coalition, AT-BAY, and RiskSense among others, have distinguished themselves among startups and SMEs by securing strong footholds in specialized niche areas, underscoring their potential as emerging market leaders
The cybersecurity insurance market is experiencing strong momentum due to the escalating frequency and severity of cyberattacks, especially ransomware and data breaches, which are driving organizations to secure financial safeguards. Regulatory developments such as GDPR, NIS2, and evolving national cybersecurity frameworks are pushing companies to adopt cyber insurance as part of their compliance strategies. As businesses rapidly digitize through increased cloud adoption, IoT integration, and hybrid work environments, their vulnerability to cyber threats grows, expanding the demand for cyber coverage. Notably, small and mid-sized enterprises are becoming prominent targets, prompting a surge in demand for cost-effective, bundled insurance solutions. Insurers are responding with advanced, risk-based offerings that integrate threat intelligence, proactive security assessments, and incident response capabilities.
TRENDS & DISRUPTIONS IMPACTING CUSTOMERS' CUSTOMERS
The cybersecurity insurance YCC shift reflects a transition from reactive, premium-based models to proactive, data-driven services. Insurers are moving toward AI-powered risk modeling and collaborative ecosystems, enabling enterprises and SMEs to strengthen resilience and recovery while insurers achieve sustainable growth.
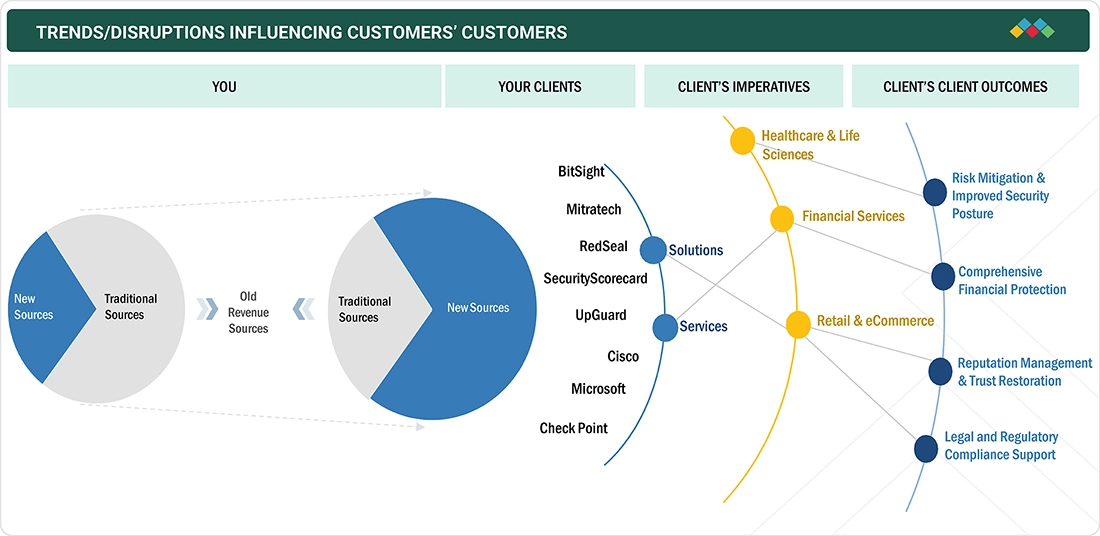
Source: Secondary Research, Interviews with Experts, MarketsandMarkets Analysis
MARKET DYNAMICS
Level
-
Surge in mandatory cybersecurity regulations and legislations to boost demand for insurance protection

-
High rate of recovery of financial losses to promote growth of cybersecurity insurance market

Level
-
Lack of awareness related to cyber insurance and reluctance to choose cybersecurity insurance over cybersecurity solutions

-
Soaring cybersecurity insurance costs

Level
-
Exclusion of cybersecurity insurance cover from Property and Casualty (P&C) insurance

-
Adoption of artificial intelligence and blockchain technology for risk analytics

Level
-
Data privacy concerns

-
Cyber insurers grapple to gain traction despite soaring cybersecurity risks

Source: Secondary Research, Interviews with Experts, MarketsandMarkets Analysis
Driver: Surge in mandatory cybersecurity regulations and legislations to boost demand for insurance protection
Government regulatory bodies and law enforcement agencies have taken steps to improve data security and protection. Due to the COVID pandemic, individuals and organizations are increasingly seeking cybersecurity insurance policies. In California, a bill was introduced in February 2020 to make cybersecurity insurance mandatory for state contractors who process regulated and protected personal information. The increase in data privacy laws, including Personally Identifiable Information (PII) and the Health Insurance Portability and Accountability Act (HIPAA) in the US, the Payment Card Industry-Data Security Standard (PCI-DSS) globally, and the European Union’s General Data Protection Regulation (GDPR) are prompting insurance providers to prioritize cybersecurity insurance measures. With the rise of digitalization, cyberattacks have increased after the COVID pandemic. To address this, the European Insurance and Occupational Pensions Authority (EIOPA) released cyber underwriting and supervisory technology strategies. EIOPA will work with national authorities to ensure periodic assessment and supervision of cyber underwriting and risk management practices in Europe. Cybersecurity insurance policies cover regulatory penalties and fines for the affected parties, and premiums are dependent on an organization's compliance with regulatory policies.
Restraint: Lack of awareness related to cyber insurance and reluctance to choose cybersecurity insurance over cybersecurity solutions
A key restraint hindering the growth of the cybersecurity insurance market is the lack of awareness among enterprises regarding the purpose and benefits of cyber insurance, coupled with a general reluctance to prioritize it over traditional cybersecurity solutions. Many organizations, particularly small and medium-sized enterprises, often misconceive that deploying advanced cybersecurity tools such as firewalls, antivirus software, and intrusion detection systems is sufficient to mitigate all cyber risks. This misunderstanding leads to hesitation in allocating budget towards insurance products that are perceived as non-essential or redundant. Moreover, the complexity of cyber insurance policies, unclear coverage terms, and the absence of standardized frameworks contribute to confusion and mistrust among potential buyers. Business leaders frequently struggle to comprehend the value proposition of cyber insurance, viewing it as less tangible compared to direct cybersecurity investments. This reluctance is further amplified by the lack of regulatory mandates or widespread educational initiatives promoting insurance as a vital component of cyber risk management. Consequently, this gap in understanding and confidence significantly restrains the broader adoption of cybersecurity insurance, limiting its integration into organizational risk strategies.
Opportunity: Exclusion of cybersecurity insurance cover from Property and Casualty (P&C) insurance
The exclusion of cybersecurity insurance coverage from traditional Property and Casualty (P&C) insurance policies has emerged as a significant opportunity for the cybersecurity insurance market. As cyber threats become more frequent and financially damaging, insurers are increasingly removing ambiguous or unintended cyber coverage, often referred to as "silent cyber", from general liability, property, and business interruption policies. This has left organizations with a critical coverage gap, prompting them to seek dedicated cyber insurance solutions to mitigate the financial impact of incidents such as data breaches, ransomware attacks, and IT system disruptions. The move towards explicit cyber exclusions is being reinforced by regulatory bodies and industry guidelines, which advocate for clearer delineation of cyber risk coverage. Consequently, this shift is driving higher demand for specialized cyber insurance products that offer tailored protections and value-added services. It also enables insurers to develop more focused offerings, targeting both large enterprises and small to mid-sized businesses that were previously reliant on general policies. High-profile cyberattacks, such as the NotPetya virus, have highlighted the need for explicit cyber coverage. Insurers and regulators are working to develop standalone cybersecurity insurance policies for better clarity and to eliminate 'silent cyber' claims. As a result, the cybersecurity insurance market is poised for significant growth, benefiting from a structural change in enterprise risk management strategies.
Challenge:Data privacy concerns
Data privacy concerns pose a critical challenge to the cybersecurity insurance market, primarily due to the increasingly complex and evolving regulatory landscape. With the enforcement of stringent data protection laws such as GDPR, CCPA, and other national frameworks, insurers face heightened legal and compliance risks. These laws vary widely across jurisdictions, making it difficult to standardize policies and accurately assess liabilities. Furthermore, there is often ambiguity around whether cyber insurance policies cover fines or legal actions resulting from data privacy violations, leading to disputes during claims settlement. Insurers also encounter underwriting difficulties as they lack sufficient historical data to evaluate data privacy risks effectively, especially in sectors handling sensitive information such as healthcare and finance. Additionally, organizations may hesitate to share comprehensive data with insurers for fear of regulatory repercussions or reputational harm, which undermines accurate risk assessment and delays claims processing. This tension between maintaining privacy and facilitating insurance operations significantly complicates the value proposition of cybersecurity insurance, making data privacy concerns a persistent and multifaceted barrier to market growth.
Cybersecurity Insurance Market: COMMERCIAL USE CASES ACROSS INDUSTRIES
| COMPANY | USE CASE DESCRIPTION | BENEFITS |
|---|---|---|
 |
Fubon utilized SecurityScorecard to assess the security posture of potential customers, enabling them to identify low-risk candidates for cyber insurance. By reviewing the scores, Fubon determined if a prospect is profitable for coverage and incorporates the risk level into the premium. Additionally, it used ratings to raise risk awareness among current customers, helping them decide if cyber insurance is a valuable addition. | SecurityScorecard provided Fubon with the necessary insight into a customer’s potential risk, enabling a thorough evaluation process. By incorporating SecurityScorecard in its assessment, Fubon effectively lowered the risk of unexpected insurance payouts. Furthermore, Fubon used the ratings to educate its customers about their cyber risk, thereby increasing their awareness of cybersecurity as a critical business concern. |
 |
The country mutual insurance company used CyberArk’s features and functionalities, such as secured privileged credentials in a vault, credential rotation, shared service accounts, credentials used by applications, managing third-party remote access, and monitoring privileged sessions. To secure user credentials and ensure security in line with productivity and manage unaudited third-party and remote vendor access with adherence to strong compliance requirements. | Country Mutual Insurance Company used CyberArk to manage and secure its privileged accounts and credentials. The cost and time required to manage and maintain privileged accounts and credentials were reduced |
Logos and trademarks shown above are the property of their respective owners. Their use here is for informational and illustrative purposes only.
MARKET ECOSYSTEM
The cybersecurity insurance market ecosystem integrates a diverse range of stakeholders to tackle cyber risks effectively. Insurance carriers and providers offer tailored coverage solutions, while cybersecurity experts deliver advanced protective measures. Risk analytics specialists enhance risk evaluation, and incident response teams provide rapid recovery support. Threat intelligence aggregators improve threat detection capabilities, and regulatory bodies establish standards and guidelines, creating a robust framework to mitigate cyber threats and ensure resilience.
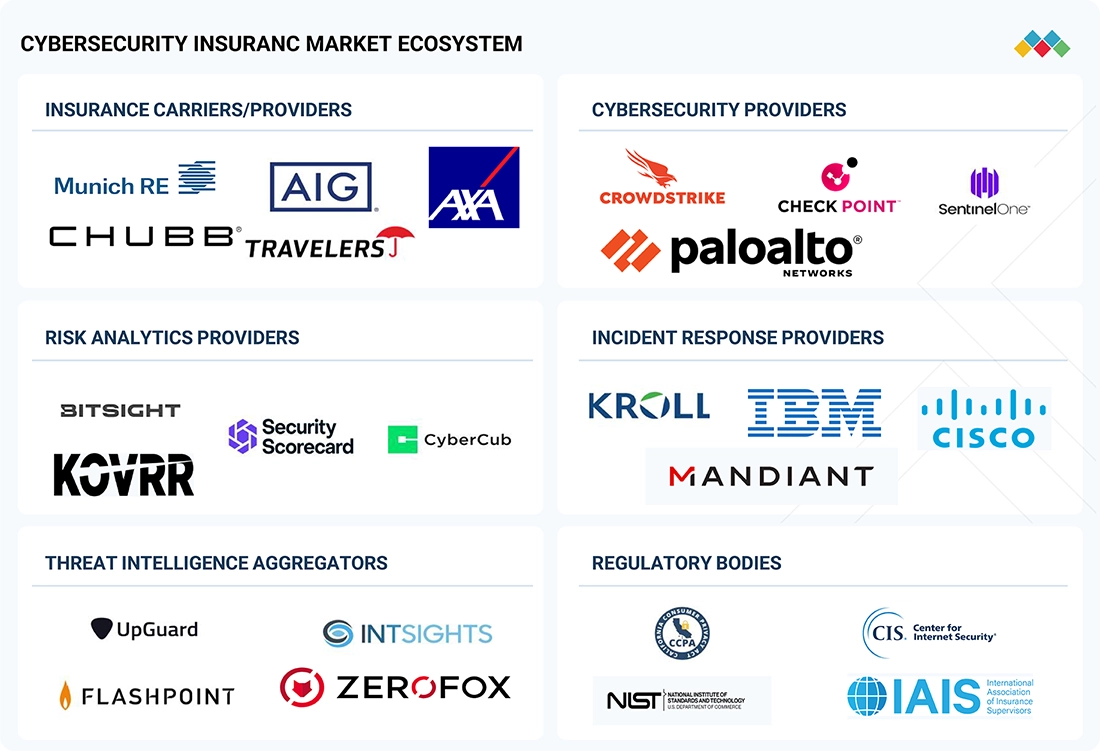
Logos and trademarks shown above are the property of their respective owners. Their use here is for informational and illustrative purposes only.
MARKET SEGMENTS
Source: Secondary Research, Interviews with Experts, MarketsandMarkets Analysis
Cybersecurity Insurance Market, By Offering
By offering, the services segment is expected to hold a higher CAGR during the forecast period. The cybersecurity insurance market by services has been segmented into consulting or advisory services, security awareness training, and other services. Companies that want a quick response to cyberattacks often turn to cybersecurity insurance services, which offer 24/7 support. The specifics of these services differ depending on factors like a company's digital infrastructure, risk assessment, and compliance with national and international regulations. Travelers Insurance provides pre-breach services to its CyberRisk and CyberFirst policyholders through Symantec. Symantec's Cyber Resilience Readiness Assessment tool, which involves input from thousands of security professionals, helps organizations address security concerns and offers consultations with Symantec's cybersecurity experts. Overall, cybersecurity insurance services are vital for companies to better handle cyber risks and exposures both before and after a security incident
Cybersecurity Insurance Market, By Insurance Type
By insurance type, the standalone segment is expected to hold the largest market size during the forecast period. Standalone cyber insurance refers to a dedicated insurance policy specifically designed to address cyber-related risks such as data breaches, ransomware attacks, and other digital threats. Unlike bundled or add-on cyber coverage found within general liability or property insurance, standalone policies offer broader and more comprehensive protection tailored exclusively for cyber exposures. These policies are particularly valuable for organizations with significant digital operations or sensitive data, as they provide higher coverage limits and customizable features. Applications of standalone cyber insurance span across enterprise risk management, regulatory compliance, and third-party liability protection. It is widely used in industries such as finance, healthcare, retail, and technology, offering coverage for ransomware response, system failures, business interruption, and reputational damage. Additionally, these policies often come with access to expert incident response teams, legal counsel, and public relations support, ensuring a swift and coordinated approach to cyber crises. AXA XL, AIG, Travelers, Beazley, Zurich, Fairfax, Liberty Mutual, and CNA are among the key players that offer standalone cybersecurity insurance solutions.
Cybersecurity Insurance Market, By Provider Type
By provider type, the technology providers segment is projected to witness the fastest growth during the forecast period. Technology providers encompass organizations that develop and deliver technology-driven products and services, including software, hardware, platforms, and IT infrastructure. These entities face heightened exposure to cyber risks due to their reliance on digital systems, handling of sensitive data, and role in enabling digital operations across industries. Cybersecurity insurance serves as a vital risk management tool for these providers by offering coverage against data breaches, intellectual property theft, and service interruptions. It also protects against third-party liabilities arising from vulnerabilities in their solutions, ensures compliance with evolving data protection regulations, and supports incident response and legal proceedings. Additionally, insurance helps mitigate reputational damage through public relations support and customer remediation services. Major technology providers in the cybersecurity insurance market are BitSight, Mitratech, RedSeal, SecurityScorecard, Cisco, Microsoft, and Check Point.
Cybersecurity Insurance Market, By Insurance Coverage
By insurance coverage, the cyber liability segment is expected to have the largest market share during the forecast period Insurance coverage for cyber risk or cyber liability helps organizations cover the costs of recovering from cyberattacks, such as data breaches or viruses. This type of insurance covers both first-party and third-party claims. Cybersecurity insurance policies reimburse expenses such as investigation costs, business losses, lawsuits, extortion, privacy, and notification costs. First-party coverage includes the loss of electronic data, loss of income, extra expenses, cyber extortion, notification costs, and reputation damage costs. Third-party liability coverage includes network security and privacy liability, electronic media liability, and regulatory fines and penalties. These policies are customized to meet the specific needs of businesses and can range from USD 500 to USD 50,000 per year, depending on factors such as coverage limits, data access, security measures, industry size, and claims history.
REGION
North America is estimated to account for the largest market share during the forecast period
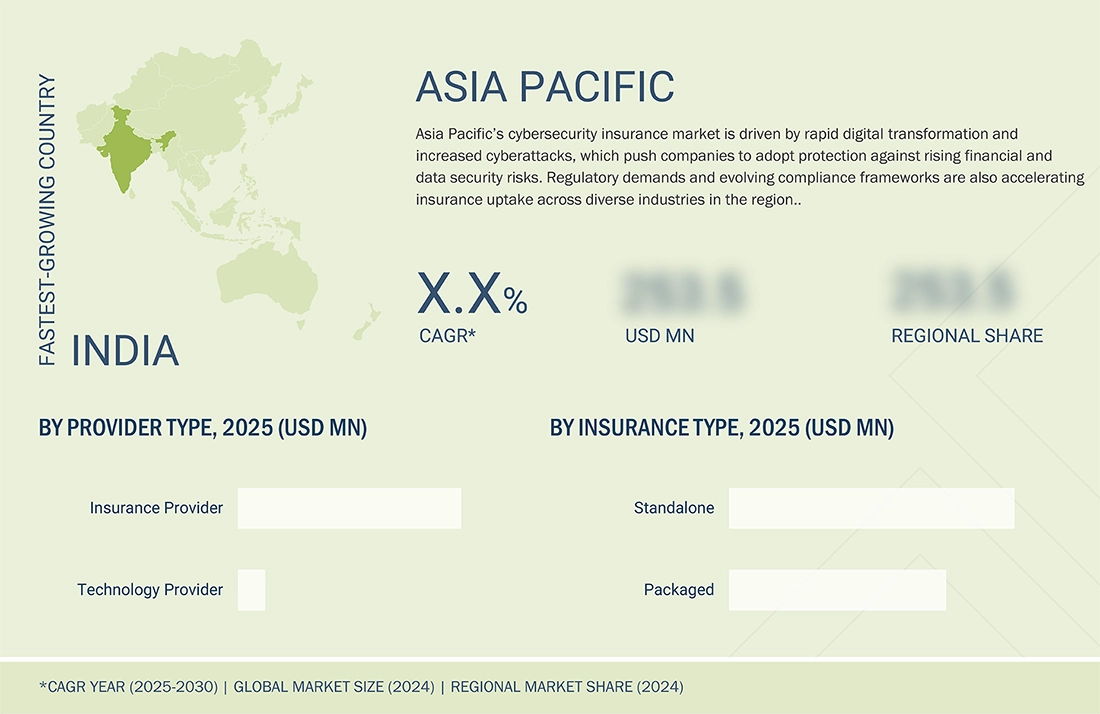
Asia Pacific is expected to witness the highest CAGR in the cybersecurity insurance market during the forecast period, driven by the escalating cyber threat landscape. Recognized for its dynamic and emerging economies, the region is experiencing substantial growth in the cybersecurity insurance sector, supported by progressive government regulations and advancements in technology. APAC is rapidly embracing technologies such as business intelligence (BI) tools, cloud computing, data analytics, and infrastructure modernization. The implementation of stricter regulatory frameworks, including heightened penalties for non-compliance, is anticipated to drive increased demand for cybersecurity insurance across Asia Pacific. Zurich Insurance forecasts robust market growth in the region, with key players such as AIG, Allianz, Chubb, and Zurich playing a leading role in shaping the market landscape
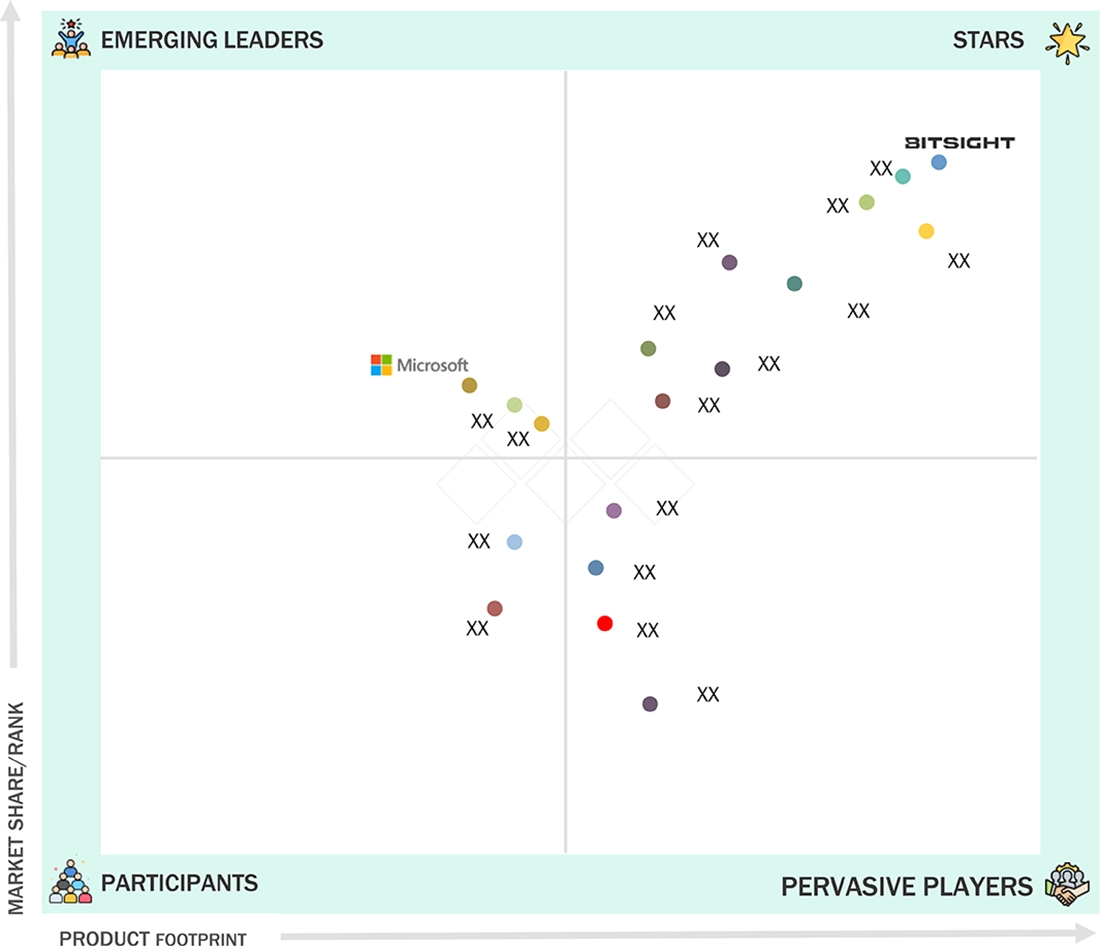
Cybersecurity Insurance Market: COMPANY EVALUATION MATRIX
In the cybersecurity insurance market matrix, BitSight (Star) leads with a strong market presence, by providing industry-leading cyber risk ratings and analytics that enable insurers to accurately assess, underwrite, and manage client cyber risk and exposure. Microsoft (Emerging Leader) in cybersecurity insurance, leveraging integrated AI-driven security solutions and cloud platforms to support cyber insurers with real-time threat intelligence, risk management, and policy innovation. While BitSight dominates with scale and ecosystem integration, Microsoft shows strong growth potential to advance toward the leaders’ quadrant with its expanding enterprise security portfolio.
Source: Secondary Research, Interviews with Experts, MarketsandMarkets Analysis
KEY MARKET PLAYERS
MARKET SCOPE
| REPORT METRIC | DETAILS |
|---|---|
| Market Size Value in 2024 | USD 15.63 Billion |
| Revenue Forecast in 2030 | USD 32.19 Billion |
| Growth Rate | CAGR of 14.2% from 2025-2030 |
| Actual data | 2020–2030 |
| Base year | 2024 |
| Forecast period | 2025–2030 |
| Units considered | Value (USD) Million/Billion |
| Report Coverage | Revenue forecast, company ranking, competitive landscape, growth factors, and trends |
| Segments Covered | By Offering, Insurance Coverage, Insurance Type, Provider Type, Vertical, and Region |
| Regional Scope | North America, Europe, Asia Pacific, Middle East & Africa, and Latin America |
WHAT IS IN IT FOR YOU: Cybersecurity Insurance Market REPORT CONTENT GUIDE
DELIVERED CUSTOMIZATIONS
We have successfully delivered the following deep-dive customizations:
| CLIENT REQUEST | CUSTOMIZATION DELIVERED | VALUE ADDS |
|---|---|---|
| Leading Service Provider (US) | Regional Analysis: • Further breakdown of the North American cybersecurity insurance market • Further breakdown of the European cybersecurity insurance market • Further breakdown of the Asia Pacific cybersecurity insurance market • Further breakdown of the Middle Eastern & African cybersecurity insurance market • Further breakdown of the Latin American cybersecurity insurance market | • Identifies high-growth regional opportunities, enabling tailored market entry strategies. • Optimizes resource allocation and investment based on region-specific demand and trends. |
| Company Information | Detailed analysis and profiling of additional market players (up to 5) | • Broadens competitive insights, helping clients make informed strategic and investment decisions. • Reveals market gaps and opportunities, supporting differentiation and targeted growth initiatives. |
RECENT DEVELOPMENTS
- June 2025 : Bitsight collaborated with Microsoft to provide clear, deep, and dark web threat intelligence for Microsoft Security Copilot’s newly launched Threat Intelligence Briefing Agent. The integration with BitSight’s embedded generative AI, designed to simplify complex cyber risk data, enhances the output of Microsoft’s Threat Intelligence Briefing Agent.
- May 2025 : Check Point launched its next-generation Quantum Smart-1 Management Appliances, delivering a 2X increase in managed gateways and up to 70% higher log rate, with AI-powered security tools designed to meet the demands of hybrid enterprises. Fully integrated within the Check Point Infinity Platform, these new appliances offer faster, more intelligent threat detection and response through a unique hybrid mesh architecture and integration with over 250 third-party solutions.
- April 2025 : SecurityScorecard announced a strategic partnership with Willis (a WTW business), a leading global advisory, broking, and solutions company. Building on a long-standing relationship, this collaboration aims to enhance cyber risk quantification, improve insurance modeling, and strengthen enterprise security strategies for organizations worldwide.
- February 2025 : AttackIQ acquired DeepSurface, a security posture management and vulnerability prioritization company. This acquisition enables AttackIQ to rapidly extend traditional breach and attack simulation (BAS) use case to now include AEV and help organizations programmatically pivot to Cyber Threat Exposure Management (CTEM).
- February 2025 : SentinelOne collaborated with CyberArk to protect against privileged access misuse. Integrating the two cyber leaders’ platforms brings together the robust endpoint detection and response capabilities of SentinelOne’s market-leading Singularity Endpoint solution and CyberArk Endpoint Privilege Manager.
Table of Contents
 Exclusive indicates content/data unique to MarketsandMarkets and not available with any competitors.
Methodology
This research study on the cybersecurity insurance market involved extensive secondary sources, directories, and several journals, databases, such as D&B Hoovers, Bloomberg Businessweek, and Factiva, to identify and collect information useful for this technical, market-oriented, and commercial study of the cybersecurity insurance market. Primary sources were industry experts from core and related industries, preferred system developers, service providers, resellers, partners, and organizations related to the various segments of the industry’s value chain. In-depth interviews were conducted with different primary respondents, including key industry participants and subject-matter experts, to obtain and verify critical qualitative and quantitative information, as well as to assess the market’s prospects. These included key industry participants, subject-matter experts, C-level executives of key companies, and industry consultants. Primary sources were mainly industry experts from the core and related industries, preferred cybersecurity insurance providers, third-party service providers, consulting service providers, end users, and other commercial enterprises. In-depth interviews were conducted with various primary respondents, including key industry participants and subject matter experts, to obtain and verify critical qualitative and quantitative information and assess growth prospects.
Secondary Research
The market size of companies offering cybersecurity insurance solutions and services was determined based on secondary data available through paid and unpaid sources. It was also arrived at by analyzing the product portfolios of major companies and rating the companies based on their performance and quality.
In the secondary research process, various sources were referred to for identifying and collecting information for this study. Secondary sources included annual reports, press releases, and investor presentations of companies; white papers, journals, and certified publications; and articles from recognized authors, directories, and databases. The data was also collected from other secondary sources, such as journals and related magazines. Cybersecurity insurance spending of various countries was extracted from the respective sources. Secondary research was mainly used to obtain the key information related to the industry’s value chain and supply chain to identify key players, market classification, and segmentation according to offerings of major players; industry trends related to offering, insurance coverage, insurance type, provider type, vertical, and regions; and key developments from both market and technology-oriented perspectives.
Primary Research
In the primary research process, various primary sources from both the supply and demand sides were interviewed to obtain qualitative and quantitative information for the report. The primary sources from the supply side included industry experts, such as Chief Executive Officers (CEOs), Vice Presidents (VPs), marketing directors, technology and innovation directors, and related key executives from various key companies and organizations providing cybersecurity insurance solutions and services. The primary sources from the demand side included end users, such as Chief Information Officers (CIOs), consultants, service professionals, technicians and technologists, and managers at public and investor-owned utilities.
In the market engineering process, top-down and bottom-up approaches were extensively used, along with several data triangulation methods, to perform market estimation and market forecasting for the overall market segments and subsegments listed in the report. Extensive qualitative and quantitative analyses were performed on the complete market engineering process to list key information/insights throughout the report.
After the complete market engineering (including calculations for market statistics, market breakup, market size estimations, market forecasting, and data triangulation), extensive primary research was conducted to gather information. Primary research was conducted to identify the segmentation, industry trends, key players, competitive landscape, and key market dynamics, such as drivers, restraints, opportunities, challenges, industry trends, and key strategies

Note 1: Tier 1 companies have revenues greater than USD 10 billion; tier 2 companies' revenues range
between USD 1 and 10 billion; and tier 3 companies' revenues range between USD 500 million and 1 billion
Note 2: Others include sales, marketing, and product managers.
Source: Secondary Literature, Interviews with Experts, and MarketsandMarkets Analysis
To know about the assumptions considered for the study, download the pdf brochure
Market Size Estimation
Multiple approaches were adopted to estimate and forecast the cybersecurity insurance market. The first approach involved estimating the market size by summing up the companies’ revenue generated through the sale of solutions and services.
The research methodology used to estimate the market size included the following:
- We used primary and secondary research to determine the revenue contributions of the major market participants in each country after secondary research helped identify them.
- Throughout the process, we obtained critical insights by conducting in-depth interviews with industry professionals, including directors, CEOs, VPs, and marketing executives, and by reading the annual and financial reports of the top firms in the market.
- We used primary sources to verify all percentage splits and breakups, which we calculated using secondary sources.
Cybersecurity Insurance Market : Top-Down and Bottom-Up Approach

Data Triangulation
Once the overall market size was determined, we divided the market into segments and subsegments using the previously described market size estimation procedures. When required, market breakdown and data triangulation procedures were employed to complete the market engineering process and specify the exact figures for every market segment and subsegment. The data was triangulated by examining several variables and patterns from the government entities' supply and demand sides.
Market Definition
Cybersecurity insurance, also referred to as cyber risk insurance, is a specialized line of coverage designed to protect organizations from the financial impact of cyber incidents. These incidents may include data breaches, ransomware attacks, network intrusions, business interruption, and regulatory penalties.
The cybersecurity insurance market size is measured in terms of Gross Written Premiums (GWP), which represent the sum of premiums collected by insurers before deductions for reinsurance and administrative expenses. This includes both primary insurance premiums and premiums ceded to reinsurers, making reinsurance an integral part of the market's overall value.
There are two aspects of cybersecurity insurance:
- Technology provider: They assist insurance companies in building cybersecurity insurance products. They offer cyber risk and resiliency assessments of enterprises/businesses that aim to procure cybersecurity insurance coverage for their data and assets.
- Insurance provider: They underwrite the actual cybersecurity insurance policy for enterprises/businesses based on the security risk assessment of the technology provider.
Stakeholders
- Government agencies
- Insurance associations and agencies
- Cybersecurity insurance vendors
- Insurance providers
- Underwriters and reinsurers
- Independent software vendors
- Security agencies
- Cybersecurity vendors
- Value-added Resellers (VARs)
- Information Technology (IT) security agencies
- Managed Security Service Providers (MSSPs)
Report Objectives
- To define, describe, and forecast the cybersecurity insurance market in terms of value
- To provide detailed information regarding drivers, restraints, opportunities, and challenges influencing the growth of the market
- To forecast the market by offering (solutions, services), insurance coverage, insurance type, provider type, vertical, and region
- To forecast the market size of segments for five main regions: North America, Europe, Asia Pacific, the Middle East & Africa, and Latin America
- To analyze opportunities in the market and provide details of the competitive landscape for stakeholders and market leaders
- To profile the key market players, including top vendors and startups; provide a comparative analysis based on business overviews, regional presence, product offerings, business strategies, and key financials; and provide a detailed competitive landscape of the market
- To analyze competitive developments, such as mergers & acquisitions (M&A), product launches/enhancements, agreements, partnerships, collaborations, expansions, and R&D activities, in the market.
Available Customizations
MarketsandMarkets provides customizations based on the company's unique requirements using market data. The following customization options are available for the report:
Product Analysis
- The product matrix provides a detailed comparison of each company's portfolio.
Geographic Analysis as per Feasibility
- Further breakup of the cybersecurity insurance market
Company Information
- Detailed analysis and profiling of five additional market players
Key Questions Addressed by the Report
What is the definition of the cybersecurity insurance market?
Cybersecurity insurance, also referred to as cyber risk insurance, is a specialized line of coverage designed to protect organizations from the financial impact of cyber incidents. These incidents may include data breaches, ransomware attacks, network intrusions, business interruption, and regulatory penalties.
The cybersecurity insurance market size is measured in terms of Gross Written Premiums (GWP), which represent the sum of premiums collected by insurers before deductions for reinsurance and administrative expenses. This includes both primary insurance premiums and premiums ceded to reinsurers, making reinsurance an integral part of the market's overall value.
There are two aspects of cybersecurity insurance:
- Technology provider: They assist insurance companies in building cybersecurity insurance products. They offer cyber risk and resiliency assessments of enterprises/businesses that aim to procure cybersecurity insurance coverage for their data and assets.
- Insurance provider: They underwrite the actual cybersecurity insurance policy for enterprises/businesses based on the security risk assessment of the technology provider.
What is the market size of the cybersecurity insurance market?
The cybersecurity insurance market is estimated to grow from USD 16.54 billion in 2025 to USD 32.19 billion by 2030, at a compounded annual growth rate (CAGR) of 14.2% from 2025 to 2030.
What are the major drivers in the cybersecurity insurance market?
The major drivers in the cybersecurity insurance market are the surge in mandatory cybersecurity regulations and legislations to boost demand for insurance protection, the high rate of recovery of financial losses to promote the growth of the cybersecurity insurance market, and the increase in the frequency and sophistication of cyber threats.
Who are the key players operating in the cybersecurity insurance market?
The key market players profiled in the cybersecurity insurance market include BitSight (US), Mitratech (US), RedSeal (US), SecurityScorecard (US), and UpGuard (US), Cisco (US), Microsoft (US), Check Point (US), AttackIQ (US), SentinelOne (US), Broadcom (US), Accenture (Ireland), Cylance (US), Trellix (US), CyberArk (US), CYE (Israel), SecurIT360 (US), Founder Shield (US), Allianz (Germany), AIG (US), Aon (UK), Arthur J. Gallagher (US), Travelers (US), AXA XL (US), AXIS Capital (Bermuda), Beazley (UK), Chubb (Switzerland), CNA Financial (US), Fairfax (Canada), Liberty Mutual (US), Lloyds of London (UK), Lockton (US), Munich Re (Germany), Sompo International (Bermuda), At-Bay (US), Cybernance (US), Resilience (US), Coalition (US), Kovrr (Israel), Sayata Labs (Israel), Zeguro (US), Ivanti (US), SafeBreach (US), and Orchestra Group (US).
What are the key technological trends prevailing in the cybersecurity insurance market?
The cybersecurity insurance market is seeing key trends such as AI and machine learning, automated incident response, integration of cybersecurity tools, blockchain, parametric insurance models, advanced cyber risk modeling platforms, cloud-native and API-based solutions, IoT and OT risk coverage, cyber risk scoring, and benchmarking.
Need a Tailored Report?
Customize this report to your needs
Get 10% FREE Customization
Customize This ReportPersonalize This Research
- Triangulate with your Own Data
- Get Data as per your Format and Definition
- Gain a Deeper Dive on a Specific Application, Geography, Customer or Competitor
- Any level of Personalization
Let Us Help You
- What are the Known and Unknown Adjacencies Impacting the Cybersecurity Insurance Market
- What will your New Revenue Sources be?
- Who will be your Top Customer; what will make them switch?
- Defend your Market Share or Win Competitors
- Get a Scorecard for Target Partners

Custom Market Research Services
We Will Customise The Research For You, In Case The Report Listed Above Does Not Meet With Your Requirements
Get 10% Free Customisation


Growth opportunities and latent adjacency in Cybersecurity Insurance Market