Food Amino Acids Market by Application (Nutraceutical & Dietary Supplements, Infant Formula, Food Fortification, Convenience Foods), Type (Glutamic Acid, Lysine, Tryptophan, Methionine), Source (Plant, Animal, Synthetic), and Region - Global Forecast to 2022


[141 Pages Report] The food amino acids market was estimated at USD 4.4 billion in 2016 and is projected to grow at a CAGR of 7.8% from 2018, to reach a value of USD 6.8 billion by 2022. The basic objective of the report is to define, segment, and project the global market size of the market on the basis of type, source, application, and region. It will also help to understand the structure of the market by identifying its various segments. The other objectives include analyzing the opportunities in the market for the stakeholders; providing the competitive landscape of the market trends; and projecting the size of the market and its submarkets, in terms of value (USD Million) and volume (KT).
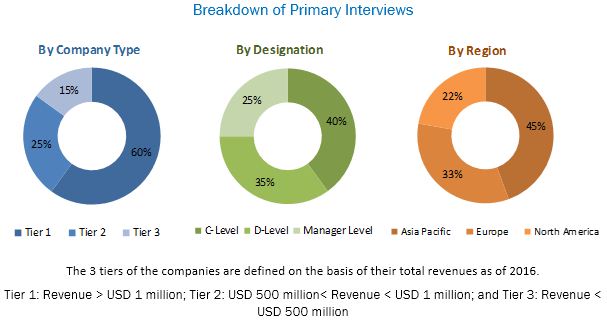
This research study involved the extensive use of secondary sources; which included directories and databases, such as Hoovers, Forbes, Bloomberg Businessweek, and Factiva, to identify and collect information useful for a technical, market-oriented, and commercial study of the market. The primary sources that have been involved include the industry experts from the core and related industries and preferred suppliers, dealers, manufacturers, alliances, and standards & certification organizations from companies; and organizations related to all the segments of this industry’s value chain. In-depth interviews have been conducted with various primary respondents such as key industry participants, subject matter experts, C-level executives of key market players, and industry consultants to obtain and verify critical qualitative and quantitative information as well as to assess future prospects. The following figure depicts the market research methodology applied in drafting this report on the market.
To know about the assumptions considered for the study, download the pdf brochure
The key participants in the market are the food amino acids manufacturers, suppliers, and regulatory bodies. The key players that are profiled in the report include Ajinomoto Co., Inc. (Japan), Kyowa Hakko Kirin Co., Ltd. (Japan), Sigma-Aldrich, Co. LLC. (U.S.), Prinova Group LLC. (U.S.), and Daesang Corporation (Korea).
This report is targeted at the existing players in the industry, which include the following:
- Food amino acid manufacturers
- Regulatory bodies
- Intermediary suppliers
- End users
“The study answers several questions for the stakeholders; primarily, which market segments to focus on in the next 2 to 5 years for prioritizing efforts and investments.”
Scope Of The Report
On the basis of type, the market for food amino acids has been segmented as follows:
- Glutamic acid
- Lysine
- Tryptophan
- Methionine
- Phenylalanine
- Others
On the basis of livestock, the market for food amino acids has been segmented as follows:
- Plant-based amino acids
- Animal-based amino acids
- Synthetic amino acids
On the basis of application, the market for food amino acids has been segmented as follows:
- Nutraceuticals & dietary supplements
- Infant formula
- Food fortification
- Convenience food
- Others
On the basis of region, the market for food amino acids has been segmented as follows:
- North America
- Europe
- Asia Pacific
- Rest of the World (the Middle East and Africa)
Available Customizations
With the given market data, MarketsandMarkets offers customizations according to company-specific needs.
The following customization options are available for the report:
Product Analysis
- Product matrix, which gives a detailed comparison of the product portfolio of each company
Company Information
- Detailed analysis and profiling of additional market players (up to 5)
The food amino acids market is estimated to account for USD 4.35 billion in 2016 and is projected to reach USD 6.83 billion by 2022, growing at a CAGR of 7.8% during the forecast period. In terms of volume, the global market is estimated at 2.20 KT in 2016 and is projected to reach 3.08 KT by 2022. The increase in demand for food amino acids has been observed in recent years, due to the increase in the demand for processed and convenience foods. Also, growing inclination of consumers toward food and dietary products with additional health benefits is fuelling the demand for food amino acids.
Based on type, the market is segmented into glutamic acid, lysine, methionine, phenylalanine, tryptophan, and others. The glutamic acid segment dominated the market in 2016. This is due to the massive increase in demand for food amino acid as a flavor enhancer in various food and beverages such as snacks, sauces, and ready-to-eat soups. Additionally, growth in consumption of nutraceutical and dietary supplements, along with an increase in awareness among consumers toward products with nutritive ingredients is expected to escalate the demand for food amino acids in the future.
On the basis of application, the market has been segmented into nutraceuticals & dietary supplements, infant formula, food fortification, convenience foods, and others. The nutraceuticals and dietary supplements segment is estimated to dominate the global food amino acids market in 2016. Increased demand for amino acids as nutritive and functional additives has been fuelling the demand for global food amino acids globally. The infant formula segment is projected to have the highest growth rate during the forecast period followed by the convenience foods segment.
On the basis of source, the global market is segmented into plant-based food, animal-based food, and synthetic. The nutraceuticals and dietary supplements is estimated to dominate the global market in 2016. The growing trend of maintaining an active lifestyle has led to the addition of healthy and nutritive supplements in regular diets of consumers; this is expected to fuel the demand for amino acids in the nutraceutical & dietary industry in Asia Pacific. The infant formula segment is projected to have the highest growth rate during the forecast period followed by the convenience foods segment.
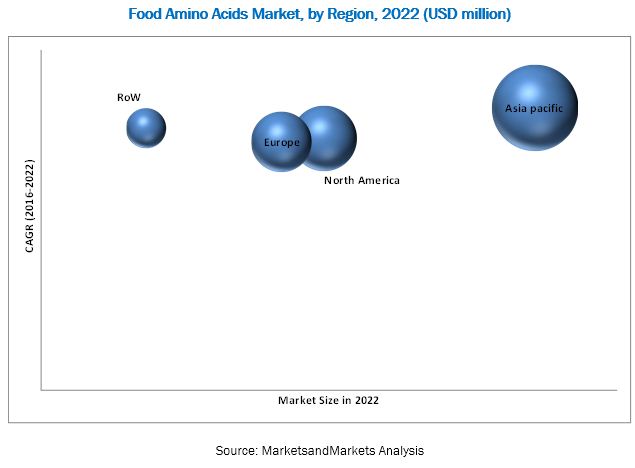
Asia Pacific is projected to be the fastest-growing market during the forecast period. The rise in income, purchasing power, and consumer demand for nutritional & healthy products provide promising prospects for the growth and diversification in the region’s food sector. Increase in purchasing power of consumers due to the economic development in China has led to the growth in demand for high-quality processed foods; thus stimulating the demand for food amino acids.
The negative perception of consumers toward the amino acids such as monosodium glutamate that they could cause adverse reactions such as allergic reactions, weakness, headaches, and palpitations might hamper the growth of the global food amino acids market.
Key players such as Ajinomoto Co. Inc. (Japan), Kyowa Hakko Kirin Co., Ltd. (Japan), Sigma-Aldrich, Co. LLC. (US), Prinova Group LLC. (US), and Daesang Corporation (Korea) are the key players in the global market. These companies have been strengthening their market position through new product launches, expansions and investments, and agreements.
To speak to our analyst for a discussion on the above findings, click Speak to Analyst
 Exclusive indicates content/data unique to MarketsandMarkets and not available with any competitors.
Table of Contents
1 Introduction (Page No. - 15)
1.1 Objectives of the Study
1.2 Market Definition
1.3 Market Scope
1.4 Years Considered for the Study
1.5 Currency
1.6 Unit
1.7 Stakeholders
2 Research Methodology (Page No. - 18)
2.1 Research Data
2.1.1 Secondary Data
2.1.1.1 Key Data From Secondary Sources
2.1.2 Primary Data
2.1.2.1 Key Data From Primary Sources
2.1.2.2 Key Industry Insights
2.1.2.3 Breakdown of Primaries
2.2 Market Size Estimation
2.3 Market Breakdown & Data Triangulation
2.4 Assumptions & Limitations
2.4.1 Assumptions
2.4.2 Limitations
3 Executive Summary (Page No. - 27)
4 Premium Insights (Page No. - 30)
4.1 Attractive Opportunities in this Market
4.2 Market for Food Amino Acids, By Key Country
4.3 Asia-Pacific: the Largest Market for Food Amino Acids
4.4 Market for Food Amino Acids, By Application
5 Market Overview (Page No. - 34)
5.1 Introduction
5.2 Market Dynamics
5.2.1 Drivers
5.2.1.1 Rising Demand for Glutamic Acid as Flavor Enhancer
5.2.1.2 Increasing Health Concerns of Consumers
5.2.1.3 Increase in Demand for Amino Acid-Based Nutrition Products
5.2.2 Restraints
5.2.2.1 High Cost Involved in R&D Activities & Production Resulting in High Prices
5.2.2.2 Stringent Regulations
5.2.3 Opportunities
5.2.3.1 Growing Demand in Emerging Economies
5.2.4 Challenges
5.2.4.1 Increasing Usage of Multi-Page Labeling
5.2.4.2 Negative Perception of Consumers
5.3 Value Chain Analysis
6 Market for Food Amino Acids, By Type (Page No. - 39)
6.1 Introduction
6.2 Glutamic Acid
6.3 Lysine
6.4 Tryptophan
6.5 Methionine
6.6 Phenylalanine
6.7 Other Types
7 Market for Food Amino Acids, By Source (Page No. - 47)
7.1 Introduction
7.2 Plant-Based Amino Acids
7.3 Animal-Based Amino Acids
7.4 Synthetic Amino Acids
8 Market for Food Amino Acids, By Application (Page No. - 53)
8.1 Introduction
8.2 Nutraceuticals & Dietary Supplements
8.3 Infant Formula
8.4 Food Fortification
8.5 Convenience Food
8.6 Others
9 Market for Food Amino Acids, By Region (Page No. - 63)
9.1 Introduction
9.2 North America
9.2.1 U.S.
9.2.2 Canada
9.2.3 Mexico
9.3 Europe
9.3.1 Germany
9.3.2 U.K.
9.3.3 Italy
9.3.4 France
9.3.5 Rest of Europe
9.4 Asia-Pacific
9.4.1 China
9.4.2 Japan
9.4.3 India
9.4.4 Australia & New Zealand
9.4.5 Rest of Asia-Pacific
9.5 RoW
9.5.1 Brazil
9.5.2 South Africa
9.5.3 Others in RoW
10 Market for Food Amino Acids, By Brand (Page No. - 89)
10.1 Introduction
10.2 Rexiva By Evonik Industries AG
10.3 Sunthenine By Taiyo International Inc.
10.4 Branched Chain Amino Acids (BCAA) By Prinova Group
10.5 L-Arginine By Kyowa Hakko Kirin Group
10.6 L-Citrulline By Kyowa Hakko Kirin Group
10.7 L-Aspartic Acid By Ajinomoto Co., Inc.
10.8 L-Glutamic Acid By Ajinomoto Co., Inc.
10.9 Miwon (MSG) By Daesang Corporation
10.10 L-Arginine By Daesang Corporation
10.11 Epsilon-Poly-L-Lysine By Shaoxing Yamei Biotechnology Co., Ltd.
11 Competitive Landscape (Page No. - 91)
11.1 Overview
11.2 Market for Food Amino Acids: Dive Vendor Comparison
11.2.1 Market for Food Amino Acids: Product Offering
11.2.2 Market for Food Amino Acids: Business Strategy
12 Company Profiles (Page No. - 97)
(Company at A Glance, Recent Financials, Products & Services, Strategies & Insights, & Recent Developments)*
12.1 Ajinomoto Co., Inc.
12.2 Kyowa Hakko Kirin Group
12.3 Evonik Industries
12.4 Sigma-Aldrich
12.5 Prinova Group LLC
12.6 Daesang Corporation
12.7 Shaoxing Yamei Biotechnology Co., Ltd
12.8 Qingdao Samin Chemical Co., Ltd.
12.9 Hugestone Enterprise Co., Ltd.
12.10 Brenntag AG
12.11 Pangaea Sciences Inc.
12.12 Amino GmbH
12.13 Kingchem LLC
12.14 Rochem International Inc.
12.15 Sunrise Nutrachem Group
12.16 Taiyo International
12.17 Monteloeder S.L.
12.18 CJ Corporation
12.19 Kraemer Martin GmbH (Azelis)
12.20 Pacific Rainbow International, Inc.
*Details on Company at A Glance, Recent Financials, Products & Services, Strategies & Insights, & Recent Developments Might Not Be Captured in Case of Unlisted Companies.
13 Appendix (Page No. - 133)
13.1 Discussion Guide
13.2 Knowledge Store: Marketsandmarkets’ Subscription Portal
13.3 Introducing RT: Real-Time Market Intelligence
13.4 Available Customizations
13.5 Related Reports
13.6 Author Details
List of Tables (61 Tables)
Table 1 Food Amino Acid Market Size, By Type, 2014–2022 (USD Million)
Table 2 Glutamic Acid Market Size, By Region, 2014–2022 (USD Million)
Table 3 Lysine Market Size, By Region, 2014–2022 (USD Million)
Table 4 Tryptophan Market Size, By Region, 2014–2022 (USD Million)
Table 5 Methionine Market Size, By Region, 2014–2022 (USD Million)
Table 6 Phenylalanine Market Size, By Region, 2014–2022 (USD Million)
Table 7 Other Types Market Size, By Region, 2014–2022 (USD Million)
Table 8 Food Amino Acids Market Size, By Source, 2014–2022 (USD Million)
Table 9 Plant-Based Market Size for Food Amino Acids, By Region, 2014–2022 (USD Million)
Table 10 Animal-Based Amino Acids Market Size, By Region, 2014–2022 (USD Million)
Table 11 Synthetic Amino Acids Market Size, By Region, 2014–2022 (USD Million)
Table 12 Market Size for Food Amino Acids, By Application, 2014–2022 (USD Million)
Table 13 Market Size, By Application, 2014–2022 (KT)
Table 14 By Market Size in Nutraceutical & Dietary Supplements, By Region, 2014–2022 (USD Million)
Table 15 By Market Size in Nutraceutical & Dietary Supplements, By Region, 2014–2022 (KT)
Table 16 By Market Size in Infant Formula, By Region, 2014–2022 (USD Million)
Table 17 Market Size in Infant Formula, By Region, 2014–2022 (KT)
Table 18 Market Size for Food Amino Acids in Food Fortification, By Region, 2014–2022 (USD Million)
Table 19 Market Size in Food Fortification,, By Region, 2014–2022 (KT)
Table 20 By Market Size in Convenience Food, By Region, 2014–2022 (USD Million)
Table 21 Market Size in Convenience Food, By Region, 2014–2022 (KT)
Table 22 By Market Size in Other Applications, By Region, 2014–2022 (USD Million)
Table 23 Market Size in Other Applications, By Region, 2014–2022 (KT)
Table 24 Market Size for Food Amino Acids, By Region, 2014–2022 (USD Million)
Table 25 Market Size, By Region, 2014–2022 (KT)
Table 26 North America: By Market Size, By Country, 2014–2022 (USD Million)
Table 27 North America: Market Size, By Type, 2014–2022 (USD Million)
Table 28 North America: Market Size, By Source, 2014–2022 (USD Million)
Table 29 North America: Market Size for Food Amino Acids, By Application, 2014–2022 (USD Million)
Table 30 North America: Market Size, By Application, 2014–2022 (KT)
Table 31 U.S.: By Market Size, By Application, 2014–2022 (USD Million)
Table 32 Canada: By Market Size, By Application, 2014–2022 (USD Million)
Table 33 Mexico: By Market Size, By Application, 2014–2022 (USD Million)
Table 34 Europe: By Market Size, By Type, 2014–2022 (USD Million)
Table 35 Europe: Market Size, By Source, 2014–2022 (USD Million)
Table 36 Europe: Market Size for Food Amino Acids, By Application, 2014–2022 (USD Million)
Table 37 Europe: Market Size, By Application, 2014–2022 (KT)
Table 38 Germany: By Market Size, By Application, 2014–2022 (USD Million)
Table 39 U.K.: By Market Size, By Application, 2014–2022 (USD Million)
Table 40 Italy: Market Size for Food Amino Acids, By Application, 2014–2022 (USD Million)
Table 41 France: By Market Size, By Application, 2014–2022 (USD Million)
Table 42 Rest of Europe: By Market Size, By Application, 2014–2022 (USD Million)
Table 43 Asia-Pacific: Market Size for Food Amino Acids, By Country, 2014–2022 (USD Million)
Table 44 Asia-Pacific: Market, By Type, 2014–2022 (USD Million)
Table 45 Asia-Pacific: Market, By Source, 2014–2022 (USD Million)
Table 46 Asia-Pacific: Market Size for Food Amino Acids, By Application, 2014–2022 (USD Million)
Table 47 Asia-Pacific: Market, By Application, 2014–2022 (KT)
Table 48 China: By Market Size, By Application, 2014–2022 (USD Million)
Table 49 Japan: By Market Size, By Application, 2014–2022 (USD Million)
Table 50 India: By Market Size, By Application, 2014–2022 (USD Million)
Table 51 Australia & New Zealand : By Market Size, By Application, 2014–2022 (USD Million)
Table 52 Rest of Asia-Pacific: By Market Size, By Application, 2014–2022 (USD Million)
Table 53 RoW: Market Size for Food Amino Acids, By Country, 2014–2022 (USD Million)
Table 54 RoW: Market, By Type, 2014–2022 (USD Million)
Table 55 RoW: Market, By Source, 2014–2022 (USD Million)
Table 56 RoW: Market Size for Food Amino Acids, By Application, 2014–2022 (USD Million)
Table 57 RoW: Market, By Application, 2014–2022 (KT)
Table 58 Brazil: By Market, By Application, 2014–2022 (USD Million)
Table 59 South Africa: By Market, By Application, 2014–2022 (USD Million)
Table 60 Others in RoW: By Market, By Application, 2014–2022 (USD Million)
Table 61 Food Amino Acids Market: Product Offering
List of Figures (35 Figures)
Figure 1 Food Amino Acids Market: Research Design
Figure 2 Breakdown of Primary Interviews: By Company Type, Designation, and Region
Figure 3 Market Size Estimation: Bottom-Up Approach
Figure 4 Market Size Estimation Methodology: Top-Down Approach
Figure 5 Market Breakdown & Data Triangulation
Figure 6 Market for Food Amino Acids Snapshot, By Region, 2016 vs 2022 (USD Million)
Figure 7 Market Snapshot, By Type, 2016 vs 2022 (USD Million)
Figure 8 Asia-Pacific is Projected to Register the Highest Growth Rate From 2016 to 2022
Figure 9 Amino Acids: an Emerging Market With Promising Growth Potential
Figure 10 India is Projected to Grow at the Highest Rate in the Market From 2016 to 2022
Figure 11 Asia-Pacific Food Amino Acids Market, By Country & Source, 2015
Figure 12 Nutraceuticals & Dietary Supplements Segment is Projected to Be the Largest Segment By 2022
Figure 13 Life Cycle Analysis: Market for Food Amino Acids
Figure 14 Market Dynamics: Market for Food Amino Acids
Figure 15 Value Chain Analysis: Market for Food Amino Acids
Figure 16 Market for Food Amino Acids Growth Rate, By Type
Figure 17 Glutamic Acid Market Snapshot, By Region, 2016 vs 2022 (USD Million)
Figure 18 Market for Food Amino Acids, By Source
Figure 19 Plant-Based Market for Food Amino Acids, By Region, 2016 vs 2022 (USD Million)
Figure 20 Market for Food Amino Acids, By Application
Figure 21 Nutraceutical & Dietary Supplements Market for Food Amino Acids, By Region, 2016 vs 2022 (USD Million)
Figure 22 Market Size for Food Amino Acids in Convenience Food, By Region, 2016 vs 2022 (USD Million)
Figure 23 North American Food Amino Acids Market: A Snapshot
Figure 24 Europe: Market for Food Amino Acids Snapshot
Figure 25 Asia-Pacific Market for Food Amino Acids Snapshot
Figure 26 Expansions: Key Strategies, 2011-2017
Figure 27 Market for Food Amino Acids: Dive Vendor Comparison
Figure 28 Food Amino Acids: Business Strategy
Figure 29 Dive Vendor Comparison: Criteria Weightage
Figure 30 Ajinomoto Co., Inc.: Company Snapshot
Figure 31 Kyowa Hakko Kirin Group: Company Snapshot
Figure 32 Evonik Industries: Company Snapshot
Figure 33 Sigma-Aldrich: Company Snapshot
Figure 34 Brenntag Ag.: Company Snapshot
Figure 35 CJ Corporation: Company Snapshot


Growth opportunities and latent adjacency in Food Amino Acids Market