Release Agents Market by Ingredient (Emulsifiers, Vegetable Oils, Wax & Wax Esters, and Antioxidants), Application (Bakery, Confectionery, Processed Meat, and Convenience Food), Form (Liquid and Solid), Function, and Region - Global Forecast to 2023


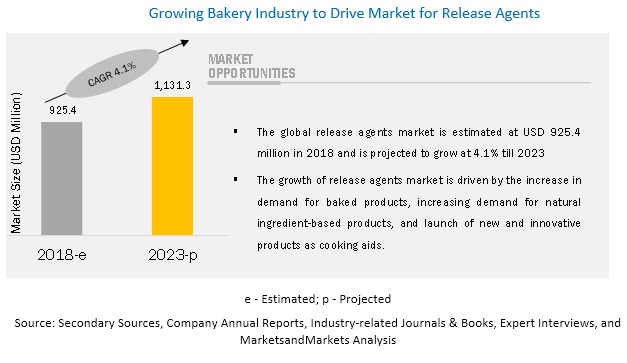
[159 pages report] The release agents market stood at USD 888.9 million in 2017; it is projected to grow at a CAGR of 4.1% from 2018, to reach USD 1,131.3 million by 2023. The global demand for release agents market is on the rise, particularly in the bakery & confectionery industries. The demand is governed by the performance quality and functionality of the products. Increasing demand for release agents in the bakery & confectionery industries is one of the factors supporting the market development significantly.
See how this study impacted revenues for other players in Release Agents Market
Client’s Problem Statement
Our client, a food ingredients manufacturer from Asia, wanted to expand its product portfolio and enter a new market. The client wanted to identify the regional and global trends in the market and understand the emerging sub-applications for release agents in the overall food industry. 
MnM Approach
MNM provided the overall market analysis for release agents, along with an in-depth analysis of various application areas and the major types of release agents preferred by end-use industries. Consumer trends, industry trends, and the regulatory scenario of the industry were also identified for a better understanding of the market’s inclination.
Competitive analysis and market information related to recent developments, and the key strategic moves of companies and their product portfolios were also presented to provide a broader view of the competitive scenario in the industry.
Revenue Impact (RI)
MNM’s findings allowed the client to come up with a comprehensive product portfolio to serve various end-use industries. The study also helped the client understand the different types of release agents in the key end-use industries at the regional level and target new revenue pockets, projected at ~USD 10–20 million in five years.
The bakery segment dominated the release agents market.
On the basis of application, the bakery segment dominated the market, this segment accounted for the largest share in 2017, due to the increase in demand for baked goods. Baked products are classified into three broad segments: bread, biscuits, and cakes; they witness high demand, mainly due to their low price, ease of production, and increasing popularity (due to their taste, nutritional value, varieties, and ease of availability), making them a vital part of several meals.
Carbon dioxide segment has the highest share in the food grade gases market.
The use of liquid release agents for bakery and confectionery applications, along with processed meat and convenience food, is constantly growing. Many specific liquid release agents have been introduced, which are available in spray cans to enable ease of application.
Rising demand for non-hydrogenated vegetable oils
On the basis of ingredients, the market is segmented into emulsifiers, vegetable oils, wax & wax esters, and antioxidants. Different ingredients and a specific manufacturing process are chosen, depending on the properties of the ingredients and the desired end application. Recently, the demand for non-hydrogenated vegetable oils has been on the rise, as it helps increase the shelf-life of the final product.
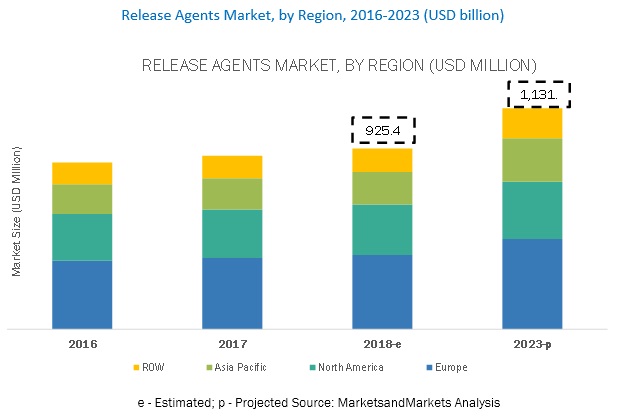
North America and Europe are dominant regions in the release agents market in 2017.
Europe and North America are the dominant regions in this market in 2017, owing to the high demand for baked goods, the presence of major players in these regions, and awareness about the benefits of using release agents. However, Asia Pacific is projected to be the fastest-growing market during the forecast period, due to greater awareness and increase in production of processed food in the region. Asian countries, especially China, have also emerged as leading destinations, thereby facilitating the market shift from developed economies to developing economies. In relatively saturated markets such as the US and Europe, value-based pricing and raw material sourcing have emerged as major strategies for companies looking to establish a strong foothold in these markets.
Market Dynamics
Growth in demand for natural sources of ingredients is driving market growth.
Ingredient labeling has become mandatory in developed economies due to increase in consumer awareness. This has brought about a change in the use of ingredients for production by the manufacturers, with several manufacturers preferring natural and organic food additives over synthetic alternatives. The demand for natural ingredients is on the rise, with manufacturers launching various products with these ingredients that can provide an added advantage to drive the consumption among health-conscious consumers. As some of the release agents, such as lecithin and vegetable oils, are of a natural origin, they are poised to observe the growing adoption by the industry that drives its market growth. Vegetable oils are used for various industrial applications such as shortening, lubrication, oiling, releasing, and as surfactants. In the baking industry, vegetable oils are used as natural sources of release agents; however, they did not provide the required texture for most applications. Hence, a chemical process called hydrogenation to convert unsaturated liquid oils into a semi-solid trans-fat was developed. Recently, several new fats & oils have emerged as alternatives to semi-solid, partially hydrogenated vegetable oils. Palm oil offers a long shelf-life without the need for chemical processes due to the presence of natural antioxidants and a low level of unstable polyunsaturated fat.
Strict international regulations governing the use of release agents in food is restraining growth of the market.
International bodies such as the National Food Safety and Quality Service (SENASA), Canadian Food Inspection Agency (CFIA), US Food and Drug Administration (FDA), and Committee on the Environment, Public Health and Food Safety (EU) are associated with food safety regulations. These organizations have control over the usage of different chemicals and materials used in food processing, directly or indirectly. As release agents that are used for bakery applications come in indirect contact with the food product surface, they have to adhere to food safety regulations. The USFDA has published the list of substances and their quantity allowed to be used in food processing.
Emerging markets are illustrating high potential for food release agents.
The demand for food release agents is high in developed markets such as the US and Europe. Developing countries, namely, China and India, in the coming years, will experience a strong upsurge in demand for release agents. This demand is driven by an increase in the production of processed and convenience foods. The market for release agents in developed economies such as the US and Europe is saturated, as their penetration and adoption are quite high. Emerging economies such as India and China, in the Asia Pacific region, are exhibiting high growth. The Asia Pacific region also provides the cost advantage in terms of production and processing. High demand, coupled with low cost of production, is a key feature, which will aid release agents suppliers and manufacturers target this market. The trend of consumer’s preference for low-fat products is rapidly rising, and marketing campaigns are planned around highlighting their use and health benefit claims. ADM produces lecithin, which functions as a low-fat dressing, attracting market attention specifically from those who aspire to produce low-fat food products. The demand for low-fat products may be driven by the increase in processed foods production and innovation in almost all segments, such as meat products, dairy, and bakery & confectionery products. However, the demand for the usage of release agents is expected to grow continually in early adopting countries such as Japan and exponential growth is projected in new and emerging markets such as Australia and other Asia Pacific countries
Rise in price of raw materials such as vegetable oils poses a major challenge for manufacturers.
Manufacturers of release agents for food applications have to rely on the supply of raw materials such as vegetable oils, emulsifiers, waxes, and antioxidants, of which vegetable oils have always demonstrated upward growth trends in terms of prices. Vegetable oils are the base used for the production of release agents; hence the prices of the release agent products depend on the market price of vegetable oils. The ever-increasing prices of vegetable oils pose a challenge to the release agent manufacturers and by extension, the market. The prices of raw materials for release agent production have been fluctuating, resulting in uncertainty in the market as the price of raw materials affects the price of the release agents, which in turn impacts the price of the end products. Changes in climatic conditions have resulted in the shortage of raw materials, which in turn has increased their prices. Another factor affecting the prices of raw materials is the fluctuating prices of crude oils in the global market
Scope of the Report
|
Report Metric |
Details |
|
Market size available for years |
2015–2022 |
|
Base year considered |
2016 |
|
Forecast period |
2017–2022 |
|
Forecast units |
Value (USD Million), Volume (KT) |
|
Segments covered |
Form, Ingredient, Application, and Region |
|
Geographies covered |
North America, Europe, Asia Pacific, and ROW |
|
Companies covered |
Archer Daniels Midland Company (US), AAK AB (Sweden), Cargill (US), Dowdupont (US), Avatar Corporation (US), Par-Way Tryson Company (US), Associated British Foods PLC (UK), Mallet & Company, Inc. (US), Lecico GmbH (Germany), Lallemand (Canada) |
On the basis of form, the market for release agents has been segmented as follows:
- Solid
- Liquid
On the basis of ingredient, the market for release agents has been segmented as follows:
- Vegetable oils
- Emulsifiers
- Wax & wax esters
- Antioxidants
On the basis of application, the market for release agents has been segmented as follows:
- Bakery products
- Confectionery products
- Processed meat
On the basis of region, the market for release agents has been segmented as follows:
- North America
- Europe
- Asia-Pacific
- ROW
Break-up of Primaries:
- By Company Type: Tier 1 - 35 %, Tier 2 - 45%, and Tier 3 - 20%
- By Designation: C-level - 35%, D-level - 25%, and Others* - 40%
- By Region: North America - 20%, Europe - 25%, Asia Pacific - 40%, ROW**- 15%
*Others include sales managers, marketing managers, and product managers.
**ROW includes South America and the Middle East & Africa
Report Objectives:
- Determining and projecting the size of the market, with respect to form, ingredient, application, and region, over a five-year period ranging from 2017 to 2022
- Identifying the attractive opportunities in the market by determining the largest and fastest-growing segments across the key regions
- Analyzing the demand-side factors on the basis of the following:
- Impact of macro- and micro-economic factors on the market
- Shifts in demand patterns across different subsegments and regions
- Identifying and profiling key market players in the market
- Determining the market share of key players operating in the market
- Providing a comparative analysis of the market leaders on the basis of the following:
- Product offerings
- Business strategies
- Strengths and weaknesses
- Key financials
- Understanding the competitive landscape and identifying the major growth strategies adopted by players across regions.
Recent developments:
- In January 2018, ADM (US) opened an innovation center in Singapore. This facility facilitates ingredient creation and the application & development of products.
- In January 2018, Du Pont completed its acquisition of FMC Corporation’s health and nutrition business. This acquisition will strengthen the company’s position in the specialty ingredients market
Reasons to buy this report:
- To get a comprehensive overview of the release agents market
- To gain wide-ranging information about the top players in this industry, their product portfolios, and key strategies adopted by them
- To gain insights about the major countries/regions in which the market is flourishing
Available Customizations:
The following customization options are available for the report:
Segment Analysis
- Product Matrix, which gives a detailed comparison of the product portfolio of each company
Regional Analysis of Release Agents Market
- Further breakdown of the Rest of Asia-Pacific market, by country
- Further breakdown of the Rest of Europe market, by country
- Further breakdown of South American market, by country
- Further breakdown of the market in the Middle East & Africa, by country
Company Information
- Detailed analysis and profiling of additional market players (up to five)
To speak to our analyst for a discussion on the above findings, click Speak to Analyst
 Exclusive indicates content/data unique to MarketsandMarkets and not available with any competitors.
Table of Contents
1 Introduction
1.1 Objectives of the Study
1.2 Market Definition
1.3 Market Scope
1.4 Periodization
1.5 Currency
1.6 Units
1.7 Stakeholders
2 Research Methodology
2.1 Research Data
2.1.1 Secondary Data
2.1.1.1 Key Data From Secondary Sources
2.1.2 Primary Data
2.1.2.1 Breakdown of Primaries, By Company Type, Designation, and Region
2.1.2.2 Key Industry Insights
2.2 Market Size Estimation
2.2.1 Bottom-Up Approach
2.2.2 Top-Down Approach
2.3 Market Breakdown & Data Triangulation
2.4 Research Assumptions & Limitations
2.4.1 Assumptions
2.4.2 Limitations
3 Executive Summary
4 Premium Insights
4.1 Attractive Opportunities in the Market
4.2 Market For Release Agents Size, By Region (KT)
4.3 European Release Agents Market Share, By Ingredient & Country, 2018
4.4 Fastest-Growing Countries in Each Region
5 Market Overview
5.1 Introduction
5.2 Market Dynamics
5.2.1 Drivers
5.2.1.1 Increased Use of Release Agents in the Baking Industry
5.2.1.2 Growth in Demand for Natural Sources of Ingredients
5.2.1.3 Research & Development Driving Innovation
5.2.1.4 Increase in Consumer Awareness & Health Concerns
5.2.2 Restraints
5.2.2.1 International Regulations Governing the Use of Release Agents in Food
5.2.3 Opportunities
5.2.3.1 Emerging Markets Illustrating High Potential for Food Release Agents
5.2.4 Challenges
5.2.4.1 Approval From Various Regulatory Bodies
5.2.4.2 Rise in Prices of Raw Materials Such as Vegetable Oils
5.3 Supply Chain Analysis
5.4 Patent Analysis
5.5 Pest Analysis
5.5.1 Political/Legal Factors
5.5.1.1 Government Regulations
5.5.2 Economic Factors
5.5.2.1 Fluctuating Raw Material Prices
5.5.2.2 Rise in Disposable Incomes in Emerging Economies
5.5.3 Social Factors
5.5.3.1 Release Agents Causing Allergies
5.5.4 Technological Factors
5.5.4.1 Selection of Release Agents
5.5.4.2 Expansion of Operational Capabilities of Key Market Players
6 Release Agents Market: Regulatory Framework
6.1 Introduction
6.2 Food and Drug Administration
6.3 Food Standards Australia New Zealand (FSANZ)
7 Market for Release Agents, By Ingredient
7.1 Introduction
7.2 Vegetable Oils
7.3 Emulsifiers
7.3.1 Mono & Di-Glycerides
7.3.2 Lecithin
7.3.3 Sorbitan Esters & Stearoyl Lactylates
7.3.4 Other Emulsifiers
7.4 Wax & Wax Esters
7.5 Antioxidants
7.6 Other Ingredients
8 Market for Release Agents, By Application
8.1 Introduction
8.2 Bakery Products
8.2.1 Breads
8.2.2 Cakes & Pastries
8.2.3 Cookies & Biscuits
8.2.4 Other Bakery Products
8.3 Confectionery Products
8.4 Processed Meat
8.5 Other Applications
9 Market for Release Agents, By Form
9.1 Introduction
9.2 Liquid
9.3 Solid
10 Market for Release Agents, By Formulation
10.1 Kosher
10.2 Non-GMO
10.3 Trans-fat free
10.4 Alergen-free
10.5 Certified organic
10 Market For Release Agents, By Region
10.1 Introduction
10.2 North America
10.2.1 US
10.2.2 Canada
10.2.3 Mexico
10.3 Europe
10.3.1 UK
10.3.2 Germany
10.3.3 France
10.3.4 Netherlands
10.3.5 Rest of Europe
10.4 Asia Pacific
10.4.1 China
10.4.2 India
10.4.3 Japan
10.4.4 Rest of Asia Pacific
10.5 Rest of the World (RoW)
10.5.1 South America
10.5.2 Middle East & Africa
11 Competitive Landscape
11.1 Overview
11.1.1 Key Market Strategies
11.2 Competitive Scenario
11.2.1 Expansions & Investments
11.2.2 Mergers & Acquisitions
11.2.3 Agreements, Partnerships, Collaborations, and Joint Ventures
11.2.4 New Product Launches
12 Company Profiles
(Business Overview, Products Offered, Recent Developments, SWOT Analysis & MnM View)*
12.1 Archer Daniels Midland Company
12.2 AAK AB
12.3 Cargill
12.4 Dowdupont
12.5 Avatar Corporation
12.6 Par-Way Tryson Company
12.7 Associated British Foods PLC
12.8 Mallet & Company, Inc.
12.9 IFC Solutions, Inc.
12.10 Lecico GmbH
12.11 Lallemand
12.12 Masterol Foods Pty Ltd
12.13 Puratos Group NV
12.14 The Bakels Group
12.15 Koninklijke Zeelandia Group B.V.
12.16 Dübör Groneweg GmbH & Co. Kg
12.17 Sonneveld Group BV
13 Appendix
13.1 Discussion Guide
13.2 Knowledge Store: Marketsandmarkets’ Subscription Portal
13.3 Introducing RT: Real Time Market Intelligence
13.4 Available Customizations
13.5 Related Reports
13.6 Author Details
List of Tables (75 Tables)
Table 1 US Dollar Exchange Rate Considered for Study, 2014–2016
Table 2 Asia Pacific: Top Five Emerging Economies on the Basis of GDP Per Capita (Ppp), 2013
Table 3 Limitations of Release Agents
Table 4 Permitted Food Lubricants and Release & Anti-Stick Agents
Table 5 Release Agents Market Size, By Ingredient, 2016–2023 (USD Million)
Table 6 Market Size, By Ingredient, 2016–2023 (KT)
Table 7 Vegetable Oils: By Market Size, By Region, 2016–2023 (USD Million)
Table 8 Vegetable Oils: By Market Size, By Region, 2016–2023 (KT)
Table 9 Emulsifiers: Market Size, By Region, 2016–2023 (USD Million)
Table 10 Emulsifiers: Market Size, By Region, 2016–2023 (KT)
Table 11 Wax & Wax Esters: By Market Size, By Region, 2016–2023 (USD Million)
Table 12 Wax & Wax Esters: Release Agents Size, By Region, 2016–2023 (KT)
Table 13 Antioxidants: Market Size, By Region, 2016–2023 (USD Million)
Table 14 Antioxidants: Market Size, By Region, 2016–2023 (KT)
Table 15 Other Ingredients: By Market Size, By Region, 2016–2023 (USD Million)
Table 16 Other Ingredients: By Market Size, By Region, 2016–2023 (KT)
Table 17 Release Agents Market Size, By Application, 2016–2023 (USD Million)
Table 18 Release Agents Market Size, By Application, 2016–2023 (KT)
Table 19 RA Market Size in Bakery Products, By Subapplication, 2016–2023 (USD Million)
Table 20 Market Size in Bakery Products, By Region, 2016–2023 (USD Million)
Table 21 Release Agents Market Size in Bakery Products, By Region, 2016–2023 (KT)
Table 22 RA Market Size in Breads, By Region, 2016–2023 (USD Million)
Table 23 Market Size in Cakes & Pastries, By Region, 2016–2023 (USD Million)
Table 24 RA Market Size in Cookies & Biscuits, By Region, 2016–2023 (USD Million)
Table 25 Market Size in Other Bakery Products, By Region, 2016–2023 (USD Million)
Table 26 Market Size in Confectionery Products, By Region, 2016–2023 (USD Million)
Table 27 Market Size in Confectionery Products, By Region, 2016–2023 (KT)
Table 28 Market Size in Processed Meat, By Region, 2016–2023 (USD Million)
Table 29 Release Agents Size in Processed Meat, By Region, 2016–2023 (KT)
Table 30 Release Agents Market Size in Convenience Food, By Region, 2016–2023 (USD Million)
Table 31 Release Agents Market Size in Convenience Food, By Region, 2016–2023 (KT)
Table 32 Market Size in Other Applications, By Region, 2016–2023 (USD Million)
Table 33 Market Size in Other Applications, By Region, 2016–2023 (KT)
Table 34 Market For Release Agents Size, By Form, 2016–2023 (USD Million)
Table 35 Market Size, By Form, 2016–2023 (KT)
Table 36 Liquid RA Market Size, By Region, 2016 - 2023 (USD Million)
Table 37 Solid Release Agents Size, By Region, 2016-2023 (USD Million)
Table 38 Market For Release Agents Size, By Region, 2016–2023 (USD Million)
Table 39 Market Size, By Region, 2016–2023 (KT)
Table 40 North America: Release Agents Market Size, By Country, 2016–2023 (USD Million)
Table 41 North America: Market Size, By Country, 2016–2023 (KT)
Table 42 North America: Market Size, By Application, 2016–2023 (USD Million)
Table 43 North America: By Market Size, By Application, 2016–2023 (KT)
Table 44 North America: By Market Size, By Ingredient, 2016–2023 (USD Million)
Table 45 North America: Market Size, By Ingredient, 2016–2023 (KT)
Table 46 North America: Market Size, By Form, 2016–2023 (USD Million)
Table 47 North America: Market Size, By Bakery Subapplication, 2016–2023 (USD Million)
Table 48 Europe: By Market Size, By Country, 2016–2023 (USD Million)
Table 49 Europe: Market Size, By Country, 2016–2023 (KT)
Table 50 Europe: Market Size, By Application, 2016–2023 (USD Million)
Table 51 Europe: Market Size, By Application, 2016–2023 (KT)
Table 52 Europe: By Market Size, By Bakery Subapplication, 2016–2023 (USD Million)
Table 53 Europe: Market Size, By Ingredient, 2016–2023 (USD Million)
Table 54 Europe: By Market Size, By Ingredient, 2016–2023 (KT)
Table 55 Europe: Market Size, By Form, 2016–2023 (USD Million)
Table 56 Asia Pacific: By Market Size, By Country/Region, 2016–2023 (USD Million)
Table 57 Asia Pacific: By Market Size, By Country/Region, 2016–2023 (KT)
Table 58 Asia Pacific: Market Size, By Application, 2016–2023 (USD Million)
Table 59 Asia Pacific: Market Size, By Application, 2016–2023 (KT)
Table 60 Asia Pacific: By Market Size, By Bakery Subapplication, 2016–2023 (USD Million)
Table 61 Asia Pacific: Market Size, By Ingredient, 2016–2023 (USD Million)
Table 62 Asia Pacific: Market Size, By Ingredient, 2016–2023 (KT)
Table 63 Asia Pacific: Market Size, By Form, 2016–2023 (USD Million)
Table 64 RoW: By Market Size, By Region, 2016–2023 (USD Million)
Table 65 RoW: Market Size, By Region, 2016–2023 (KT)
Table 66 RoW: Market Size, By Application, 2016–2023 (USD Million)
Table 67 RoW: Market Size, By Mode of Application, 2016–2023 (KT)
Table 68 RoW: Market Size, By Ingredient, 2016–2023 (USD Million)
Table 69 RoW: Market Size, By Ingredient, 2016–2023 (KT)
Table 70 RoW: Market Size, By Bakery Subapplication, 2016–2023 (USD Million)
Table 71 RoW: Release Agents Market Size, By Form, 2016–2023 (USD Million)
Table 72 Expansions & Investments, 2012–2018
Table 73 Mergers & Acquisitions, 2012–2018
Table 74 Agreements, Partnerships, Collaborations, and Joint Ventures, 2013–2017
Table 75 New Product Launches, 2012–2016
List of Figures (41 Figures)
Figure 1 Market Segmentation
Figure 2 Geographic Scope: Release Agents Market
Figure 3 Research Design
Figure 4 Market Size Estimation Methodology: Bottom-Up Approach
Figure 5 Market Size Estimation Methodology: Top-Down Approach
Figure 6 Data Triangulation
Figure 7 Assumptions of the Research Study
Figure 8 Limitations of the Research Study
Figure 9 Market For Release Agents Size, By Application, 2018 vs 2023 (USD Million)
Figure 10 Market Size, By Ingredient, 2018 vs 2023 (USD Million)
Figure 11 Market Size, By Form, 2018 vs 2023 (USD Million)
Figure 12 Market Share, By Region, 2017
Figure 13 Growing Bakery Industry to Drive the Market for Release Agents
Figure 14 Market Size for Release Agents, 2018 vs 2023 (KT)
Figure 15 Vegetable Oils Segment to Dominate the European Release Agents Market in 2018
Figure 16 India to Grow at the Highest CAGR From 2018 to 2023
Figure 17 Market: Drivers, Restraints, Opportunities, and Challenges
Figure 18 Vegetable Oil Price Fluctuation, 2005–2014 (USD/Ton)
Figure 19 Vegetable Oils Segment to Dominate the Market From 2018 to 2023 (USD Million)
Figure 20 Vegetable Oils: By Market Size, By Region, 2018 vs 2023
Figure 21 The Bakery Segment Dominated the Market From 2018 to 2023 (USD Million)
Figure 22 The Breads Segment is Projected to Dominate the Market in the Bakery Industry Through 2023
Figure 23 Market For Release Agents Size, By Form, 2018 vs 2023 (USD Million)
Figure 24 Geographic Snapshot (2018–2023): Rapidly Growing Asia Pacific Countries are Emerging as New Hotspots
Figure 25 North America: Market Snapshot
Figure 26 UK Dominated the European Release Agents Market in 2017
Figure 27 China Held the Largest Share in the Market in Asia Pacific
Figure 28 Key Developments By Leading Players in the Market From 2014 to 2018
Figure 29 Release Agents Market Developments, By Growth Strategy, 2012–2018
Figure 30 Archer Daniels Midland Company: Company Snapshot
Figure 31 Archer Daniels Midland Company: SWOT Analysis
Figure 32 AAK AB: Company Snapshot
Figure 33 AAK AB: SWOT Analysis
Figure 34 Cargill: Company Snapshot
Figure 35 Cargill: SWOT Analysis
Figure 36 Dupont: Company Snapshot
Figure 37 Dowdupont: SWOT Analysis
Figure 38 Avatar Corporation: SWOT Analysis
Figure 39 Par-Way Tryson Company: SWOT Analysis
Figure 40 Associated British Foods PLC: Company Snapshot
Figure 41 Associated British Foods PLC: SWOT Analysis


Growth opportunities and latent adjacency in Release Agents Market
Hi,I am interested in the report but would like to understand the methodology used for market derivation first and whether the market is based on consumption or production. Kindly connect.