Food Antioxidants Market

Food Antioxidants Market by Source (Fruits & Vegetables, Oils, Spices & Herbs, Botanical Extracts, Gallic Acid & Petroleum), Application (Fats & Oils, Prepared Meat & Poultry, Bakery & Confectionery), Type, Form and Region - Global Forecast to 2028

Report Code: FB 4880 May, 2023, by marketsandmarkets.com

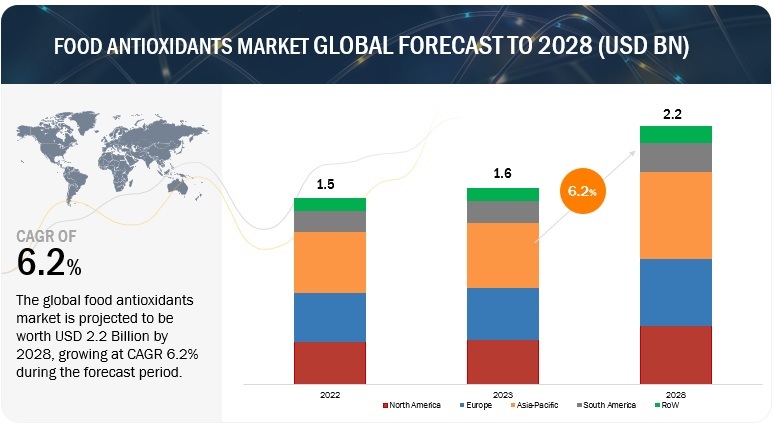
The global food antioxidants market size was valued at US$ 1.5 billion in 2022 and is poised to grow from US$ 1.6 billion in 2023 to US$ 2.2 billion by 2028, growing at a CAGR of 6.2% in the forecast period (2023-2028).

Antioxidants are substances that stop the oxidation process, which could harm organisms' cells and lead to the creation of free radicals. They can be acquired naturally from a variety of fruits and vegetables, including raspberries, spinach, and eggplant, or they can be produced artificially and used as additions for a variety of uses. In addition to being widely utilised as a preservative in many processed food goods, it is also widely employed as an additive for fuel, plastic, and latex. Additionally, it plays a crucial role in many pharmaceutical and cosmetic items. Also contributing to the market's growth throughout the projected period will be the world's growing population, and the high demand for processed foods, provides an explosive rise.

Food Antioxidants Market

To know about the assumptions considered for the study, Request for Free Sample Report
Food Antioxidants Market

To know about the assumptions considered for the study, download the pdf brochure

Drivers: Growth in the prepared food industry is likey to propel the market

Prepared foods are processed foods that are treated to ensure longer shelf life, reduce rancidity, and be easy to use. The prepared food industry is expected to witness substantial growth in the coming years due to factors such as high disposable income and a gradual increase in the number of working women, thereby positively impacting the food antioxidants market.

The rise in disposable incomes due to economic growth, especially in emerging countries such as India and China, has led to demand for convenience foods. As per a study published in the American Journal of Clinical Nutrition, ultra-processed food consumption grew from 53.5 percent of calories (2001–2002) to 57 percent at the end of (2017–2018) in the US. The rise in convenience and processed food consumption is attributed to its ease of use, variety, and all-season availability. Convenience and processed foods are consumed over an extended time, as they are pre-packaged and added with preservatives to prevent spoilage. Processed food is also convenient for transportation to distant places. Thus, it is crucial to maintain the quality, flavor, taste, and nutrient profile. The longevity of processed food is a major driver for the food antioxidants market.

Del Monte Foods announced a new snacking innovation, Del Monte Fruit Infusions, expanding the brand's presence in the produce refrigerated aisle. This new line of products launched in the US in 2021, incorporates fruit chunks infused with antioxidant premixes. These Del Monte Fruit Infusions snacks claim to offer an innovative and convenient snacking solution for on-the go jobs. Del Monte Fruit Infusions come in four refreshing flavors, each with a full serving of fruit and unique ingredients that claim to support different nutritional needs, like healthy digestion, hydration, energy, and antioxidant support. According to the company, this product is a healthy snacking choice as it is made with real fruit juice and does not contain added sugar, artificial sweeteners, artificial flavors, artificial certified colors, preservatives, or GMO ingredients.

Restraints: Strict regulatory compliances for synthetic antioxidants and low permissible usage limits in food products

Among food additives, there is limited awareness regarding food antioxidants and additives regulations. Owing to increased awareness about health and supporting research about toxicity and health challenges caused by few food additives, there are stricter regulations about manufacturing, registration, and usage of food additives. Several regulatory bodies are now setting stringent frameworks for the permissible usage of food additives. For example, FDA considers: 1) the composition and properties of the substance, 2) the amount that would typically be consumed, 3) immediate and long-term health effects, and 4) various safety factors associated with any food additive. Similarly, the European Union (EU) has set strict rules for the usage of food additives. Food additives must be approved by the EU and may only be used if they fulfill the criteria laid down in Regulation (EC) No 1333/2008. They must be safe when used, and there must be a technological need for their use.  The use of food additives must not mislead the consumer and must be of benefit to the consumer. Misleading the consumer includes, but is not limited to, issues related to the nature, freshness, and quality of ingredients used, the naturalness of a product or of the production process, or the nutritional quality of the product, including its fruit and vegetable content.

On September 8, 2022, China’s National Health Commission (NHC) published on its website 18 draft National Food Safety Standards (GB standards) in relation to food additives for public comment. For the national standard for food additives – GB2760, the following major changes are proposed in the draft amendment-β-carotene and diacetyl tartaric acid mono- and di-glycerides as permitted food additives in distilled spirits; and it also adds a new warning requirement for food using excessive polyol(s) in its production that may cause diarrhea. However, the specific use level of polyol(s) that could trigger the additional labeling obligation is not yet specified in the draft standard.

In 2020, Guatemala launched New Central American Technical Regulations (RTCA) for Processed Food and Beverages. Food Additives. The RTCA aims to establish the food additives and their maximum permitted doses in different food categories. The new regulation creates special conditions applicable to the use of unauthorized food additives directly on food ingredients and raw materials. It establishes food categories in which transfers of food additives are not acceptable and a list of additives permitted by the Codex Alimentarius and those permitted by the previous regulation, and which are not adopted by the Codex Stan 192-1995.

In addition, the Central American Commission on Food Additives (CCAA) is established, which will aim to keep the list of additives contained in the Technical Regulations up to date, in turn, creating the procedure for updating the lists of additives permitted by the Regulation.

Opportunities: Popularity of long shelf life of products due to usage of antioxidants as preservatives boosts market

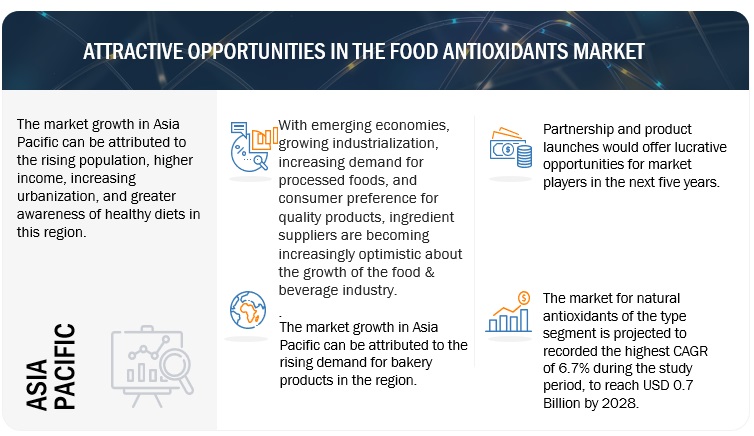
Awareness about food antioxidants is low, and emerging economies such as China and India are experiencing high industrialization. As these emerging economies grow and attain high disposable income, their demand for food antioxidants is also rising. The Asia Pacific region is exhibiting increased demand for prepared and functional foods & beverages, and hence, the region’s food antioxidants market is expected to grow. The demand for food antioxidants is expected to grow at a modest pace in early adopting countries such as Japan and Germany and at an exponential rate in new & emerging markets such as Thailand, Malaysia, and other Asian countries.

The growing global population is putting more pressure on producers for the manufacturing, extraction, and maintenance of scarce resources. High energy prices and rising raw material costs are impacting food prices, thus affecting low-income consumers. Pressure on food supplies is being exacerbated by water shortages, particularly across Africa and Northern Asia. Advances in science and technology are helping in extending the shelf life of foods to a greater extent. The need for marketing food preservatives to the smallest of food & beverage manufacturers is expected to augment the market size.

In emerging markets, where lifestyles are changing rapidly, the demand from workplaces and homes are competitively increasing, leading to a greater preference for convenience. Fast food is expected to increasingly become differentiated from junk food as quick and easy, but healthy options are preferred. Identifying ingredients with naturally high nutritional value could be a key opportunity for suppliers and manufacturers. An increase in the population of working women and the dominance of nuclear double-income families, especially in urban areas, are other trends shaping the changing lifestyles. Busy lifestyles and changing consumption patterns have led to an increased demand for processed, ready-to-cook, and ready-to-eat food, leading to increased brand-consciousness.

Natural antioxidants, such as Oryzanol, have gained immense popularity in India post the pandemic, and the Ricela Group has brought Gamma Oryzanol to India in the form of nutraceutical capsules. According to AP Organics Limited, it helps reduce high blood cholesterol and is effective for treating anxiety, managing sugar levels, helpful for patients of hypothyroidism, and plays an important role in preventing many lifestyle diseases. In 2022, Kemin Industries launched a clean label solution that has antioxidant potential and moisture retention properties that improves texture and extends the shelf life of foods. Kemin is exhibiting some of its latest clean-label innovations to aid shelf-life extension, microbial protection, textural quality, and yield enhancement solutions for a variety of foods.  Among Kemin’s range of solutions, NaturFort is a versatile combination consisting of rosemary and green tea extracts that complement each other. The two extracts offer food protection with a positive impact on flavor, color, and odor. For the snack market, the clean label antioxidant solutions significantly delay or prevent lipid oxidation. In bakery solutions, mold inhibitors avoid short product lifespans. Kemin’s range of plant extracts and antioxidants also help dressings and sauce products remain fresher and safer for longer periods while retaining the clean label status.

Challenges: Health concerns associated with chemical preservatives limit market growth

A major challenge in the food antioxidants industry is the health hazards caused due to the consumption of synthetic antioxidants. Dried and dehydrated foods often contain phenolic antioxidants. This antioxidant helps in the prevention of lipid oxidation during processing and storage. Although various food products (including beverages) pass through several quality, safety, and regulatory mandates, consumers are concerned about synthetic food antioxidants used due to allergic reactions. The US FDA estimated that more than one million people with digestive issues are sensitive or allergic to phenols. Symptoms related to phenol allergy consumption include difficulty breathing, runny nose, wheezing, and stuffiness in the head. The Food and Drug Administration (FDA), in 2013, approved more than 3,000 food additives for use in the US. However, food additives may still threaten health despite being approved for human consumption.

For example, the antioxidant butylated hydroxyanisole (BHA) curbs spoilage in cereals, oils, and foods high in fat. However, when consumed in high dosages, BHA can induce tumors. The Asthma and Allergy Foundation of America in 2005 reported that two food preservatives—BHT and BHA—have been linked to chronic hives and various skin reactions. These preservatives are added to breakfast cereals and grain products to preserve color, flavor, and odor. Studies have shown that benzoates can cause hyperactivity and have toxic effects at higher concentrations causing skin irritations. Benzoates are also linked to various ailments, such as allergies, asthma, gastric irritation, and migraine headaches.

Food processors and manufacturers treat meat and fish with nitrites to preserve color and reduce the growth of botulism-causing bacteria. The reaction of nitrites with amino acids results in the formation of carcinogenic nitrosamines. The FDA regulates the number of nitrites used in food processing, keeping the level of chemical preservatives below the threshold for the formation of nitrosamines. Therefore, using a preservative should not result in deception or adversely affect the nutritional value of the food while following good manufacturing practices. This is thereby expected to restrict the market growth of food antioxidants, and better alternatives may be adopted more.

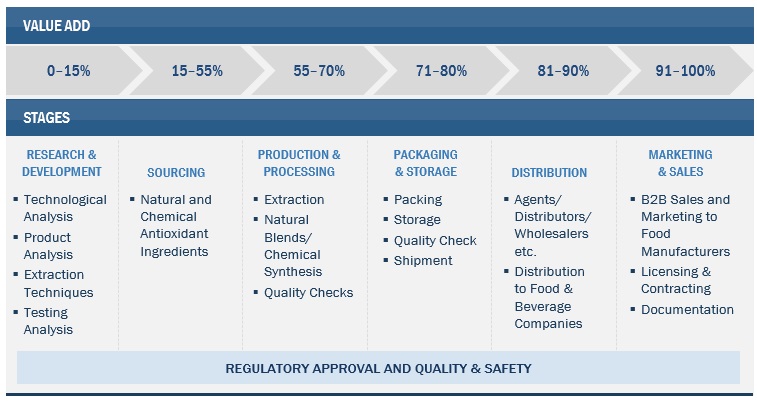
Food Antioxidants Market: Value Chain Analysis
Food Antioxidants Market Size, and Share

Based on type, synthetic segment is estimated to account for the largest market share of the food antioxidants market.

In order to produce a variety of food products, butylated hydroxyanisole (BHA), butylated hydroxytoluene (BHT), tert-butylhydroquinone (TBHQ), and propyl gallate (PG) are increasingly used. Synthetic antioxidants are made by a conventional industrial process using a variety of ingredients. As a result, its use as an addition is subject to some rigorous regulations from the governments of several nations. Synthetic antioxidants are frequently used to extend the shelf life of food goods and improve their texture, colour, and scent.

Based on source, the petroleum sub segment of the synthetic segment are anticipated to dominate the market.

Food antioxidants extracted from petroleum contain statins and vitamin E, which help prevent cholesterol, cardiovascular diseases and prevent food from free radical damage. Synthetic food antioxidants such as BHA, BHT, and TBHQ are commonly used in the food industry to prevent spoilage and extend the shelf life of processed foods. These antioxidants are derived from petroleum and are added to food products in small quantities. BHA and BHT are often used together and can be found in a wide range of products, including baked goods, snack foods, and cereal. TBHQ is also used as a preservative in many processed foods, including cooking oils and margarine.

Based on application, the prepared meat and poultry segment is projected to witness the highest CAGR during the forecast period.

Prepared meat & poultry products manufacturers use antioxidants for several reasons, primarily to preserve the quality and extend the shelf life of their products. Antioxidants are added to meat products to prevent or delay the oxidation process, which can cause meat to spoil and lose its flavor, texture, and nutritional value. Oxidation occurs when oxygen reacts with the fats in meat, causing them to become rancid and produce off-flavors and odors. To maintain the quality and freshness of meat for longer periods, exporters can incorporate antioxidants, which can either prevent or slow down the oxidation process. This becomes crucial for meat products that need to be transported over long distances or stored for extended periods before being sold. Commonly used antioxidants in the meat industry include Vitamin E, ascorbic acid (Vitamin C), and various plant-based extracts such as rosemary extract, green tea extract, and grape seed extract. Thus, the increase of prepared meat & poultry consumption potentially increase the usage of food antioxidants in the meat & poultry products.

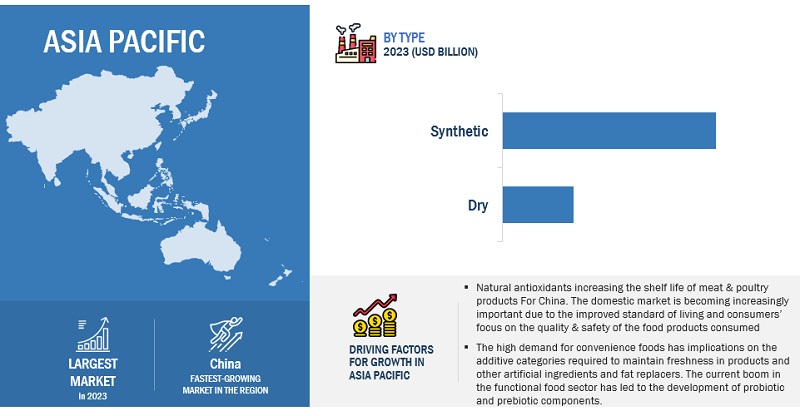
The Asia Pacific market is projected to contribute the largest share for the food antioxidants market.

In 2022, the Asia Pacific region dominated the global market for food antioxidants, largely as a result of the growing demand from food manufacturers in developed nations to move their production facilities to emerging markets, where labor costs are low and establishment and production costs are low. The market revenue growth in the area has been fueled by this trend as well as the increased need for natural and synthetic food antioxidants for producing various food products.
Food Antioxidants Market Size, and Share

Key Market Players

Archer Daniels Midland (US), BASF SE (Germany), International Flavors & Fragrances Inc. (US), Eastman Chemical Company (US), and DSM (The Netherland) are among the key players in the global food antioxidant market. To increase their company's revenues and market shares, companies are focusing on launching new products, developing partnerships, and expanding their production facilities. The key strategies used by companies in the food antioxidants market include geographical expansion to tap the potential of emerging economies, strategic acquisitions to gain a foothold over the extensive supply chain, and new product launches as a result of extensive research and development (R&D) initiatives.

Get online access to the report on the World's First Market Intelligence Cloud

  • Easy to Download Historical Data & Forecast Numbers
  • Company Analysis Dashboard for high growth potential opportunities
  • Research Analyst Access for customization & queries
  • Competitor Analysis with Interactive dashboard
  • Latest News, Updates & Trend analysis
Request Sample

Scope of the Report

Report Metric

Details

Market size estimation

2023–2028

Base year considered

2022

Forecast period considered

2023–2028

Units considered

Value (USD)

Segments covered

By Type, By Source, By Application, By Form, and By Region

Regions covered

North America, Europe, Asia Pacific, South America, and RoW

Companies studied

  • Archer Daniels Midland (Us)
  • BASF SE (Germany)
  • International Flavors & Fragrances Inc. (Us)
  • Eastman Chemical Company (Us)
  • DSM (The Netherland)
  • Camlin Fine Sciences Ltd (India)
  • Kemin Industries, Inc. (Us)
  • Vitablend Nederland B.V. (The Netherlands)
  • Divi’s Laboratories (India)
  • Kalsec Inc. (Us)
  • BTSA (Spain)
  • Nexira (France)
  • AOM (Argentina)
  • Crystal Quinone Pvt. Ltd (India)
  • VDH Chem Tech Pvt. Ltd (India)

Food Antioxidants Market:

By Type
  • Natural
  • Vitamin C
  • Vitamin E
  • Carotenoids
  • Rosemary extracts
  • Green tea extracts
  • Other natural types*
  • Synthetic
  • Tert-Butylhydroquinone (TBHQ)
  • Butylated Hydroxyanisole (BHA)
  • Butylated Hydroxytoluene (BHT)
  • Propyl Gallate (PG)
  • Other Synthetic Types**
By Form
  • Dry
  • Liquid
By Source
  • Fruits & Vegetables
  • Oils
  • Spices & Herbs
  • Botanical Extracts
  • Gallic Acid
  • Petroleum-Derived
By Application
  • Fats & Oils
  • Prepared Foods
  • Prepared Meat & Poultry
  • Beverages
  • Seafood
  • Bakery & Confectionery
  • Plant-Based Alternatives
  • Nutraceuticals
  • Other Applications***
By Region:
  • North America
  • Europe
  • Asia Pacific
  • South America
  • Rest of the World (RoW)****

* Other natural type includes acerola extracts and grapeseed extracts
** Other synthetic type includes potassium sorbate and calcium propionate
*** Other applications include margarines, dressings, infant milk formula, mayonnaise, tea, and coffee
****RoW includes the Middle East and Africa.

Recent Developments

  • In July 2022, ADM announced it acquisition of Yerbalatina Phytoactives. This acquisition will expand ADM’s solutions capabilities in the food, beverage, and health industries with a range of more than 100 botanical products and solutions, including functional nutrition and health ingredients, organic food colorings, and organic nutritional extracts In August 2021, new product launch of GEA Ariete Homogenizer 3160 was designed by GEA to be a high-pressure homogenizer to process a wide range of products, including those with high viscosity and solid content. The GEA TriplexPanda Lab Homogenizer, on the other hand, was a laboratory-scale homogenizer that could be used for product development and testing. By extending its range of homogenizers, GEA would be able to offer its customers a wider range of options to meet their specific processing needs. This would help strengthen the company’s position as a leading supplier of food antioxidants.
  • In February 2021, merger between International Flavors & Fragrances (IFF) and DuPont's Nutrition & Biosciences business, creating a global ingredients and solutions leader serving consumer-oriented food & beverage, home & personal care, and health & wellness markets. The combined company will continue to operate under the name IFF and trade on the New York Stock Exchange.

Frequently Asked Questions (FAQ):

To speak to our analyst for a discussion on the above findings, click Speak to Analyst

TABLE OF CONTENTS
 
1 INTRODUCTION (Page No. - 42)
    1.1 STUDY OBJECTIVES 
    1.2 MARKET DEFINITION 
    1.3 STUDY SCOPE 
           FIGURE 1 MARKET SEGMENTATION
           1.3.1 REGIONAL SCOPE
           1.3.2 INCLUSIONS & EXCLUSIONS
           1.3.3 YEARS CONSIDERED
    1.4 CURRENCY CONSIDERED 
           TABLE 1 USD EXCHANGE RATES, 2018–2022
    1.5 VOLUME UNIT CONSIDERED 
    1.6 STAKEHOLDERS 
    1.7 SUMMARY OF CHANGES 
           1.7.1 RECESSION IMPACT ANALYSIS
 
2 RESEARCH METHODOLOGY (Page No. - 48)
    2.1 RESEARCH DATA 
           FIGURE 2 RESEARCH DESIGN
           2.1.1 SECONDARY DATA
                    2.1.1.1 Key data from secondary sources
           2.1.2 PRIMARY DATA
                    2.1.2.1 Key data from primary sources
                    2.1.2.2 Key industry insights
                    2.1.2.3 Breakdown of primary interviews
                               FIGURE 3 BREAKDOWN OF PRIMARY INTERVIEWS: BY COMPANY TYPE, DESIGNATION,  AND REGION
    2.2 MARKET SIZE ESTIMATION 
           2.2.1 MARKET SIZE ESTIMATION: BOTTOM-UP APPROACH
                    FIGURE 4 FOOD ANTIOXIDANTS MARKET SIZE ESTIMATION: BOTTOM-UP APPROACH
                    FIGURE 5 FOOD ANTIOXIDANTS MARKET SIZE ESTIMATION (DEMAND SIDE)
           2.2.2 MARKET SIZE ESTIMATION: TOP-DOWN APPROACH
                    FIGURE 6 FOOD ANTIOXIDANTS MARKET SIZE ESTIMATION: TOP-DOWN APPROACH
                    FIGURE 7 FOOD ANTIOXIDANTS MARKET SIZE ESTIMATION, BY TYPE (SUPPLY SIDE)
    2.3 GROWTH RATE FORECAST ASSUMPTIONS 
    2.4 DATA TRIANGULATION 
           FIGURE 8 DATA TRIANGULATION
    2.5 RESEARCH ASSUMPTIONS 
           TABLE 2 RESEARCH ASSUMPTIONS
    2.6 LIMITATIONS AND RISK ASSESSMENT 
           TABLE 3 LIMITATIONS AND RISK ASSESSMENT
    2.7 MACROINDICATORS OF RECESSION 
           FIGURE 9 INDICATORS OF RECESSION
           FIGURE 10 WORLD INFLATION RATE: 2011–2021
           FIGURE 11 GLOBAL GDP: 2011–2021 (USD TRILLION)
           FIGURE 12 RECESSION INDICATORS AND THEIR IMPACT ON FOOD ANTIOXIDANTS MARKET
           FIGURE 13 GLOBAL FOOD ANTIOXIDANTS MARKET: EARLIER FORECAST VS. RECESSION FORECAST
 
3 EXECUTIVE SUMMARY (Page No. - 63)
    TABLE 4 GLOBAL FOOD ANTIOXIDANTS MARKET SNAPSHOT, 2023 VS. 2028 
    FIGURE 14 FOOD ANTIOXIDANTS MARKET, BY TYPE, 2023 VS. 2028 (USD MILLION) 
    FIGURE 15 FOOD ANTIOXIDANTS MARKET, BY SOURCE, 2023 VS. 2028 
    FIGURE 16 FOOD ANTIOXIDANTS MARKET, BY APPLICATION, 2023 VS. 2028 (USD MILLION) 
    FIGURE 17 FOOD ANTIOXIDANTS MARKET, BY FORM, 2023 VS. 2028 (USD MILLION) 
    FIGURE 18 ASIA PACIFIC ACCOUNTED FOR LARGEST MARKET SHARE 
 
4 PREMIUM INSIGHTS (Page No. - 70)
    4.1 OPPORTUNITIES FOR PLAYERS IN GLOBAL FOOD ANTIOXIDANTS MARKET 
           FIGURE 19 INCREASED ADOPTION OF FOOD ANTIOXIDANTS ACROSS FOOD & BEVERAGE INDUSTRY GLOBALLY TO DRIVE MARKET
    4.2 FOOD ANTIOXIDANTS MARKET, BY TYPE AND REGION 
           FIGURE 20 ASIA PACIFIC TO ACCOUNT FOR LARGEST SHARE IN 2023
    4.3 ASIA PACIFIC: FOOD ANTIOXIDANTS, BY TYPE AND COUNTRY 
           FIGURE 21 SYNTHETIC SEGMENT AND CHINA TO ACCOUNT FOR SIGNIFICANT  SHARE IN 2023
    4.4 GLOBAL FOOD ANTIOXIDANTS MARKET: MAJOR REGIONAL SUBMARKETS 
           FIGURE 22 MEXICO TO ACCOUNT FOR LARGEST SHARE IN 2023
 
5 MARKET OVERVIEW (Page No. - 74)
    5.1 INTRODUCTION 
    5.2 MACROECONOMIC INDICATORS 
           5.2.1 GROWING MEAT CONSUMPTION GLOBALLY
           5.2.2 RISING EDIBLE OIL PRODUCTION
                    FIGURE 23 MAJOR OILSEEDS: WORLD SUPPLY AND DISTRIBUTION (COUNTRY VIEW) MILLION METRIC TONS, 2017–2021
    5.3 MARKET DYNAMICS 
           FIGURE 24 FOOD ANTIOXIDANTS MARKET: DRIVERS, RESTRAINTS, OPPORTUNITIES,  AND CHALLENGES
           5.3.1 DRIVERS
                    5.3.1.1 Growth in prepared foods industry to propel market
                    5.3.1.2 Growth in use of natural antioxidants in meat & poultry in Europe and North America
                    5.3.1.3 Increase in consumer preference for organic food & beverages
                               FIGURE 25 ORGANIC FOOD & BEVERAGES MARKET, 2021 (USD BILLION)
                               FIGURE 26 TOP FIVE COUNTRIES WITH LARGEST NUMBER OF ORGANIC PRODUCERS,  2020 (MILLION)
           5.3.2 RESTRAINTS
                    5.3.2.1 Stringent regulatory compliances for synthetic antioxidants and low permissible usage limits in food products
           5.3.3 OPPORTUNITIES
                    5.3.3.1 Popularity of long shelf life of products due to use of antioxidants as preservatives to boost market
                    5.3.3.2 Innovations in antioxidant-rich foods & beverages with perceived health benefits
           5.3.4 CHALLENGES
                    5.3.4.1 Health concerns associated with chemical preservatives limit market growth
 
6 INDUSTRY TRENDS (Page No. - 85)
    6.1 INTRODUCTION 
    6.2 TARIFF AND REGULATORY LANDSCAPE 
           TABLE 5 NORTH AMERICA: LIST OF REGULATORY BODIES, GOVERNMENT AGENCIES,  AND OTHER ORGANIZATIONS
           TABLE 6 EUROPE: LIST OF REGULATORY BODIES, GOVERNMENT AGENCIES, AND OTHER ORGANIZATIONS
           TABLE 7 ASIA PACIFIC: LIST OF REGULATORY BODIES, GOVERNMENT AGENCIES,  AND OTHER ORGANIZATIONS
           TABLE 8 SOUTH AMERICA: LIST OF REGULATORY BODIES, GOVERNMENT AGENCIES,  AND OTHER ORGANIZATIONS
           TABLE 9 REST OF THE WORLD: LIST OF REGULATORY BODIES, GOVERNMENT AGENCIES, AND OTHER ORGANIZATIONS
    6.3 REGULATORY FRAMEWORK 
           6.3.1 NORTH AMERICA
                    6.3.1.1 US
                               TABLE 10 LIMITATION FOR USE OF BHA ALONE OR IN COMBINATION WITH BHT AS AN ANTIOXIDANT IN FOOD
                               TABLE 11 LIMITATION FOR USE OF BHT ALONE OR IN COMBINATION WITH BHA AS AN  ANTIOXIDANT IN FOOD
                    6.3.1.2 Canada
                               TABLE 12 ADDITIVES AND THEIR PERMITTED USE IN VARIOUS FOOD APPLICATIONS IN CANADA
                    6.3.1.3 Mexico
           6.3.2 EUROPE
                    TABLE 13 ADDITIVES AND THEIR PERMITTED USE IN VARIOUS FOOD APPLICATIONS IN EUROPE
                    6.3.2.1 France
                    6.3.2.2 Italy
           6.3.3 ASIA PACIFIC
                    6.3.3.1 Australia
                               TABLE 14 LIST OF FOOD ANTIOXIDANTS WITH PERMITTED LEVELS
                    6.3.3.2 Japan
                               TABLE 15 FOOD ANTIOXIDANTS WITH STANDARDS OF USE
                    6.3.3.3 Australia & New Zealand
           6.3.4 SOUTH AMERICA
                    6.3.4.1 Brazil
                    6.3.4.2 Argentina
                    6.3.4.3 Rest of South America
           6.3.5 MIDDLE EAST
           6.3.6 SOUTH AFRICA
                    TABLE 16 MAXIMUM LEVEL OF FOOD ANTIOXIDANTS PERMITTED IN FOODSTUFFS
    6.4 PATENT ANALYSIS 
           FIGURE 27 NUMBER OF PATENTS GRANTED FOR FOOD ANTIOXIDANT PRODUCTS IN GLOBAL MARKET, 2012–2022
           FIGURE 28 REGIONAL ANALYSIS OF PATENTS GRANTED IN FOOD ANTIOXIDANTS  MARKET, 2022
           TABLE 17 LIST OF MAJOR PATENTS PERTAINING TO FOOD ANTIOXIDANTS MARKET, 2012–2021
    6.5 VALUE CHAIN ANALYSIS 
           FIGURE 29 FOOD ANTIOXIDANTS MARKET: VALUE CHAIN ANALYSIS
           6.5.1 RESEARCH AND PRODUCT DEVELOPMENT
           6.5.2 RAW MATERIAL SOURCING
           6.5.3 PRODUCTION AND PROCESSING
           6.5.4 DISTRIBUTION
           6.5.5 MARKETING AND SALES
    6.6 TRENDS/DISRUPTIONS IMPACTING CUSTOMER BUSINESS 
           FIGURE 30 REVENUE SHIFT FOR FOOD ANTIOXIDANTS MARKET
    6.7 FOOD ANTIOXIDANTS MARKET: ECOSYSTEM MARKET MAP 
           6.7.1 DEMAND SIDE
           6.7.2 SUPPLY SIDE
                    FIGURE 31 FOOD ANTIOXIDANTS: MARKET MAP
                    TABLE 18 FOOD ANTIOXIDANTS MARKET ECOSYSTEM
    6.8 TRADE ANALYSIS 
           FIGURE 32 IMPORT VALUE OF PROVITAMINS, VITAMINS; NATURAL OR REPRODUCED BY SYNTHESIS DERIVATIVES THEREOF USED AS VITAMINS, AND INTERMIXTURES, WHETHER OR NOT IN ANY SOLVENT, FOR KEY COUNTRIES, 2018–2022
           TABLE 19 IMPORT VALUE OF PROVITAMINS, VITAMINS; NATURAL OR REPRODUCED BY SYNTHESIS DERIVATIVES THEREOF USED AS VITAMINS, AND INTERMIXTURES, WHETHER OR NOT IN ANY SOLVENT, FOR KEY COUNTRIES, 2021 (USD THOUSAND)
           FIGURE 33 EXPORT VALUE OF PROVITAMINS, VITAMINS; NATURAL OR REPRODUCED BY SYNTHESIS DERIVATIVES THEREOF USED AS VITAMINS, AND INTERMIXTURES, WHETHER OR NOT IN ANY SOLVENT, FOR KEY COUNTRIES, 2018–2022
           TABLE 20 EXPORT VALUE OF PROVITAMINS, VITAMINS; NATURAL OR REPRODUCED BY SYNTHESIS DERIVATIVES THEREOF USED AS VITAMINS, AND INTERMIXTURES, WHETHER OR NOT IN ANY SOLVENT, FOR KEY COUNTRIES, 2021 (USD THOUSAND)
           FIGURE 34 IMPORT VALUE OF POLYPHENOLS; HYDROQUINONE (QUINOL) AND ITS SALTS, FOR KEY COUNTRIES, 2018–2022
           TABLE 21 IMPORT VALUE OF POLYPHENOLS; HYDROQUINONE (QUINOL) AND ITS SALTS,  2018–2022 (USD)
           FIGURE 35 EXPORT VALUE OF POLYPHENOLS; HYDROQUINONE (QUINOL) AND ITS SALTS, FOR KEY COUNTRIES, 2018–2022
           TABLE 22 EXPORT VALUE OF POLYPHENOLS; HYDROQUINONE (QUINOL) AND ITS SALTS, 2022 (USD)
    6.9 AVERAGE PRICING ANALYSIS 
           6.9.1 AVERAGE PRICING ANALYSIS: FOOD ANTIOXIDANTS MARKET,  BY REGION, 2018–2022
                    FIGURE 36 AVERAGE PRICE TREND FOR FOOD ANTIOXIDANTS, BY REGION,  2018–2022 (USD/KG)
           6.9.2 AVERAGE PRICING ANALYSIS: FOOD ANTIOXIDANTS MARKET  FOR KEY PLAYERS, BY TYPE, 2018–2022
                    FIGURE 37 AVERAGE PRICE TREND: FOOD ANTIOXIDANTS MARKET, FOR KEY PLAYERS,  BY TYPE, 2018–2022 (USD/KG)
           6.9.3 AVERAGE PRICING ANALYSIS: FOOD ANTIOXIDANTS MARKET,  BY TYPE, 2018–2022
                    FIGURE 38 AVERAGE PRICE TREND FOR FOOD ANTIOXIDANTS, BY TYPE,  2018–2022 (USD/KG)
    6.10 TECHNOLOGY ANALYSIS 
           6.10.1 RAPID TESTING FOR FOOD ANTIOXIDANTS
           6.10.2 HARVESTFRESH TECHNOLOGY
    6.11 CASE STUDIES 
           6.11.1 FLORIDA FOOD PRODUCTS (FFP) DEBUTS CLEAN-LABEL ANTIOXIDANT SOLUTION
           6.11.2 DEL MONTE INTRODUCES FRUIT INFUSIONS WITH ANTIOXIDANTS
    6.12 PORTER’S FIVE FORCES ANALYSIS 
                    TABLE 23 FOOD ANTIOXIDANTS MARKET: PORTER’S FIVE FORCES ANALYSIS
           6.12.1 INTENSITY OF COMPETITIVE RIVALRY
           6.12.2 BARGAINING POWER OF SUPPLIERS
           6.12.3 BARGAINING POWER OF BUYERS
           6.12.4 THREAT OF SUBSTITUTES
           6.12.5 THREAT OF NEW ENTRANTS
    6.13 KEY STAKEHOLDERS AND BUYING CRITERIA 
           6.13.1 KEY STAKEHOLDERS IN BUYING PROCESS
                    FIGURE 39 INFLUENCE OF STAKEHOLDERS ON BUYING PROCESS FOR FOOD ANTIOXIDANTS, BY TYPE
                    TABLE 24 INFLUENCE OF STAKEHOLDERS ON BUYING PROCESS FOR FOOD ANTIOXIDANTS, BY TYPE
           6.13.2 BUYING CRITERIA
                    TABLE 25 KEY CRITERIA FOR SELECTING SUPPLIER/VENDOR
                    FIGURE 40 KEY CRITERIA FOR SELECTING SUPPLIER/VENDOR
    6.14 KEY CONFERENCES AND EVENTS (2023–2024) 
                    TABLE 26 KEY CONFERENCES AND EVENTS IN FOOD ANTIOXIDANTS MARKET, 2023–2024
 
7 FOOD ANTIOXIDANTS MARKET, BY SOURCE (Page No. - 125)
    7.1 INTRODUCTION 
           FIGURE 41 FOOD ANTIOXIDANTS MARKET, BY SOURCE, 2023 VS. 2028 (USD MILLION)
           TABLE 27 NATURAL FOOD ANTIOXIDANTS MARKET, BY SOURCE, 2018–2022 (USD MILLION)
           TABLE 28 NATURAL FOOD ANTIOXIDANTS MARKET, BY SOURCE, 2023–2028 (USD MILLION)
           TABLE 29 SYNTHETIC FOOD ANTIOXIDANTS MARKET, BY SOURCE, 2018–2022 (USD MILLION)
           TABLE 30 SYNTHETIC FOOD ANTIOXIDANTS MARKET, BY SOURCE, 2023–2028 (USD MILLION)
    7.2 NATURAL 
           TABLE 31 NATURAL FOOD ANTIOXIDANTS MARKET, BY REGION, 2018–2022 (USD MILLION)
           TABLE 32 NATURAL FOOD ANTIOXIDANTS MARKET, BY REGION, 2023–2028 (USD MILLION)
           7.2.1 FRUITS & VEGETABLES
                    7.2.1.1 Highly potent natural antioxidant compounds in fruits & vegetables to drive their use as antioxidant source
                               TABLE 33 FRUITS & VEGETABLES: NATURAL FOOD ANTIOXIDANTS MARKET, BY REGION,  2018–2022 (USD MILLION)
                               TABLE 34 FRUITS & VEGETABLES: NATURAL FOOD ANTIOXIDANTS MARKET, BY REGION,  2023–2028 (USD MILLION)
           7.2.2 OILS
                    7.2.2.1 Antioxidants extracted from oils have high value, which could help preserve perishable oil-based food products
                               TABLE 35 OILS: NATURAL FOOD ANTIOXIDANTS MARKET, BY REGION, 2018–2022 (USD MILLION)
                               TABLE 36 OILS: NATURAL FOOD ANTIOXIDANTS MARKET, BY REGION, 2023–2028 (USD MILLION)
           7.2.3 SPICES & HERBS
                    7.2.3.1 Antioxidant and anti-inflammatory properties of spices and herbs to propel natural antioxidants market
                               TABLE 37 SPICES & HERBS: NATURAL FOOD ANTIOXIDANTS MARKET, BY REGION,  2018–2022 (USD MILLION)
                               TABLE 38 SPICES & HERBS: NATURAL FOOD ANTIOXIDANTS MARKET, BY REGION,  2023–2028 (USD MILLION)
           7.2.4 BOTANICAL EXTRACTS
                    7.2.4.1 Antibacterial and longer shelf life properties to drive demand for botanical extracts-based antioxidants
                               TABLE 39 BOTANICAL EXTRACTS: NATURAL FOOD ANTIOXIDANTS MARKET, BY REGION,  2018–2022 (USD MILLION)
                               TABLE 40 BOTANICAL EXTRACTS: NATURAL FOOD ANTIOXIDANTS MARKET, BY REGION,  2023–2028 (USD MILLION)
    7.3 SYNTHETIC 
           TABLE 41 SYNTHETIC FOOD ANTIOXIDANTS MARKET, BY REGION, 2018–2022 (USD MILLION)
           TABLE 42 SYNTHETIC FOOD ANTIOXIDANTS MARKET, BY REGION, 2023–2028 (USD MILLION)
           7.3.1 GALLIC ACID
                    7.3.1.1 Lower molecular weight and pharmacological effects of gallic acid-based antioxidants in processed foods to drive synthetic antioxidants market
                               TABLE 43 GALLIC ACID: SYNTHETIC FOOD ANTIOXIDANTS MARKET, BY REGION,  2018–2022 (USD MILLION)
                               TABLE 44 GALLIC ACID: SYNTHETIC FOOD ANTIOXIDANTS MARKET, BY REGION,  2023–2028 (USD MILLION)
           7.3.2 PETROLEUM-DERIVED
                    7.3.2.1 Petroleum-derived antioxidants prevent food damage from free radicals and provide longer shelf life
                               TABLE 45 PETROLEUM-DERIVED: SYNTHETIC FOOD ANTIOXIDANTS MARKET, BY REGION,  2018–2022 (USD MILLION)
                               TABLE 46 PETROLEUM-DERIVED: SYNTHETIC FOOD ANTIOXIDANTS MARKET, BY REGION,  2023–2028 (USD MILLION)
 
8 FOOD ANTIOXIDANTS MARKET, BY APPLICATION (Page No. - 138)
    8.1 INTRODUCTION 
           FIGURE 42 FOOD ANTIOXIDANTS MARKET, BY APPLICATION, 2023 VS. 2028 (USD MILLION)
           TABLE 47 FOOD ANTIOXIDANTS MARKET, BY APPLICATION, 2018–2022 (USD MILLION)
           TABLE 48 FOOD ANTIOXIDANTS MARKET, BY APPLICATION, 2023–2028 (USD MILLION)
    8.2 FATS & OILS 
           8.2.1 THERMAL STABILIZATION DURING HEAT PROCESSING IN FATS & OILS TO DRIVE USE OF ANTIOXIDANTS IN FOOD PRODUCTS
                    TABLE 49 FATS & OILS: FOOD ANTIOXIDANTS MARKET, BY REGION, 2018–2022 (USD MILLION)
                    TABLE 50 FATS & OILS: FOOD ANTIOXIDANTS MARKET, BY REGION, 2023–2028 (USD MILLION)
    8.3 PREPARED FOODS 
           8.3.1 BOTANICAL EXTRACT-BASED ANTIOXIDANTS FIND GREATER USE AS NATURAL ANTIOXIDANTS HELP REDUCE LIPID OXIDATION IN FOODS
                    TABLE 51 PREPARED FOODS: FOOD ANTIOXIDANTS MARKET, BY REGION,  2018–2022 (USD MILLION)
                    TABLE 52 PREPARED FOODS: NATURAL FOOD ANTIOXIDANTS MARKET, BY REGION,  2023–2028 (USD MILLION)
    8.4 PREPARED MEAT & POULTRY 
           8.4.1 USE OF ANTIOXIDANTS TO PREVENT DE-COLORATION OF MEAT & POULTRY PRODUCTS AND EXTEND THEIR SHELF LIFE TO DRIVE DEMAND
                    TABLE 53 PREPARED MEAT & POULTRY: FOOD ANTIOXIDANTS MARKET, BY REGION,  2018–2022 (USD MILLION)
                    TABLE 54 PREPARED MEAT & POULTRY: FOOD ANTIOXIDANTS MARKET, BY REGION,  2023–2028 (USD MILLION)
    8.5 BEVERAGES 
           8.5.1 NATURAL ANTIOXIDANTS IN BEVERAGES PRESERVE PRODUCTS, PROVIDING HIGHER BENEFITS TO CONSUMERS
                    TABLE 55 BEVERAGES: FOOD ANTIOXIDANTS MARKET, BY REGION, 2018–2022 (USD MILLION)
                    TABLE 56 BEVERAGES: FOOD ANTIOXIDANTS MARKET, BY REGION,  2023–2028 (USD MILLION)
    8.6 BAKERY & CONFECTIONERY 
           8.6.1 ENHANCED SHELF LIFE OF ANTIOXIDANT-ENRICHED BAKERY PRODUCTS TO DRIVE MARKET
                    TABLE 57 BAKERY & CONFECTIONERY: FOOD ANTIOXIDANTS MARKET, BY REGION,  2018–2022 (USD MILLION)
                    TABLE 58 BAKERY & CONFECTIONERY: FOOD ANTIOXIDANTS MARKET, BY REGION,  2023–2028 (USD MILLION)
    8.7 SEAFOOD 
           8.7.1 USE OF NATURAL ANTIOXIDANTS TO INCREASE SHELF-LIFE OF SEAFOOD PRODUCTS TO FUEL DEMAND
                    TABLE 59 SEAFOOD: FOOD ANTIOXIDANTS MARKET, BY REGION, 2018–2022 (USD MILLION)
                    TABLE 60 SEAFOOD: FOOD ANTIOXIDANTS MARKET, BY REGION,  2023–2028 (USD MILLION)
    8.8 PLANT-BASED ALTERNATIVES (MEAT & DAIRY) 
           8.8.1 RISE IN CONSUMPTION OF ASSOCIATED MEAT PRODUCTS TO DRIVE MARKET FOR ANTIOXIDANTS
                    TABLE 61 PLANT-BASED ALTERNATIVES: FOOD ANTIOXIDANTS MARKET, BY REGION,  2018–2022 (USD MILLION)
                    TABLE 62 PLANT-BASED ALTERNATIVES: FOOD ANTIOXIDANTS MARKET, BY REGION,  2023–2028 (USD MILLION)
    8.9 NUTRACEUTICALS 
           8.9.1 GROWING APPLICATIONS OF ANTIOXIDANTS IN NUTRACEUTICALS INDUSTRY TO DRIVE MARKET
                    TABLE 63 NUTRACEUTICALS: FOOD ANTIOXIDANTS MARKET, BY REGION,  2018–2022 (USD MILLION)
                    TABLE 64 NUTRACEUTICALS: FOOD ANTIOXIDANTS MARKET, BY REGION,  2023–2028 (USD MILLION)
    8.10 OTHER APPLICATIONS 
           TABLE 65 OTHER APPLICATIONS: FOOD ANTIOXIDANTS MARKET, BY REGION,  2018–2022 (USD MILLION)
           TABLE 66 OTHER APPLICATIONS: NATURAL FOOD ANTIOXIDANTS MARKET, BY REGION,  2023–2028 (USD MILLION)
 
9 FOOD ANTIOXIDANTS MARKET, BY FORM (Page No. - 154)
    9.1 INTRODUCTION 
           FIGURE 43 FOOD ANTIOXIDANTS MARKET, BY FORM, 2023 VS. 2028 (USD MILLION)
           TABLE 67 FOOD ANTIOXIDANTS MARKET, BY FORM, 2018–2022 (USD MILLION)
           TABLE 68 FOOD ANTIOXIDANTS MARKET, BY FORM, 2023–2028 (USD MILLION)
    9.2 DRY 
           9.2.1 EASY MIXABILITY OF DRY FORM WITH ANTIOXIDANTS TO DRIVE MARKET
                    TABLE 69 DRY: FOOD ANTIOXIDANTS MARKET, BY REGION, 2018–2022 (USD MILLION)
                    TABLE 70 DRY: FOOD ANTIOXIDANTS MARKET, BY REGION, 2023–2028 (USD MILLION)
    9.3 LIQUID 
           9.3.1 UNIFORMITY AND ACCURATE DOSING OF LIQUID FOOD ANTIOXIDANTS TO DRIVE MARKET
                    TABLE 71 LIQUID: FOOD ANTIOXIDANTS MARKET, BY REGION, 2018–2022 (USD MILLION)
                    TABLE 72 LIQUID: FOOD ANTIOXIDANTS MARKET, BY REGION, 2023–2028 (USD MILLION)
 
10 FOOD ANTIOXIDANTS MARKET, BY TYPE (Page No. - 159)
     10.1 INTRODUCTION 
               FIGURE 44 FOOD ANTIOXIDANTS MARKET, BY TYPE, 2023 VS. 2028 (USD MILLION)
               TABLE 73 FOOD ANTIOXIDANTS MARKET, BY TYPE, 2018–2022 (USD MILLION)
               TABLE 74 FOOD ANTIOXIDANTS MARKET, BY TYPE, 2023–2028 (USD MILLION)
               TABLE 75 FOOD ANTIOXIDANTS MARKET, BY TYPE, 2018–2022 (KT)
               TABLE 76 FOOD ANTIOXIDANTS MARKET, BY TYPE, 2023–2028 (KT)
     10.2 NATURAL ANTIOXIDANTS 
             10.2.1 RISING CONCERNS REGARDING SAFETY OF SYNTHETIC ANTIOXIDANTS
                       TABLE 77 NATURAL ANTIOXIDANTS: FOOD ANTIOXIDANTS MARKET, BY REGION,  2018–2022 (USD MILLION)
                       TABLE 78 NATURAL ANTIOXIDANTS: FOOD ANTIOXIDANTS MARKET, BY REGION,  2023–2028 (USD MILLION)
                       TABLE 79 NATURAL ANTIOXIDANTS: FOOD ANTIOXIDANTS MARKET, BY TYPE,  2018–2022 (USD MILLION)
                       TABLE 80 NATURAL ANTIOXIDANTS: FOOD ANTIOXIDANTS MARKET, BY TYPE,  2023–2028 (USD MILLION)
             10.2.2 VITAMIN E
                       10.2.2.1 Reduces risk of cardiovascular diseases
                                   TABLE 81 VITAMIN E: FOOD ANTIOXIDANTS MARKET, BY REGION, 2018–2022 (USD MILLION)
                                   TABLE 82 VITAMIN E: FOOD ANTIOXIDANTS MARKET, BY REGION, 2023–2028 (USD MILLION)
             10.2.3 VITAMIN C
                       10.2.3.1 Consumption as antioxidant prevents heart disease
                                   TABLE 83 VITAMIN C: FOOD ANTIOXIDANTS MARKET, BY REGION, 2018–2022 (USD MILLION)
                                   TABLE 84 VITAMIN C: FOOD ANTIOXIDANTS MARKET, BY REGION, 2023–2028 (USD MILLION)
             10.2.4 CAROTENOIDS
                       10.2.4.1 Help boost immunity and delay onset of cancer
                                   TABLE 85 CAROTENOIDS: FOOD ANTIOXIDANTS MARKET, BY REGION, 2018–2022 (USD MILLION)
                                   TABLE 86 CAROTENOIDS: FOOD ANTIOXIDANTS MARKET, BY REGION, 2023–2028 (USD MILLION)
             10.2.5 ROSEMARY EXTRACT
                       10.2.5.1 Helps preserve foods and reduces use as synthetic antioxidants
                                   TABLE 87 ROSEMARY EXTRACT: FOOD ANTIOXIDANTS MARKET, BY REGION,  2018–2022 (USD MILLION)
                                   TABLE 88 ROSEMARY EXTRACT: FOOD ANTIOXIDANTS MARKET, BY REGION,  2023–2028 (USD MILLION)
             10.2.6 GREEN TEA EXTRACT
                       10.2.6.1 Helps boost antioxidant capacity and improves skin texture
                                   TABLE 89 GREEN TEA EXTRACT: FOOD ANTIOXIDANTS MARKET, BY REGION,  2018–2022 (USD MILLION)
                                   TABLE 90 GREEN TEA EXTRACT: FOOD ANTIOXIDANTS MARKET, BY REGION,  2023–2028 (USD MILLION)
             10.2.7 OTHER NATURAL TYPES
                       TABLE 91 OTHER NATURAL TYPES: FOOD ANTIOXIDANTS MARKET, BY REGION,  2018–2022 (USD MILLION)
                       TABLE 92 OTHER NATURAL TYPES: FOOD ANTIOXIDANTS MARKET, BY REGION,  2023–2028 (USD MILLION)
     10.3 SYNTHETIC 
             10.3.1 NATURAL DEFENSE PROPERTY OF SYNTHETIC ANTIOXIDANTS  IN OILS & FATS
                       TABLE 93 SYNTHETIC: FOOD ANTIOXIDANTS MARKET, BY REGION, 2018–2022 (USD MILLION)
                       TABLE 94 SYNTHETIC: FOOD ANTIOXIDANTS MARKET, BY REGION, 2023–2028 (USD MILLION)
                       TABLE 95 SYNTHETIC ANTIOXIDANTS: FOOD ANTIOXIDANTS MARKET, BY TYPE,  2018–2022 (USD MILLION)
                       TABLE 96 SYNTHETIC ANTIOXIDANTS: FOOD ANTIOXIDANTS MARKET, BY TYPE,  2023–2028 (USD MILLION)
             10.3.2 BUTYLATED HYDROXYANISOLE (BHA)
                       10.3.2.1 Used in bakery, spices, and cereals
                                   TABLE 97 BHA: FOOD ANTIOXIDANTS MARKET, BY REGION, 2018–2022 (USD MILLION)
                                   TABLE 98 BHA: FOOD ANTIOXIDANTS MARKET, BY REGION, 2023–2028 (USD MILLION)
             10.3.3 BUTYLATED HYDROXYTOLUENE (BHT)
                       10.3.3.1 Has rancidity reducing capacity
                                   TABLE 99 BHT: FOOD ANTIOXIDANTS MARKET, BY REGION, 2018–2022 (USD MILLION)
                                   TABLE 100 BHT: FOOD ANTIOXIDANTS MARKET, BY REGION, 2023–2028 (USD MILLION)
             10.3.4 TERT-BUTYLHYDROQUINONE (TBHQ)
                       10.3.4.1 Oxidation prevention capability reduces quality deterioration and spoilage
                                   TABLE 101 TBHQ: FOOD ANTIOXIDANTS MARKET, BY REGION, 2018–2022 (USD MILLION)
                                   TABLE 102 TBHQ: FOOD ANTIOXIDANTS MARKET, BY REGION, 2023–2028 (USD MILLION)
             10.3.5 PROPYL-GALLATE (PG)
                       10.3.5.1 Highly used in convenience and processed foods
                                   TABLE 103 PG: FOOD ANTIOXIDANTS MARKET, BY REGION, 2018–2022 (USD MILLION)
                                   TABLE 104 PG: FOOD ANTIOXIDANTS MARKET, BY REGION, 2023–2028 (USD MILLION)
             10.3.6 OTHER SYNTHETIC TYPES
                       TABLE 105 OTHER SYNTHETIC TYPES: FOOD ANTIOXIDANTS MARKET, BY REGION,  2018–2022 (USD MILLION)
                       TABLE 106 OTHER SYNTHETIC TYPES: FOOD ANTIOXIDANTS MARKET, BY REGION,  2023–2028 (USD MILLION)
 
11 FOOD ANTIOXIDANTS MARKET, BY FUNCTIONALITY (Page No. - 180)
     11.1 INTRODUCTION 
             11.1.1 NUTRIENT STABILITY
             11.1.2 FLAVOR STABILITY
             11.1.3 COLOR STABILITY
 
12 FOOD ANTIOXIDANTS MARKET, BY REGION (Page No. - 182)
     12.1 INTRODUCTION 
               FIGURE 45 MEXICO TO WITNESS HIGHEST GROWTH RATE IN FOOD ANTIOXIDANTS MARKET BETWEEN 2023–2028
               TABLE 107 FOOD ANTIOXIDANTS MARKET, BY REGION, 2018–2022 (USD MILLION)
               TABLE 108 FOOD ANTIOXIDANTS MARKET, BY REGION, 2023–2028 (USD MILLION)
               TABLE 109 FOOD ANTIOXIDANTS MARKET, BY REGION, 2018–2022 (KT)
               TABLE 110 FOOD ANTIOXIDANTS MARKET, BY REGION, 2023–2028 (KT)
     12.2 NORTH AMERICA 
               FIGURE 46 NORTH AMERICA: FOOD ANTIOXIDANTS MARKET SNAPSHOT
               TABLE 111 NORTH AMERICA: FOOD ANTIOXIDANTS MARKET, BY COUNTRY,  2018–2022 (USD MILLION)
               TABLE 112 NORTH AMERICA: FOOD ANTIOXIDANTS MARKET, BY COUNTRY,  2023–2028 (USD MILLION)
               TABLE 113 NORTH AMERICA: FOOD ANTIOXIDANTS MARKET, BY TYPE, 2018–2022 (USD MILLION)
               TABLE 114 NORTH AMERICA: FOOD ANTIOXIDANTS MARKET, BY TYPE, 2023–2028 (USD MILLION)
               TABLE 115 NORTH AMERICA: FOOD ANTIOXIDANTS MARKET, BY TYPE, 2018–2022 (KT)
               TABLE 116 NORTH AMERICA: FOOD ANTIOXIDANTS MARKET, BY TYPE, 2023–2028 (KT)
               TABLE 117 NORTH AMERICA: NATURAL FOOD ANTIOXIDANTS MARKET, BY TYPE,  2018–2022 (USD MILLION)
               TABLE 118 NORTH AMERICA: NATURAL FOOD ANTIOXIDANTS MARKET, BY TYPE,  2023–2028 (USD MILLION)
               TABLE 119 NORTH AMERICA: SYNTHETIC FOOD ANTIOXIDANTS MARKET, BY TYPE,  2018–2022 (USD MILLION)
               TABLE 120 NORTH AMERICA: SYNTHETIC FOOD ANTIOXIDANTS MARKET, BY TYPE,  2023–2028 (USD MILLION)
               TABLE 121 NORTH AMERICA: NATURAL FOOD ANTIOXIDANTS MARKET, BY SOURCE,  2018–2022 (USD MILLION)
               TABLE 122 NORTH AMERICA: NATURAL FOOD ANTIOXIDANTS MARKET, BY SOURCE,  2023–2028 (USD MILLION)
               TABLE 123 NORTH AMERICA: SYNTHETIC FOOD ANTIOXIDANTS MARKET, BY SOURCE,  2018–2022 (USD MILLION)
               TABLE 124 NORTH AMERICA: SYNTHETIC FOOD ANTIOXIDANTS MARKET, BY SOURCE,  2023–2028 (USD MILLION)
               TABLE 125 NORTH AMERICA: FOOD ANTIOXIDANTS MARKET, BY FORM,  2018–2022 (USD MILLION)
               TABLE 126 NORTH AMERICA: FOOD ANTIOXIDANTS MARKET, BY FORM,  2023–2028 (USD MILLION)
               TABLE 127 NORTH AMERICA: FOOD ANTIOXIDANTS MARKET, BY APPLICATION,  2018–2022 (USD MILLION)
               TABLE 128 NORTH AMERICA: FOOD ANTIOXIDANTS MARKET, BY APPLICATION,  2023–2028 (USD MILLION)
             12.2.1 NORTH AMERICA: RECESSION IMPACT ANALYSIS
                       FIGURE 47 INFLATION: COUNTRY-LEVEL DATA (2018-2021)
                       FIGURE 48 NORTH AMERICA FOOD ANTIOXIDANTS MARKET: RECESSION IMPACT ANALYSIS
             12.2.2 US
                       12.2.2.1 Expansion of meat processing industry to create growth opportunities for market
                                   TABLE 129 US: FOOD ANTIOXIDANTS MARKET, BY TYPE, 2018–2022 (USD MILLION)
                                   TABLE 130 US: FOOD ANTIOXIDANTS MARKET, BY TYPE, 2023–2028 (USD MILLION)
                                   TABLE 131 US: FOOD ANTIOXIDANTS MARKET, BY FORM, 2018–2022 (USD MILLION)
                                   TABLE 132 US: FOOD ANTIOXIDANTS MARKET, BY FORM, 2023–2028 (USD MILLION)
             12.2.3 CANADA
                       12.2.3.1 Increase in consumption of prepared food products and rising growth of food processing industry to drive market
                                   TABLE 133 CANADA: FOOD ANTIOXIDANTS MARKET, BY TYPE, 2018–2022 (USD MILLION)
                                   TABLE 134 CANADA: FOOD ANTIOXIDANTS MARKET, BY TYPE, 2023–2028 (USD MILLION)
                                   TABLE 135 CANADA: FOOD ANTIOXIDANTS MARKET, BY FORM, 2018–2022 (USD MILLION)
                                   TABLE 136 CANADA: FOOD ANTIOXIDANTS MARKET, BY FORM, 2023–2028 (USD MILLION)
             12.2.4 MEXICO
                       12.2.4.1 Ever-growing soft drink demand to boost market
                                   TABLE 137 MEXICO: FOOD ANTIOXIDANTS MARKET, BY TYPE, 2018–2022 (USD MILLION)
                                   TABLE 138 MEXICO: FOOD ANTIOXIDANTS MARKET, BY TYPE, 2023–2028 (USD MILLION)
                                   TABLE 139 MEXICO: FOOD ANTIOXIDANTS MARKET, BY FORM, 2018–2022 (USD MILLION)
                                   TABLE 140 MEXICO: FOOD ANTIOXIDANTS MARKET, BY FORM, 2023–2028 (USD MILLION)
     12.3 EUROPE 
               TABLE 141 EUROPE: FOOD ANTIOXIDANTS MARKET, BY TYPE, 2018–2022 (USD MILLION)
               TABLE 142 EUROPE: FOOD ANTIOXIDANTS MARKET, BY TYPE, 2023–2028 (USD MILLION)
               TABLE 143 EUROPE: FOOD ANTIOXIDANTS MARKET, BY TYPE, 2018–2022 (KT)
               TABLE 144 EUROPE: FOOD ANTIOXIDANTS MARKET, BY TYPE, 2023–2028 (KT)
               TABLE 145 EUROPE: NATURAL FOOD ANTIOXIDANTS MARKET, BY TYPE, 2018–2022 (USD MILLION)
               TABLE 146 EUROPE: NATURAL FOOD ANTIOXIDANTS MARKET, BY TYPE, 2023–2028 (USD MILLION)
               TABLE 147 EUROPE: SYNTHETIC FOOD ANTIOXIDANTS MARKET, BY TYPE, 2018–2022 (USD MILLION)
               TABLE 148 EUROPE: SYNTHETIC FOOD ANTIOXIDANTS MARKET, BY TYPE, 2023–2028 (USD MILLION)
               TABLE 149 EUROPE: FOOD ANTIOXIDANTS MARKET, BY FORM, 2018–2022 (USD MILLION)
               TABLE 150 EUROPE: FOOD ANTIOXIDANTS MARKET, BY FORM, 2023–2028 (USD MILLION)
               TABLE 151 EUROPE: FOOD ANTIOXIDANTS MARKET, BY SOURCE, 2018–2022 (USD MILLION)
               TABLE 152 EUROPE: FOOD ANTIOXIDANTS MARKET, BY SOURCE, 2023–2028 (USD MILLION)
               TABLE 153 EUROPE: NATURAL FOOD ANTIOXIDANTS MARKET, BY SOURCE,  2018–2022 (USD MILLION)
               TABLE 154 EUROPE: NATURAL FOOD ANTIOXIDANTS MARKET, BY SOURCE,  2023–2028 (USD MILLION)
               TABLE 155 EUROPE: FOOD ANTIOXIDANTS MARKET, BY COUNTRY, 2018–2022 (USD MILLION)
               TABLE 156 EUROPE: FOOD ANTIOXIDANTS MARKET, BY COUNTRY 2023–2028 (USD MILLION)
             12.3.1 EUROPE: RECESSION IMPACT ANALYSIS
                       FIGURE 49 EUROPE: INFLATION RATES, BY KEY COUNTRY, 2018–2021
                       FIGURE 50 EUROPE: RECESSION IMPACT ANALYSIS
             12.3.2 GERMANY
                       12.3.2.1 Increasing shelf life and improved taste because of natural antioxidants to drive market
                                   TABLE 157 GERMANY: FOOD ANTIOXIDANTS MARKET, BY TYPE, 2018–2022 (USD MILLION)
                                   TABLE 158 GERMANY: FOOD ANTIOXIDANTS MARKET, BY TYPE, 2023–2028 (USD MILLION)
                                   TABLE 159 GERMANY: FOOD ANTIOXIDANTS MARKET, BY FORM, 2018–2022 (USD MILLION)
                                   TABLE 160 GERMANY: FOOD ANTIOXIDANTS MARKET, BY FORM, 2023–2028 (USD MILLION)
             12.3.3 UK
                       12.3.3.1 Growing demand for antioxidants to prevent meat products from spoilage
                                   TABLE 161 UK: FOOD ANTIOXIDANTS MARKET, BY TYPE, 2018–2022 (USD MILLION)
                                   TABLE 162 UK: FOOD ANTIOXIDANTS MARKET, BY TYPE, 2023–2028 (USD MILLION)
                                   TABLE 163 UK: FOOD ANTIOXIDANTS MARKET, BY FORM, 2018–2022 (USD MILLION)
                                   TABLE 164 UK: FOOD ANTIOXIDANTS MARKET, BY FORM, 2023–2028 (USD MILLION)
             12.3.4 FRANCE
                       12.3.4.1 Environmental and societal demand for better food products with precise efficacy and functional characteristics to drive market
                                   TABLE 165 FRANCE: FOOD ANTIOXIDANTS MARKET, BY TYPE, 2018–2022 (USD MILLION)
                                   TABLE 166 FRANCE: FOOD ANTIOXIDANTS MARKET, BY TYPE, 2023–2028 (USD MILLION)
                                   TABLE 167 FRANCE: FOOD ANTIOXIDANTS MARKET, BY FORM, 2018–2022 (USD MILLION)
                                   TABLE 168 FRANCE: FOOD ANTIOXIDANTS MARKET, BY FORM, 2023–2028 (USD MILLION)
             12.3.5 SPAIN
                       12.3.5.1 Vitamin-rich Mediterranean diet to drive market
                                   TABLE 169 SPAIN: FOOD ANTIOXIDANTS MARKET, BY TYPE, 2018–2022 (USD MILLION)
                                   TABLE 170 SPAIN: FOOD ANTIOXIDANTS MARKET, BY TYPE, 2023–2028 (USD MILLION)
                                   TABLE 171 SPAIN: FOOD ANTIOXIDANTS MARKET, BY FORM, 2018–2022 (USD MILLION)
                                   TABLE 172 SPAIN: FOOD ANTIOXIDANTS MARKET, BY FORM, 2023–2028 (USD MILLION)
             12.3.6 ITALY
                       12.3.6.1 Use of Kiwi fruit to incorporate natural antioxidants in food products to propel market
                                   TABLE 173 ITALY: FOOD ANTIOXIDANTS MARKET, BY TYPE, 2018–2022 (USD MILLION)
                                   TABLE 174 ITALY: FOOD ANTIOXIDANTS MARKET, BY TYPE, 2023–2028 (USD MILLION)
                                   TABLE 175 ITALY: FOOD ANTIOXIDANTS MARKET, BY FORM, 2018–2022 (USD MILLION)
                                   TABLE 176 ITALY: FOOD ANTIOXIDANTS MARKET, BY FORM, 2023–2028 (USD MILLION)
             12.3.7 REST OF EUROPE
                       TABLE 177 REST OF EUROPE: FOOD ANTIOXIDANTS MARKET, BY TYPE, 2018–2022 (USD MILLION)
                       TABLE 178 REST OF EUROPE: FOOD ANTIOXIDANTS MARKET, BY TYPE, 2023–2028 (USD MILLION)
                       TABLE 179 REST OF EUROPE: FOOD ANTIOXIDANTS MARKET, BY FORM, 2018–2022 (USD MILLION)
                       TABLE 180 REST OF EUROPE: FOOD ANTIOXIDANTS MARKET, BY FORM, 2023–2028 (USD MILLION)
     12.4 ASIA PACIFIC 
               FIGURE 51 ASIA PACIFIC: FOOD ANTIOXIDANTS MARKET SNAPSHOT
               TABLE 181 ASIA PACIFIC: FOOD ANTIOXIDANTS MARKET, BY COUNTRY, 2018–2022 (USD MILLION)
               TABLE 182 ASIA PACIFIC: FOOD ANTIOXIDANTS MARKET, BY COUNTRY, 2023–2028 (USD MILLION)
               TABLE 183 ASIA PACIFIC: FOOD ANTIOXIDANTS MARKET, BY TYPE, 2018–2022 (USD MILLION)
               TABLE 184 ASIA PACIFIC: FOOD ANTIOXIDANTS MARKET, BY TYPE, 2023–2028 (USD MILLION)
               TABLE 185 ASIA PACIFIC: FOOD ANTIOXIDANTS MARKET, BY TYPE, 2018–2022 (KT)
               TABLE 186 ASIA PACIFIC: FOOD ANTIOXIDANTS MARKET, BY TYPE, 2023–2028 (KT)
               TABLE 187 ASIA PACIFIC: NATURAL FOOD ANTIOXIDANTS MARKET, BY TYPE,  2018–2022 (USD MILLION)
               TABLE 188 ASIA PACIFIC: NATURAL FOOD ANTIOXIDANTS MARKET, BY TYPE,  2023–2028 (USD MILLION)
               TABLE 189 ASIA PACIFIC: SYNTHETIC FOOD ANTIOXIDANTS MARKET, BY TYPE,  2018–2022 (USD MILLION)
               TABLE 190 ASIA PACIFIC: SYNTHETIC FOOD ANTIOXIDANTS MARKET, BY TYPE,  2023–2028 (USD MILLION)
               TABLE 191 ASIA PACIFIC: NATURAL FOOD ANTIOXIDANTS MARKET, BY SOURCE,  2018–2022 (USD MILLION)
               TABLE 192 ASIA PACIFIC: NATURAL FOOD ANTIOXIDANTS MARKET, BY SOURCE,  2023–2028 (USD MILLION)
               TABLE 193 ASIA PACIFIC: SYNTHETIC FOOD ANTIOXIDANTS MARKET, BY SOURCE,  2018–2022 (USD MILLION)
               TABLE 194 ASIA PACIFIC: SYNTHETIC FOOD ANTIOXIDANTS MARKET, BY SOURCE,  2023–2028 (USD MILLION)
               TABLE 195 ASIA PACIFIC: FOOD ANTIOXIDANTS MARKET, BY FORM,  2018–2022 (USD MILLION)
               TABLE 196 ASIA PACIFIC: FOOD ANTIOXIDANTS MARKET, BY FORM,  2023–2028 (USD MILLION)
               TABLE 197 ASIA PACIFIC: FOOD ANTIOXIDANTS MARKET, BY APPLICATION,  2018–2022 (USD MILLION)
               TABLE 198 ASIA PACIFIC: FOOD ANTIOXIDANTS MARKET, BY APPLICATION,  2023–2028 (USD MILLION)
             12.4.1 ASIA PACIFIC: RECESSION IMPACT ANALYSIS
                       FIGURE 52 INFLATION: COUNTRY-LEVEL DATA (2018–2021)
                       FIGURE 53 FOOD ANTIOXIDANTS MARKET: ASIA PACIFIC RECESSION IMPACT ANALYSIS
             12.4.2 CHINA
                       12.4.2.1 Natural antioxidants increase shelf life of meat & poultry products, fueling growth of market
                                   TABLE 199 CHINA: FOOD ANTIOXIDANTS MARKET, BY TYPE, 2018–2022 (USD MILLION)
                                   TABLE 200 CHINA: FOOD ANTIOXIDANTS MARKET, BY TYPE, 2023–2028 (USD MILLION)
                                   TABLE 201 CHINA: FOOD ANTIOXIDANTS MARKET, BY FORM, 2018–2022 (USD MILLION)
                                   TABLE 202 CHINA: FOOD ANTIOXIDANTS MARKET, BY FORM, 2023–2028 (USD MILLION)
             12.4.3 INDIA
                       12.4.3.1 Increased preference for natural and functional foods to drive market for antioxidant-enriched foods
                                   TABLE 203 INDIA: FOOD ANTIOXIDANTS MARKET, BY TYPE, 2018–2022 (USD MILLION)
                                   TABLE 204 INDIA: FOOD ANTIOXIDANTS MARKET, BY TYPE, 2023–2028 (USD MILLION)
                                   TABLE 205 INDIA: FOOD ANTIOXIDANTS MARKET, BY FORM, 2018–2022 (USD MILLION)
                                   TABLE 206 INDIA: FOOD ANTIOXIDANTS MARKET, BY FORM, 2023–2028 (USD MILLION)
             12.4.4 JAPAN
                       12.4.4.1 Increase in nutritious food production to have direct impact on use of natural food antioxidants
                                   TABLE 207 JAPAN: FOOD ANTIOXIDANTS MARKET, BY TYPE, 2018–2022 (USD MILLION)
                                   TABLE 208 JAPAN: FOOD ANTIOXIDANTS MARKET, BY TYPE, 2023–2028 (USD MILLION)
                                   TABLE 209 JAPAN: FOOD ANTIOXIDANTS MARKET, BY FORM, 2018–2022 (USD MILLION)
                                   TABLE 210 JAPAN: FOOD ANTIOXIDANTS MARKET, BY FORM, 2023–2028 (USD MILLION)
             12.4.5 AUSTRALIA & NEW ZEALAND
                       12.4.5.1 Awareness about importance of safe meat & poultry to drive market
                                   TABLE 211 AUSTRALIA & NEW ZEALAND: FOOD ANTIOXIDANTS MARKET, BY TYPE,  2018–2022 (USD MILLION)
                                   TABLE 212 AUSTRALIA & NEW ZEALAND: FOOD ANTIOXIDANTS MARKET, BY TYPE,  2023–2028 (USD MILLION)
                                   TABLE 213 AUSTRALIA & NEW ZEALAND: FOOD ANTIOXIDANTS MARKET, BY FORM,  2018–2022 (USD MILLION)
                                   TABLE 214 AUSTRALIA & NEW ZEALAND: FOOD ANTIOXIDANTS MARKET, BY FORM,  2023–2028 (USD MILLION)
             12.4.6 REST OF ASIA PACIFIC
                       TABLE 215 REST OF ASIA PACIFIC: FOOD ANTIOXIDANTS MARKET, BY TYPE,  2018–2022 (USD MILLION)
                       TABLE 216 REST OF ASIA PACIFIC: FOOD ANTIOXIDANTS MARKET, BY TYPE,  2023–2028 (USD MILLION)
                       TABLE 217 REST OF ASIA PACIFIC: FOOD ANTIOXIDANTS MARKET, BY FORM,  2018–2022 (USD MILLION)
                       TABLE 218 REST OF ASIA PACIFIC: FOOD ANTIOXIDANTS MARKET, BY FORM,  2023–2028 (USD MILLION)
     12.5 SOUTH AMERICA 
               TABLE 219 SOUTH AMERICA: FOOD ANTIOXIDANTS MARKET, BY COUNTRY,  2018–2022 (USD MILLION)
               TABLE 220 SOUTH AMERICA: FOOD ANTIOXIDANTS MARKET, BY COUNTRY,  2023–2028 (USD MILLION)
               TABLE 221 SOUTH AMERICA: FOOD ANTIOXIDANTS MARKET, BY TYPE, 2018–2022 (USD MILLION)
               TABLE 222 SOUTH AMERICA: FOOD ANTIOXIDANTS MARKET, BY TYPE, 2023–2028 (USD MILLION)
               TABLE 223 SOUTH AMERICA: FOOD ANTIOXIDANTS MARKET, BY TYPE, 2018–2022 (KT)
               TABLE 224 SOUTH AMERICA: FOOD ANTIOXIDANTS MARKET, BY TYPE, 2023–2028 (KT)
               TABLE 225 SOUTH AMERICA: NATURAL FOOD ANTIOXIDANTS MARKET, BY TYPE,  2018–2022 (USD MILLION)
               TABLE 226 SOUTH AMERICA: NATURAL FOOD ANTIOXIDANTS MARKET, BY TYPE,  2023–2028 (USD MILLION)
               TABLE 227 SOUTH AMERICA: SYNTHETIC FOOD ANTIOXIDANTS MARKET, BY TYPE,  2018–2022 (USD MILLION)
               TABLE 228 SOUTH AMERICA: SYNTHETIC FOOD ANTIOXIDANTS MARKET, BY TYPE,  2023–2028 (USD MILLION)
               TABLE 229 SOUTH AMERICA: NATURAL FOOD ANTIOXIDANTS MARKET, BY SOURCE,  2018–2022 (USD MILLION)
               TABLE 230 SOUTH AMERICA: NATURAL FOOD ANTIOXIDANTS MARKET, BY SOURCE,  2023–2028 (USD MILLION)
               TABLE 231 SOUTH AMERICA: SYNTHETIC FOOD ANTIOXIDANTS MARKET, BY SOURCE,  2018–2022 (USD MILLION)
               TABLE 232 SOUTH AMERICA: SYNTHETIC FOOD ANTIOXIDANTS MARKET, BY SOURCE,  2023–2028 (USD MILLION)
               TABLE 233 SOUTH AMERICA: FOOD ANTIOXIDANTS MARKET, BY FORM,  2018–2022 (USD MILLION)
               TABLE 234 SOUTH AMERICA: FOOD ANTIOXIDANTS MARKET, BY FORM,  2023–2028 (USD MILLION)
               TABLE 235 SOUTH AMERICA: FOOD ANTIOXIDANTS MARKET, BY APPLICATION,  2018–2022 (USD MILLION)
               TABLE 236 SOUTH AMERICA: FOOD ANTIOXIDANTS MARKET, BY APPLICATION,  2023–2028 (USD MILLION)
             12.5.1 RECESSION IMPACT ANALYSIS: SOUTH AMERICA
                       FIGURE 54 SOUTH AMERICA: INFLATION RATES, BY KEY COUNTRY, 2018–2021
                       FIGURE 55 SOUTH AMERICA: RECESSION IMPACT ANALYSIS, 2022–2023
                       12.5.2 BRAZIL
                       12.5.2.1 Rise in awareness regarding benefits of natural food antioxidants from fruits & vegetables to boost market
                                   TABLE 237 BRAZIL: FOOD ANTIOXIDANTS MARKET, BY TYPE, 2018–2022 (USD MILLION)
                                   TABLE 239 BRAZIL: FOOD ANTIOXIDANTS MARKET, BY FORM, 2018–2022 (USD MILLION)
             12.5.3 ARGENTINA
                       12.5.3.1 Increase in meat exports to drive use of food antioxidants
                                   TABLE 241 ARGENTINA: FOOD ANTIOXIDANTS MARKET, BY TYPE, 2018–2022 (USD MILLION)
                                   TABLE 242 ARGENTINA: FOOD ANTIOXIDANTS MARKET, BY TYPE, 2023–2028 (USD MILLION)
                                   TABLE 243 ARGENTINA: FOOD ANTIOXIDANTS MARKET, BY FORM, 2018–2022 (USD MILLION)
             12.5.4 REST OF SOUTH AMERICA
                       TABLE 245 REST OF SOUTH AMERICA: FOOD ANTIOXIDANTS MARKET, BY TYPE,  2018–2022 (USD MILLION)
                       TABLE 246 REST OF SOUTH AMERICA: FOOD ANTIOXIDANTS MARKET, BY TYPE,  2023–2028 (USD MILLION)
                       TABLE 247 REST OF SOUTH AMERICA: FOOD ANTIOXIDANTS MARKET, BY FORM,  2018–2022 (USD MILLION)
                       TABLE 248 REST OF SOUTH AMERICA: FOOD ANTIOXIDANTS MARKET, BY FORM,  2023–2028 (USD MILLION)
     12.6 REST OF THE WORLD (ROW) 
               TABLE 249 ROW: FOOD ANTIOXIDANTS MARKET, BY SUB-REGION, 2018–2022 (USD MILLION)
               TABLE 250 ROW: FOOD ANTIOXIDANTS MARKET, BY SUB-REGION, 2023–2028 (USD MILLION)
               TABLE 251 ROW: FOOD ANTIOXIDANTS MARKET, BY TYPE, 2018–2022 (USD MILLION)
               TABLE 252 ROW: FOOD ANTIOXIDANTS MARKET, BY TYPE, 2023–2028 (USD MILLION)
               TABLE 253 ROW: NATURAL FOOD ANTIOXIDANTS MARKET, BY TYPE, 2018–2022 (USD MILLION)
               TABLE 254 ROW: NATURAL FOOD ANTIOXIDANTS MARKET, BY TYPE, 2023–2028 (USD MILLION)
               TABLE 255 ROW: SYNTHETIC FOOD ANTIOXIDANTS MARKET, BY TYPE, 2018–2022 (USD MILLION)
               TABLE 256 ROW: SYNTHETIC FOOD ANTIOXIDANTS MARKET, BY TYPE, 2023–2028 (USD MILLION)
               TABLE 257 ROW: NATURAL FOOD ANTIOXIDANTS MARKET, BY SOURCE, 2018–2022 (USD MILLION)
               TABLE 258 ROW: NATURAL FOOD ANTIOXIDANTS MARKET, BY SOURCE, 2023–2028 (USD MILLION)
               TABLE 259 ROW: SYNTHETIC FOOD ANTIOXIDANTS MARKET, BY SOURCE, 2018–2022 (USD MILLION)
               TABLE 260 ROW: SYNTHETIC FOOD ANTIOXIDANTS MARKET, BY SOURCE, 2023–2028 (USD MILLION)
               TABLE 261 ROW: FOOD ANTIOXIDANTS MARKET, BY FORM, 2018–2022 (USD MILLION)
               TABLE 262 ROW: FOOD ANTIOXIDANTS MARKET, BY FORM, 2023–2028 (USD MILLION)
               TABLE 263 ROW: FOOD ANTIOXIDANTS MARKET, BY APPLICATION, 2018–2022 (USD MILLION)
               TABLE 264 ROW: FOOD ANTIOXIDANTS MARKET, BY APPLICATION, 2023–2028 (USD MILLION)
             12.6.1 RECESSION IMPACT ANALYSIS: ROW
                       FIGURE 56 ROW: INFLATION RATES, BY KEY REGION, 2018–2021
                       FIGURE 57 ROW: RECESSION IMPACT ANALYSIS, 2022–2023
             12.6.2 MIDDLE EAST
                       12.6.2.1 Natural food antioxidants prevent lipid oxidation in meat products
                                   TABLE 265 MIDDLE EAST: FOOD ANTIOXIDANTS MARKET, BY TYPE, 2018–2022 (USD MILLION)
                                   TABLE 266 MIDDLE EAST: FOOD ANTIOXIDANTS MARKET, BY TYPE, 2023–2028 (USD MILLION)
                                   TABLE 267 MIDDLE EAST: FOOD ANTIOXIDANTS MARKET, BY FORM, 2018–2022 (USD MILLION)
                                   TABLE 268 MIDDLE EAST: FOOD ANTIOXIDANTS MARKET, BY FORM, 2023–2028 (USD MILLION)
             12.6.3 AFRICA
                       12.6.3.1 Increase in consumption of processed food to drive food antioxidants market
                                   TABLE 269 AFRICA: FOOD ANTIOXIDANTS MARKET, BY TYPE, 2018–2022 (USD MILLION)
                                   TABLE 270 AFRICA: FOOD ANTIOXIDANTS MARKET, BY TYPE, 2023–2028 (USD MILLION)
                                   TABLE 271 AFRICA: FOOD ANTIOXIDANTS MARKET, BY FORM, 2018–2022 (USD MILLION)
                                   TABLE 272 AFRICA: FOOD ANTIOXIDANTS MARKET, BY FORM, 2023–2028 (USD MILLION)
 
13 COMPETITIVE LANDSCAPE (Page No. - 258)
     13.1 OVERVIEW 
     13.2 MARKET SHARE ANALYSIS, 2022 
               TABLE 273 FOOD ANTIOXIDANTS MARKET: INTENSITY OF COMPETITIVE RIVALRY
     13.3 KEY PLAYER STRATEGIES 
     13.4 SEGMENTAL REVENUE ANALYSIS OF KEY PLAYERS 
               FIGURE 58 SEGMENTAL REVENUE ANALYSIS OF KEY PLAYERS IN MARKET,  2018–2022 (USD BILLION)
     13.5 COMPANY EVALUATION QUADRANT (KEY PLAYERS) 
             13.5.1 STARS
             13.5.2 EMERGING LEADERS
             13.5.3 PERVASIVE PLAYERS
             13.5.4 PARTICIPANTS
                       FIGURE 59 FOOD ANTIOXIDANTS MARKET: COMPANY EVALUATION QUADRANT,  2022 (KEY PLAYERS)
             13.5.5 PRODUCT FOOTPRINT
                       TABLE 274 COMPANY FOOTPRINT, BY TYPE
                       TABLE 275 COMPANY FOOTPRINT, BY APPLICATION
                       TABLE 276 COMPANY FOOTPRINT, BY REGION
                       TABLE 277 OVERALL COMPANY FOOTPRINT
     13.6 FOOD ANTIOXIDANTS MARKET, EVALUATION QUADRANT FOR STARTUPS/SMES, 2022 
             13.6.1 PROGRESSIVE COMPANIES
             13.6.2 STARTING BLOCKS
             13.6.3 RESPONSIVE COMPANIES
             13.6.4 DYNAMIC COMPANIES
                       FIGURE 60 FOOD ANTIOXIDANTS MARKET: COMPANY EVALUATION QUADRANT, 2022 (STARTUP/SMES)
             13.6.5 COMPETITIVE BENCHMARKING OF KEY STARTUPS/SMES
                       TABLE 278 FOOD ANTIOXIDANTS MARKET: DETAILED LIST OF KEY STARTUPS/SMES
     13.7 COMPETITIVE SCENARIO 
             13.7.1 PRODUCT LAUNCHES
                       TABLE 279 FOOD ANTIOXIDANTS: PRODUCT LAUNCHES (2020–2023)
             13.7.2 DEALS
                       TABLE 280 FOOD ANTIOXIDANTS: DEALS (2020–2023)
             13.7.3 OTHERS
                       TABLE 281 FOOD ANTIOXIDANTS: OTHERS (2020–2023)
 
14 COMPANY PROFILES (Page No. - 276)
(Business overview, Products offered, Recent Developments, MNM view)*
     14.1 KEY PLAYERS 
             14.1.1 ARCHER DANIELS MIDLAND
                       TABLE 282 ARCHER DANIELS MIDLAND: BUSINESS OVERVIEW
                       FIGURE 61 ARCHER DANIELS MIDLAND: COMPANY SNAPSHOT
                       TABLE 283 ARCHER DANIELS MIDLAND: PRODUCT OFFERINGS
                       TABLE 284 ARCHER DANIELS MIDLAND: DEALS
             14.1.2 BASF SE
                       TABLE 285 BASF SE: BUSINESS OVERVIEW
                       FIGURE 62 BASF SE: COMPANY SNAPSHOT
                       TABLE 286 BASF SE: PRODUCT OFFERINGS
             14.1.3 INTERNATIONAL FLAVORS & FRAGRANCES INC.
                       TABLE 287 INTERNATIONAL FLAVORS & FRAGRANCES INC.: BUSINESS OVERVIEW
                       FIGURE 63 INTERNATIONAL FLAVORS & FRAGRANCES INC.: COMPANY SNAPSHOT
                       TABLE 288 INTERNATIONAL FLAVORS & FRAGRANCES INC.: PRODUCT OFFERINGS
                       TABLE 289 INTERNATIONAL FLAVORS & FRAGRANCES INC.: DEALS
                       TABLE 290 INTERNATIONAL FLAVORS & FRAGRANCES INC.: OTHERS
             14.1.4 EASTMAN CHEMICAL COMPANY
                       TABLE 291 EASTMAN CHEMICAL COMPANY: BUSINESS OVERVIEW
                       FIGURE 64 EASTMAN CHEMICAL COMPANY: COMPANY SNAPSHOT
                       TABLE 292 EASTMAN CHEMICAL COMPANY: PRODUCT OFFERINGS
             14.1.5 DSM
                       TABLE 293 DSM: BUSINESS OVERVIEW
                       FIGURE 65 DSM: COMPANY SNAPSHOT
                       TABLE 294 DSM: PRODUCT OFFERINGS
             14.1.6 CAMLIN FINE SCIENCES LTD
                       TABLE 295 CAMLIN FINE SCIENCES LTD: BUSINESS OVERVIEW
                       FIGURE 66 CAMLIN FINE SCIENCES LTD: COMPANY SNAPSHOT
                       TABLE 296 CAMLIN FINE SCIENCES LTD: PRODUCT OFFERINGS
             14.1.7 DIVI’S LABORATORIES
                       TABLE 297 DIVI’S LABORATORIES: BUSINESS OVERVIEW
                       FIGURE 67 DIVI’S LABORATORIES: COMPANY SNAPSHOT
                       TABLE 298 DIVI’S LABORATORIES: PRODUCT OFFERINGS
             14.1.8 KEMIN INDUSTRIES, INC.
                       TABLE 299 KEMIN INDUSTRIES, INC.: BUSINESS OVERVIEW
                       TABLE 300 KEMIN INDUSTRIES, INC.: PRODUCT OFFERINGS
                       TABLE 301 KEMIN INDUSTRIES, INC.: PRODUCT LAUNCHES
                       TABLE 302 KEMIN INDUSTRIES, INC.: DEALS
                       TABLE 303 KEMIN INDUSTRIES, INC.: OTHERS
             14.1.9 VITABLEND NEDERLAND B.V.
                       TABLE 304 VITABLEND NEDERLAND B.V.: BUSINESS OVERVIEW
                       TABLE 305 VITABLEND NEDERLAND B.V.: PRODUCT OFFERINGS
             14.1.10 KALSEC INC.
                       TABLE 306 KALSEC INC.: BUSINESS OVERVIEW
                       TABLE 307 KALSEC INC.: PRODUCT OFFERINGS
                       TABLE 308 KALSEC INC.: DEALS
             14.1.11 BTSA
                       TABLE 309 BTSA: BUSINESS OVERVIEW
                       TABLE 310 BTSA: PRODUCT OFFERINGS
             14.1.12 AOM
                       TABLE 311 AOM: BUSINESS OVERVIEW
                       TABLE 312 AOM: PRODUCT OFFERINGS
             14.1.13 CRYSTAL QUINONE PVT. LTD
                       TABLE 313 CRYSTAL QUINONE PVT. LTD: BUSINESS OVERVIEW
                       TABLE 314 CRYSTAL QUINONE PVT. LTD.: PRODUCT OFFERINGS
             14.1.14 VDH CHEM TECH PVT. LTD
                       TABLE 315 VDH CHEM TECH PVT. LTD: BUSINESS OVERVIEW
                       TABLE 316 VDH CHEM TECH PVT. LTD: PRODUCT OFFERINGS
             14.1.15 NEXIRA
                       TABLE 317 NEXIRA: BUSINESS OVERVIEW
                       TABLE 318 NEXIRA: PRODUCT OFFERINGS
*Details on Business overview, Products offered, Recent Developments, MNM view might not be captured in case of unlisted companies.
     14.2 OTHER PLAYERS 
             14.2.1 3A ANTIOXIDANTS
                       TABLE 319 3A ANTIOXIDANTS: BUSINESS OVERVIEW
                       TABLE 320 3A ANTIOXIDANTS: PRODUCT OFFERINGS
             14.2.2 YASHO INDUSTRIES
                       TABLE 321 YASHO INDUSTRIES: BUSINESS OVERVIEW
                       TABLE 322 YASHO INDUSTRIES.: PRODUCT OFFERINGS
             14.2.3 FOODCHEM INTERNATIONAL CORPORATION
                       TABLE 323 FOODCHEM INTERNATIONAL CORPORATION: BUSINESS OVERVIEW
                       TABLE 324 FOODCHEM INTERNATIONAL CORPORATION: PRODUCT OFFERINGS
             14.2.4 OXIRIS CHEMICALS S.A.
                       TABLE 325 OXIRIS CHEMICALS S.A.: BUSINESS OVERVIEW
                       TABLE 326 OXIRIS CHEMICALS S.A.: PRODUCT OFFERINGS
             14.2.5 PHARMORGANA GMBH
                       TABLE 327 PHARMORGANA GMBH: BUSINESS OVERVIEW
                       TABLE 328 PHARMORGANA GMBH.: PRODUCT OFFERINGS
             14.2.6 NATUREX
                       TABLE 329 NATUREX: BUSINESS OVERVIEW
             14.2.7 GUANGZHOU ZIO CHEMICAL CO. LTD
                       TABLE 330 GUANGZHOU ZIO CHEMICAL CO. LTD: BUSINESS OVERVIEW
             14.2.8 L&P FOOD INGREDIENT CO., LTD
                       TABLE 331 L&P FOOD INGREDIENT CO., LTD: BUSINESS OVERVIEW
             14.2.9 HANGZHOU BETTER CHEMTECH LTD
                       TABLE 332 HANGZHOU BETTER CHEMTECH LTD: BUSINESS OVERVIEW
             14.2.10 TRIGON ANTIOXIDANTS PVT. LTD.
                       TABLE 333 TRIGON ANTIOXIDANTS PVT. LTD.
 
15 ADJACENT & RELATED MARKETS (Page No. - 333)
     15.1 INTRODUCTION 
     15.2 FOOD FORTIFYING AGENTS MARKET 
             15.2.1 LIMITATIONS
             15.2.2 MARKET DEFINITION
             15.2.3 MARKET OVERVIEW
             15.2.4 FOOD FORTIFYING AGENTS MARKET, BY TYPE
                       TABLE 334 FOOD FORTIFYING AGENTS MARKET, BY TYPE, 2019–2027 (USD MILLION)
             15.2.5 FOOD FORTIFYING AGENTS MARKET, BY REGION
                       TABLE 335 FOOD FORTIFYING AGENTS MARKET, BY REGION, 2019–2027 (USD MILLION)
     15.3 FOOD PRESERVATIVES MARKET 
             15.3.1 LIMITATIONS
             15.3.2 MARKET DEFINITION
             15.3.3 MARKET OVERVIEW
             15.3.4 FOOD PRESERVATIVES MARKET, BY TYPE
                       TABLE 336 FOOD PRESERVATIVES MARKET, BY TYPE, 2019–2022 (USD MILLION)
                       TABLE 337 FOOD PRESERVATIVES MARKET, BY TYPE, 2023–2028 (USD MILLION)
             15.3.5 FOOD PRESERVATIVES MARKET, BY REGION
                       TABLE 338 FOOD PRESERVATIVES MARKET, BY REGION, 2019–2022 (USD MILLION)
                       TABLE 339 FOOD PRESERVATIVES MARKET, BY REGION, 2023–2028 (USD MILLION)
 
16 APPENDIX (Page No. - 339)
     16.1 DISCUSSION GUIDE 
     16.2 KNOWLEDGESTORE: MARKETSANDMARKETS’ SUBSCRIPTION PORTAL 
     16.3 CUSTOMIZATION OPTIONS 
     16.4 RELATED REPORTS 
     16.5 AUTHOR DETAILS 

This research study involved the extensive use of secondary sources—directories and databases such as Bloomberg Businessweek and Factiva—to identify and collect information useful for a technical, market-oriented, and commercial study of the food antioxidants market. In-depth interviews were conducted with various primary respondents—such as key industry participants, subject matter experts (SMEs), C-level executives of key market players, and industry consultants—to obtain and verify critical qualitative and quantitative information as well as to assess prospects.

Secondary Research

The secondary sources referred for this research study include government sources, EU Commission, European Food Safety Authority, German Federal Institute of Risk Assessment, Food Safety and Standards Authority of India (FSSAI), and Japanese Ministry of Health, Labor and Welfare have been referred to, to identify and collect information for this study. The secondary sources also included food antioxidants annual reports, press releases & investor presentations of companies, white papers, food journals, certified publications, articles from recognized authors, gold & silver standard websites, regulatory bodies, trade directories, and paid databases.

Secondary research was used to obtain key information about the industry’s supply chain, the total pool of key players, and market classification and segmentation according to industry trends to the bottom-most level, regional markets, and key developments from both market and technology-oriented perspectives. The secondary data was collected and analyzed to arrive at the overall market size, which was further validated by primary research. It was also used to obtain information on the key developments from a market-oriented perspective.

Primary Research

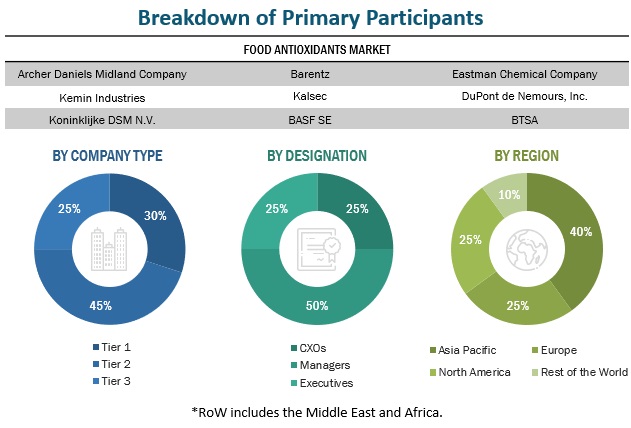
The Food Antioxidants market comprises of multiple stakeholders, including raw material suppliers, processed food suppliers, and regulatory organizations in the supply chain. Various primary sources from the supply and demand sides of the market were interviewed to obtain qualitative and quantitative information. Primary interviewees from the supply side include research institutions involved in R&D to introduce to the manufacturers, and importers & exporters of food antioxidants from the demand side include distributors, wholesalers, and key opinion leaders through questionnaires, emails, and telephonic interviews.
Food Antioxidants Market Size, and Share

To know about the assumptions considered for the study, download the pdf brochure

Market Size Estimation

The following approaches represent the overall market size estimation process employed for the purpose of this study.

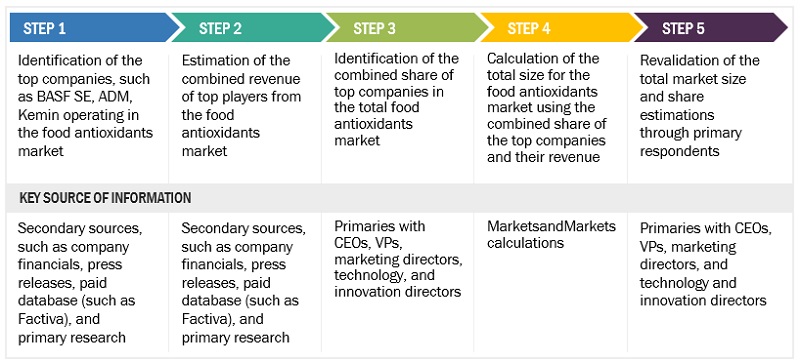
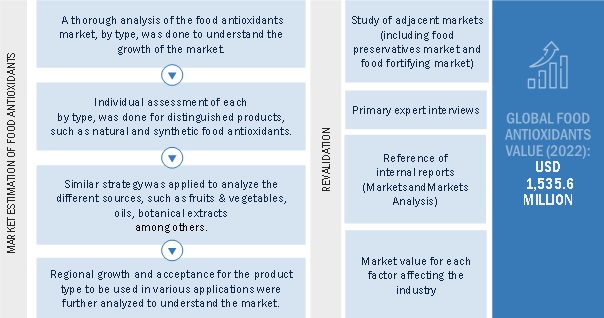
Both top-down and bottom-up approaches were used to estimate and validate the total size of the market. These approaches were also used extensively to estimate the size of various dependent submarkets. The research methodology used to estimate the market size includes the following:

Top-down approach:

  • The key players in the industry and the market were identified through extensive secondary research.
  • The revenues of major food antioxidants manufacturers were determined through primary and secondary research, such as paid databases, which were used as the basis for market estimation.
  • Based on the market share analysis of key industry players from all regions, the final market size of the food antioxidants market has been arrived at.

food antioxidants market size estimation, BY type (supply side)

Food Antioxidants Market Size, and Share

Bottom-up approach:

  • Based on the share of food antioxidants for each application at regional and country levels, the market sizes were analyzed. Thus, with a bottom-up approach to the application at the country level, the global market for food antioxidants was estimated.
  • Based on the demand for applications, offerings of key players, and the region-wise market share of major players, the global market for applications was estimated.
  • Other factors considered include the penetration rate of food antioxidants, are the demand for health & wellness products, growth in immunity concerts, consumer awareness, functional trends, the adoption rate, patents registered, and organic & inorganic growth attempts.
  • From this, market sizes for each region were derived.
  • All percentage shares, splits, and breakdowns were determined using secondary sources and verified through primary sources.
  • All macroeconomic and microeconomic factors affecting the growth of the food antioxidants market were considered while estimating the market size.
  • All parameters that affect the market covered in this research study were accounted for, viewed in extensive detail, verified through primary research, and analyzed to obtain final quantitative and qualitative data.

Food Antioxidants Market Size Estimation (Demand Side)
Food Antioxidants Market Size, and Share

The following sections (bottom-up & top-down) (supply-demand) depict the overall market size estimation process employed for this study.

Data Triangulation

After arriving at the global market size from the estimation process explained above, the total market was split into various segments and subsegments. The data triangulation and market breakdown procedures were employed, wherever applicable, to estimate the food antioxidants market and arrive at the exact statistics for all segments and subsegments. The data was triangulated by studying a range of factors and trends from the demand and supply sides. Additionally, the market size was validated using both the top-down and bottom-up approaches.

Market Definition

Antioxidants in food can be either natural or artificial. Natural food antioxidants, which come from organic sources, have inherent antioxidant properties, in contrast to synthetic antioxidants, which come from petroleum-based sources. Fruits and vegetables (such as prunes, blueberries, raspberries, cabbage, spinach, apples, eggplant, and broccoli) oils (such as corn, almond, and soy), nuts and seeds (such as mustard), spices and herbs (such as oregano, clove, and cinnamon), petroleum-based products, and gallic acid all contain antioxidants.

Stakeholders

  • Government, research organizations, and regulatory authorities
  • Research professionals
  • Tier 1 system dealers and food antioxidants suppliers
  • Food antioxidant associations and industrial bodies
  • Raw material suppliers and distributors
  • Food antioxidant traders, distributors, and dealers
  • Food antioxidant manufacturers
  • Dairy co-operative societies and meat processors
  • Regulatory bodies, including government agencies and NGOs
    • European Food Safety Authority (EFSA)
    • World Health Organization (WHO)
    • Food and Drug Administration (FDA)
    • Food Standard Agency (FSA)
  • Associations and government agencies

Report Objectives

Market Intelligence

  • Determining and projecting the size of the food antioxidants market, with respect to type, source, application, form, and regions over a five-year period, ranging from 2023 to 2028
  • Identifying the attractive opportunities in the market by determining the largest and fastest-growing segments across regions
  • Providing detailed information about the key factors influencing the growth of the market (drivers, restraints, opportunities, and industry-specific challenges)
  • Providing the regulatory framework for significant countries related to the food antioxidants market
  • Analyzing the micro markets, with respect to individual growth trends, prospects, and their contribution to the total market
  • Impact of macro- and micro-economic factors on the market
  • Shift in demand patterns across different subsegments and regions

Competitive Intelligence

  • Identifying and profiling the key players in the global food antioxidants market
  • Providing a comparative analysis of market leaders on the basis of the following:
  • Product offerings
  • Business strategies
  • Strengths and weaknesses
  • Key financials
  • Understanding the competitive landscape and identifying the major growth strategies adopted by players across the key regions
  • Analyzing the value chain and products across the key regions and their impact on the prominent market players
  • Providing insights on key product innovations and investments in the global food antioxidants market.

Available Customizations:

With the given market data, MarketsandMarkets offers customizations according to company-specific scientific needs.

The following customization options are available for the report:

Product Analysis

  • Product Matrix, which gives a detailed comparison of the product portfolio of each company

Geographic Analysis

With the given market data, MarketsandMarkets offers customizations according to the company-specific scientific needs.

  • Further breakdown of the Rest of Europe market for Food Antioxidants into the Poland, Netherlands, Denmark, Belgium, Switzerland, Sweden, Greece, and other EU and non-EU countries.
  • Further breakdown of the Rest of South America market for Food Antioxidants into Colombia, Peru, Paraguay, Chile, and Venezuela
  • Further breakdown of the Rest of Asia Pacific for Food Antioxidants into the Malaysia, Singapore, Philippines, Vietnam, South Korea, and other ASEAN countries.

Company Information

  • Detailed analyses and profiling of additional market players (up to five)
Custom Market Research Services

We will customize the research for you, in case the report listed above does not meet with your exact requirements. Our custom research will comprehensively cover the business information you require to help you arrive at strategic and profitable business decisions.

Request Customization

Instant Answers with GPT - Ask Now!

Ask real questions. Get complete answers !
Report Code
FB 4880
Published ON
May, 2023
Choose License Type
BUY NOW
  • SHARE
X
Request Customization
Speak to Analyst
Speak to Analyst
OR FACE-TO-FACE MEETING
PERSONALIZE THIS RESEARCH
  • Triangulate with your Own Data
  • Get Data as per your Format and Definition
  • Gain a Deeper Dive on a Specific Application, Geography, Customer or Competitor
  • Any level of Personalization
REQUEST A FREE CUSTOMIZATION
LET US HELP YOU!
  • What are the Known and Unknown Adjacencies Impacting the Food Antioxidants Market
  • What will your New Revenue Sources be?
  • Who will be your Top Customer; what will make them switch?
  • Defend your Market Share or Win Competitors
  • Get a Scorecard for Target Partners
CUSTOMIZED WORKSHOP REQUEST
+1-888-600-6441
  • Call Us
  • +1-888-600-6441 (Corporate office hours)
  • +1-888-600-6441 (US/Can toll free)
  • +44-800-368-9399 (UK office hours)
CONNECT WITH US
ABOUT TRUST ONLINE
©2024 MarketsandMarkets Research Private Ltd. All rights reserved
DMCA.com Protection Status Website Feedback