Sucrose Esters Market by Application (Food, Personal Care Products, Detergents & Cleaners), Form (Powder, Liquid, Pellet), and Region (North America, Europe, Asia Pacific, South America, Rest of the World) - Global Forecast to 2025


[190 Pages Report] The global sucrose esters market size is projected to grow from USD 76 million in 2019 to USD 106 million by 2025, recording a compound annual growth rate (CAGR) of 5.7% during the forecast period. The major opportunities driving the growth of the sucrose esters market include the shifting consumer trend towards dairy alternatives and production of sustainable green eco-friendly surfactant products.

To know about the assumptions considered for the study, Request for Free Sample Report
By Application, the food segment is estimated to account for the largest share in 2019 in the sucrose esters market.
The food segment is estimated to dominate the sucrose esters market, on the basis of application, in terms of value, in 2019. Sucrose esters are witnessing a surge in applications, such as bakery products, confectioneries, cereals, dairy products, meat products, and soups & sauces. They are often used as a low-fat alternative to maximize the mouthfeel provided by fats. Besides emulsification, sucrose esters have functions, such as aeration, texturizing, protein protection, and sugar crystallization, thereby increasing their consumption in the food industry. The high-water solubility and hydrophilic-lipophilic balance (HLB) value characteristics of sucrose esters have gained the attention of major manufacturers, such as BASF (Germany), Croda International (UK), and Evonik Industries (Germany), which are focusing on catering to the demands for food ingredients in the sucrose esters market.
The cosmetics subsegment in the personal care products segment is projected to account for the largest share during the forecast period.
The usage of sucrose esters is on the rise in cosmetic products, as the usage of sucrose esters helps in maintaining high-quality standards with ethylene oxide-free products, which are toxic to the human skin. The sucrose esters used in the personal care products act as emulsifiers providing mildness to the skin and eyes. The edible property and neutral odor and taste encourage the usage of sucrose esters in the cosmetic subsegment in the market. These factors are projected to drive the demand for sucrose esters in the cosmetic industry. Sucrose esters are also used as a soothing agent in the cleansing creams. Furthermore, sucrose esters can provide more gloss to lipstick and improve the creaminess. Such properties are projected to drive the demand for sucrose esters in cosmetic products.
The powder segment in the sucrose esters market is projected to dominate the market in 2019.
The powder segment is estimated to dominate the sucrose esters market in 2019. Food is the largest market for the powdered form of sucrose esters, followed by other applications. The consumption of the powdered form of sucrose esters is largely influenced by its properties to mix uniformly with other ingredients during the processing stage.

To know about the assumptions considered for the study, download the pdf brochure
Europe is projected to account for the largest share in the sucrose esters market during the forecast period.
The European market is projected to account for the largest share in 2025. The dominance of the market in this region is attributed to factors, such as the large-scale production and consumption of bakery, dairy, and confectionery products in the region, which is encouraged by food & beverage manufacturers that focus on product innovations through using novel food ingredients. Companies such as BASF (Germany), Evonik Industries (Germany), and Sisterna (Netherlands) are the key players operating in this market and focus on catering to the demands for sucrose esters in Europe. The rising awareness among consumers has led to the increased inclination of manufacturers to comply with the standards introduced by the EU, thereby encouraging the growth of the sucrose esters market in Europe.
Key Market Players
Key vendors in the global sucrose esters market include BASF (Germany), Evonik Industries (Germany), P&G Chemicals (US), Croda International (UK), Mitsubishi Chemicals (Japan), Sisterna (Netherlands), Stearinerie Dubois (France), Dai-Ichi Kogyo Seiyaku (Japan), Alfa Chemicals (UK), FELDA IFFCO (US), World Chem Industries (India), Compass Foods (Singapore), and Zhejiang Synose Tech (China). These players have broad industry coverage and high operational and financial strength.
Scope of the report
|
Report Metric |
Details |
|
Market size available for years |
2017�2025 |
|
Base year considered |
2018 |
|
Forecast period |
2019�2025 |
|
Forecast units |
Value (USD Million and USD Thousand) and Volume (Tons) |
|
Segments covered |
Application, Form, Function, and Region |
|
Geographies covered |
North America, Europe, Asia Pacific, South America, and RoW |
|
Companies covered |
BASF (Germany), Evonik Industries (Germany), P&G Chemicals (US), Croda International (UK), Mitsubishi Chemicals (Japan), Sisterna (Netherlands), Stearinerie Dubois (France), Dai-Ichi Kogyo Seiyaku (Japan), Alfa Chemicals (UK), FELDA IFFCO (US), World Chem Industries (India), and Compass Foods (Singapore). |
This research report categorizes the market based on application, form, function, and region.
Based on application, the market for sucrose esters has been segmented as follows:
- Food
- Dairy products
- Confectioneries
- Bakery products
- Beverages
- Soups & sauces
- Meat products
- Cereals
- Other types (dips, spreads, and toppings)
- Personal care products
- Cosmetics
- Other types (hair and body care products)
- Detergents & cleansers
- Other applications (pharmaceuticals and agrochemicals)
Based on form, the market for sucrose esters has been segmented as follows:
- Powder
- Liquid
- Pellet
Based on the function (qualitative), the market for sucrose esters has been segmented as follows:
- Protein & starch interaction
- Antimicrobial property
- Controlled sugar crystallization
- Emulsification
- Aeration
Based on the region, the market for sucrose esters has been segmented as follows:
- North America
- Europe
- Asia Pacific
- South America
- RoW (the Middle East and Africa)
Recent Developments:
- In October 2019, Evonik Industries (Germany) launched Tego SP 13 Sun Up in its sucrose esters product portfolio, �Tego,� by incorporating sun protection, which is water-resistant in nature and can withstand sweating from physical exercise including water sports.
- In July 2019, Croda International (UK) launched a new ISO 16128 data online, which will help its consumers to search easily for organic and natural ingredients in cosmetic formulations.
- In April 2019, Croda International (UK) started expanding its personal care business by opening texture and sensory laboratories in France and Singapore. The expansion would help the company improve its industrial performance while maintaining its social and ethical values.
- In January 2019, BASF (Germany) launched Emulgade Sucro Plus, a skincare product that contains organic and natural ingredients. This helped the company offer eco-friendly ingredients for environmentally conscious consumers.
Key questions addressed by the report:
- Who are the major market players in the sucrose esters market?
- What are the regional growth trends and the largest revenue-generating regions for the sucrose esters market?
- What are the key regions and industries that are projected to witness significant growth in the sucrose esters market?
- What are the major applications of sucrose esters that are projected to account for a major revenue share during the forecast period?
- In which major forms are sucrose esters majorly used, and which form is projected to dominate during the forecast period?
To speak to our analyst for a discussion on the above findings, click Speak to Analyst
 Exclusive indicates content/data unique to MarketsandMarkets and not available with any competitors.
Table of Contents
1 Introduction (Page No. - 20)
1.1 Objectives of the Study
1.2 Market Definition
1.3 Market Segmentation
1.4 Regions Covered
1.5 Periodization Considered for the Study
1.6 Currency Considered
1.7 Volume Unit Considered
1.8 Stakeholders
2 Research Methodology (Page No. - 25)
2.1 Research Data
2.2 Market Size Estimation
2.2.1 Approach One (Based on Application, By Region)
2.2.2 Approach Two (Based on Global Market)
2.3 Data Triangulation
2.4 Assumptions for the Study
2.5 Limitations of the Study
3 Executive Summary (Page No. - 32)
4 Premium Insights (Page No. - 37)
4.1 Attractive Opportunities in the Market
4.2 Market for Sucrose Esters: Major Regional Submarkets
4.3 Asia Pacific: Sucrose Esters Market, By Application & Key Country
4.4 Sucrose Esters Market, By Application & Region
4.5 Market in Food, By Type
4.6 Market in Personal Care Products, By Type
5 Market Overview (Page No. - 43)
5.1 Introduction
5.2 Market Dynamics
5.2.1 Drivers
5.2.1.1 Multifunctional Properties of Sucrose Esters
5.2.1.2 Increase in Trends for Consuming Convenience Foods in the Developing Nations
5.2.2 Restraints
5.2.2.1 Cost of Reactants During the Formulation Process
5.2.3 Opportunities
5.2.3.1 Consumer Shift Toward Dairy Alternatives
5.2.3.2 Production of Sustainable Green Eco-Friendly Surfactant Products
5.2.4 Challenges
5.2.4.1 Competition From Substitutes Such as Lecithin, Sorbitan Esters, and Monoglycerides
5.2.4.2 Criticalities in the Manufacturing Process of Sucrose Esters
5.3 Value Chain
5.4 Yc Shift
5.5 Regulatory Framework
5.5.1 Introduction
5.5.2 North America
5.5.3 Europe
6 Sucrose Ester Market, By Application (Page No. - 53)
6.1 Introduction
6.2 Food
6.2.1 Bakery Products
6.2.1.1 Sucrose Esters Act as an Alternative Source to Eggs in Baking
6.2.2 Confectioneries
6.2.2.1 Sucrose Esters Improve Emulsification of Molten Sugar and Oil in Confectioneries, Making Them Less Adhesive on Consumption
6.2.3 Dairy Products
6.2.3.1 Sucrose Esters are Used to Improve the Flavor Releases in Dairy Products
6.2.4 Cereals
6.2.4.1 They Help to Obtain the Tenderness and Desirable Structure of Breakfast Cereals
6.2.5 Soups & Sauces
6.2.5.1 Various Functional Benefits Such as Emulsification, Stabilization, and Dispersion Increase Their Demand in Soups & Sauces
6.2.6 Beverages
6.2.6.1 They Find Higher Usage in Fruit-Flavored Beverages and Soft Drinks
6.2.7 Meat Products
6.2.7.1 Sucrose Esters Improve the Tenderness and Avoid Dehydration, Shrinkage, and Oil Loss in Sausages, Hams, and Canned Meat Products
6.2.8 Other Types
6.2.8.1 Sucrose Esters are Used Increasingly Across Many Food Types Owing to Their Functional Benefits
6.3 Personal Care Products
6.3.1 Cosmetics
6.3.1.1 Their Neutral Odor and Taste Encourage the Usage of Sucrose Esters
6.3.2 Other Types
6.3.2.1 Sucrose Esters Act as A Natural Emulsifier in Body Lotions, Shampoos, and Conditioners
6.4 Detergents & Cleansers
6.4.1 Growth in Popularity of Sucrose Esters Among Manufacturers has Led to the Rise in Demand for Sucrose Esters in Detergents and Cleaning Products
6.5 Other Applications
6.5.1 Sucrose Esters Improve the Fluidity of the Chemical Powders
7 Market for Sucrose Esters, By Form (Page No. - 72)
7.1 Introduction
7.2 Powder
7.2.1 Powdered Sucrose Esters are Largely Used in Food Applications
7.3 Liquid
7.3.1 Liquid Esters are Widely Used in Dairy-Based Deserts for Better Emulsification and Stabilization of Fat Globules
7.4 Pellet
7.4.1 The Pellet Form of Sucrose Esters is Preferred in Personal Care Products
8 Market for Sucrose Esters, By Function (Page No. - 76)
8.1 Introduction
8.2 Protein & Starch Interaction
8.3 Antimicrobial Property
8.4 Controlled Sugar Crystallization
8.5 Emulsification
8.6 Aeration
9 Market for Sucrose Esters, By Region (Page No. - 78)
9.1 Introduction
9.2 North America
9.2.1 US
9.2.1.1 Increase in Demand for Natural Ingredients to Drive the Growth of the Food and Personal Care Products Segment in the US Sucrose Esters Market
9.2.2 Canada
9.2.2.1 The Regulations Introduced in Canada to Gain Momentum in this Market
9.2.3 Mexico
9.2.3.1 Increase in Demand in the US for Mexican Dairy Products to Create Growth Opportunities for Sucrose Ester Manufacturers
9.3 Europe
9.3.1 Germany
9.3.1.1 Growing Awareness Among Manufacturers Fuels the Market for Sucrose Esters in the Country
9.3.2 Italy
9.3.2.1 High Functional Benefits of Sucrose Esters to Boost the Market in the Country
9.3.3 UK
9.3.3.1 Bakery and Dairy Sectors are Expected to Fuel the Growth of this Market in the UK
9.3.4 France
9.3.4.1 High Purchasing Power Among the French Leads to High Quality Standards
9.3.5 Spain
9.3.5.1 The Functional Benefits of Sucrose Esters in Spanish Cuisines Drive the Market Growth
9.3.6 Netherlands
9.3.6.1 The Growth of the Bakery Industry is Attributed to the Demand for Sucrose Esters in the Country
9.3.7 Rest of Europe
9.3.7.1 Modernization in the Region is Projected to Fuel the Market Growth During the Forecast Period
9.4 Asia Pacific
9.4.1 China
9.4.1.1 Growing Awareness About Sucrose Esters Boosts the Production Among Chinese Manufacturers
9.4.2 Japan
9.4.2.1 Changes in Lifestyles to Boost the Demand for Sucrose Esters
9.4.3 India
9.4.3.1 The Benefits of Sucrose Esters in the Food and Agrochemical Industries Fuel the Market Growth in the Country
9.4.4 Rest of Asia Pacific
9.5 South America
9.5.1 Brazil
9.5.1.1 Easy Availability of Raw Materials to Multinational Players in the Country
9.5.2 Colombia
9.5.2.1 Rise in the Number of Health-Conscious Consumers in the Country to Drive the Demand for Sucrose Esters
9.5.3 Rest of South America
9.6 Rest of the World (RoW)
9.6.1 Middle East
9.6.1.1 Changing Lifestyle in the Middle East Impacts the Consumption Patterns, Which Led A Boost for Sucrose Esters
9.6.2 Africa
9.6.2.1 Global Demand for Sucrose Esters Boosts the Market in Africa
10 Competitive Landscape (Page No. - 150)
10.1 Introduction
10.2 Competitive Leadership Mapping
10.2.1 Visionary Leaders
10.2.2 Dynamic Differentiators
10.2.3 Innovators
10.2.4 Emerging Companies
10.3 Start-Up Microquadrants
10.3.1 Progressive Companies
10.3.2 Starting Blocks
10.3.3 Responsive Companies
10.3.4 Dynamic Companies
10.4 Competitive Scenario
10.4.1 New Product Launches
10.4.2 Expansions
11 Company Profiles (Page No. - 156)
(Business Overview, Products Offered, Recent Developments, SWOT Analysis, MnM View)*
11.1 BASF
11.2 Evonik Industries
11.3 P&G Chemicals
11.4 Croda International
11.5 Mitsubishi Chemical Holdings Corporation
11.6 Sisterna
11.7 Alfa Chemicals
11.8 Dai-Ichi Kogyo Seiyaku
11.9 FELDA IFFCO
11.10 World Chem Industries
11.11 Compass Foods
11.12 Stearinerie Dubois
11.13 Zhejiang Synose Tech
11.14 Guangxi Gaotong Food Technology
11.15 Sinerga
11.16 Guanzhou Zio Chemical
11.17 Adana Food Tech
11.18 Alchemy Ingredients
11.19 B Joshi Agrochem Pharma
11.20 Alfa Aesar
*Details on Business Overview, Products Offered, Recent Developments, SWOT Analysis, MnM View Might Not Be Captured in Case of Unlisted Companies.
12 Appendix (Page No. - 182)
12.1 Discussion Guide
12.2 Knowledge Store: Marketsandmarkets� Subscription Portal
12.3 Available Customizations
12.4 Related Reports
12.5 Author Details
List of Tables (182 Tables)
Table 1 USD Exchange Rates Considered, 2016�2018
Table 2 Market Snapshot, 2019 vs. 2025
Table 3 Production of Oil Palm Fruit, By Country/Region (Tonne)
Table 4 Maximum Use of Sucrose Esters in Food & Beverages
Table 5 Maximum Permitted Limits of Sucrose Esters of Fatty Acids (E 473 and E 473�474) in Foods According to the Annex Ii to Regulation (Ec) No 1333/2008
Table 6 Market Size, By Application, 2017�2025 (USD Million)
Table 7 Market for Sucrose Esters Size, By Application, 2017�2025 (Ton)
Table 8 Market for Sucrose Esters Size in Food, By Type, 2017�2025 (USD Thousand)
Table 9 Market for Sucrose Esters Size in Food, By Type, 2017�2025 (Ton)
Table 10 Market for Sucrose Esters Size in Food, By Region, 2017�2025 (USD Million)
Table 11 Market for Sucrose Esters Size in Food, By Region, 2017�2025 (Ton)
Table 12 Market for Sucrose Esters Size in Bakery Products, By Region, 2017�2025 (USD Thousand)
Table 13 Market for Sucrose Esters Size in Bakery Products, By Region, 2017�2025 (Ton)
Table 14 Sucrose Esters Market Size in Confectioneries, By Region, 2017�2025 (USD Thousand)
Table 15 Market Size in Confectioneries, By Region, 2017�2025 (Ton)
Table 16 Market Size in Dairy Products, By Region, 2017�2025 (USD Thousand)
Table 17 Market Size in Dairy Products, By Region, 2017�2025 (Ton)
Table 18 Market Size in Cereals, By Region, 2017�2025 (USD Thousand)
Table 19 Market Size in Cereals, By Region, 2017�2025 (Ton)
Table 20 Market for Sucrose Esters Size in Soups & Sauces, By Region, 2017�2025 (USD Thousand)
Table 21 Market for Sucrose Esters Size in Soups & Sauces, By Region, 2017�2025 (Ton)
Table 22 Sucrose Esters Market Size in Beverages, By Region, 2017�2025 (USD Thousand)
Table 23 Market Size in Beverages, By Region, 2017�2025 (Ton)
Table 24 Market for Sucrose Esters Size in Meat Products, By Region, 2017�2025 (USD Thousand)
Table 25 Market Size in Meat Products, By Region, 2017�2025 (Ton)
Table 26 Market Size in Other Types, By Region, 2017�2025 (USD Thousand)
Table 27 Market for Sucrose Esters Size in Other Types, By Region, 2017�2025 (Ton)
Table 28 Market Size in Personal Care Products, By Type, 2017�2025 (USD Thousand)
Table 29 Market Size in Personal Care Products, By Type, 2017�2025 (Ton)
Table 30 Market for Sucrose Esters Size in Personal Care Products, By Region, 2017�2025 (USD Million)
Table 31 Market Size in Personal Care Products, By Region, 2017�2025 (Ton)
Table 32 Market Size in Cosmetics, By Region, 2017�2025 (USD Thousand)
Table 33 Market for Sucrose Esters Size in Cosmetics, By Region, 2017�2025 (Ton)
Table 34 Market Size in Other Personal Care Products, By Region, 2017�2025 (USD Thousand)
Table 35 Market Size in Other Personal Care Products, By Region, 2017�2025 (Ton)
Table 36 Sucrose Esters Market Size in Detergents & Cleansers, By Region, 2017�2025 (USD Million)
Table 37 Market Size in Detergents & Cleansers, By Region, 2017�2025 (Ton)
Table 38 Market for Sucrose Esters Size in Other Applications, By Region, 2017�2025 (USD Million)
Table 39 Market Size in Other Applications, By Region, 2017�2025 (Ton)
Table 40 Market Size, By Form, 2017�2025 (USD Million)
Table 41 Powdered Market for Sucrose Esters Size, By Region, 2017�2025 (USD Thousand)
Table 42 Liquid Market for Sucrose Esters Size, By Region, 2017�2025 (USD Thousand)
Table 43 Pelleted Market for Sucrose Esters Size, By Region, 2017�2025 (USD Thousand)
Table 44 Market for Sucrose Esters Size, By Region, 2017�2025 (USD Million)
Table 45 Market for Sucrose Esters Size, By Region, 2017�2025 (Ton)
Table 46 North America: Market Size For Sucrose Esters, By Country, 2017�2025 (USD Million)
Table 47 North America: Market for Sucrose Esters Size, By Country, 2017�2025 (Ton)
Table 48 North America: By Market Size, By Application, 2017�2025 (USD Million)
Table 49 North America: By Market Size, By Application, 2017�2025 (Ton)
Table 50 North America: By Market Size in Food, By Type, 2017�2025 (USD Thousand)
Table 51 North America: By Market Size in Food, By Type, 2017�2025 (Ton)
Table 52 North America: By Market Size in Personal Care Products, By Type, 2017�2025 (USD Thousand)
Table 53 North America: By Market Size in Personal Care Products, By Type, 2017�2025 (Ton)
Table 54 US: Market Size For Sucrose Esters, By Application, 2017�2025 (USD Million)
Table 55 US: By Market Size in Food, By Type, 2017�2025 (USD Thousand)
Table 56 US: By Market Size in Food, By Type, 2017�2025 (Ton)
Table 57 US: By Market Size in Personal Care Products, By Type, 2017�2025 (USD Thousand)
Table 58 US: By Market Size in Personal Care Products, By Type, 2017�2025 (Ton)
Table 59 Canada: Sucrose Esters Market Size, By Application, 2017�2025 (USD Million)
Table 60 Canada: By Market Size in Food, By Type, 2017�2025 (USD Thousand)
Table 61 Canada: By Market Size in Food, By Type, 2017�2025 (Ton)
Table 62 Canada: By Market Size in Personal Care Products, By Type, 2017�2025 (USD Thousand)
Table 63 Canada: Market Size in Personal Care Products, By Type, 2017�2025 (Ton)
Table 64 Mexico: Sucrose Esters Market Size, By Application, 2017�2025 (USD Million)
Table 65 Mexico: By Market Size in Food, By Type, 2017�2025 (USD Thousand)
Table 66 Mexico: Market Size in Food, By Type, 2017�2025 (Ton)
Table 67 Mexico: By Market Size in Personal Care Products, By Type, 2017�2025 (USD Thousand)
Table 68 Mexico: Market Size in Personal Care Products, By Type, 2017�2025 (Ton)
Table 69 Europe: Sucrose Esters Market Size, By Country, 2017�2025 (USD Million)
Table 70 Europe: By Market Size, By Country, 2017�2025 (Ton)
Table 71 Europe: Market Size, By Application, 2017�2025 (USD Million)
Table 72 Europe: Sucrose Esters Market Size, By Application, 2017�2025 (Ton)
Table 73 Europe: By Market Size in Food, By Type, 2017�2025 (USD Thousand)
Table 74 Europe: By Market Size in Food, By Type, 2017�2025 (Ton)
Table 75 Europe: Market Size in Personal Care Products, By Type, 2017�2025 (USD Thousand)
Table 76 Europe: Market Size in Personal Care Products, By Type, 2017�2025 (Ton)
Table 77 Germany: Sucrose Esters Market Size, By Application, 2017�2025 (USD Million)
Table 78 Germany: Market Size in Food, By Type, 2017�2025 (USD Thousand)
Table 79 Germany: By Market Size in Food, By Type, 2017�2025 (Ton)
Table 80 Germany: By Market Size in Personal Care Products, By Type, 2017�2025 (USD Thousand)
Table 81 Germany: Sucrose Esters Market Size in Personal Care Products, By Type, 2017�2025 (Ton)
Table 82 Italy: Market Size For Sucrose Esters, By Application, 2017�2025 (USD Million)
Table 83 Italy: Market Size in Food, By Type, 2017�2025 (USD Thousand)
Table 84 Italy: By Market Size in Food, By Type, 2017�2025 (Ton)
Table 85 Italy: Market Size in Personal Care Products, By Type, 2017�2025 (USD Thousand)
Table 86 Italy: Market Size in Personal Care Products, By Type, 2017�2025 (Ton)
Table 87 UK: Sucrose Esters Market Size, By Application, 2017�2025 (USD Million)
Table 88 UK: By Market Size in Food, By Type, 2017�2025 (USD Thousand)
Table 89 UK: Market Size in Food, By Type, 2017�2025 (Ton)
Table 90 UK: Market Size in Personal Care Products, By Type, 2017�2025 (USD Thousand)
Table 91 UK: By Market Size in Personal Care Products, By Type, 2017�2025 (Ton)
Table 92 France: Sucrose Esters Market Size, By Application, 2017�2025 (USD Million)
Table 93 France: Market Size in Food, By Type, 2017�2025 (USD Thousand)
Table 94 France: Market Size in Food, By Type, 2017�2025 (Ton)
Table 95 France: By Market Size in Personal Care Products, By Type, 2017�2025 (USD Thousand)
Table 96 France: Market Size in Personal Care Products, By Type, 2017�2025 (Ton)
Table 97 Spain: Market Size, By Application, 2017�2025 (USD Million)
Table 98 Spain: Market Size in Food, By Type, 2017�2025 (USD Thousand)
Table 99 Spain: By Market Size in Food, By Type, 2017�2025 (Ton)
Table 100 Spain: Market Size in Personal Care Products, By Type, 2017�2025 (USD Thousand)
Table 101 Spain: Market Size in Personal Care Products, By Type, 2017�2025 (Ton)
Table 102 Netherlands: By Market Size, By Application, 2017�2025 (USD Million)
Table 103 Netherlands: Sucrose Esters Market Size in Food, By Type, 2017�2025 (USD Thousand)
Table 104 Netherlands: Market Size in Food, By Type, 2017�2025 (Ton)
Table 105 Netherlands: By Market Size in Personal Care Products, By Type, 2017�2025 (USD Thousand)
Table 106 Netherlands: Market Size in Personal Care Products, By Type, 2017�2025 (Ton)
Table 107 Rest of Europe: Sucrose Esters Market Size, By Application, 2017�2025 (USD Million)
Table 108 Rest of Europe: By Market Size in Food, By Type, 2017�2025 (USD Thousand)
Table 109 Rest of Europe: Market Size in Food, By Type, 2017�2025 (Ton)
Table 110 Rest of Europe: Market Size in Personal Care Products, By Type, 2017�2025 (USD Thousand)
Table 111 Rest of Europe: By Market Size in Personal Care Products, By Type, 2017�2025 (Ton)
Table 112 Asia Pacific: Sucrose Esters Market Size, By Country, 2017�2025 (USD Million)
Table 113 Asia Pacific: Market Size, By Country, 2017�2025 (Ton)
Table 114 Asia Pacific: Market Size, By Application, 2017�2025 (USD Million)
Table 115 Asia Pacific: Market Size, By Application, 2017�2025 (Ton)
Table 116 Asia Pacific: By Market Size in Food, By Type, 2017�2025 (USD Thousand)
Table 117 Asia Pacific: Market Size in Food, By Type, 2017�2025 (Ton)
Table 118 Asia Pacific: Market Size in Personal Care Products, By Type, 2017�2025 (USD Thousand)
Table 119 Asia Pacific: Market Size in Personal Care Products, By Type, 2017�2025 (Ton)
Table 120 China: Sucrose Esters Market Size, By Application, 2017�2025 (USD Million)
Table 121 China: Market Size in Food, By Type, 2017�2025 (USD Thousand)
Table 122 China: Market Size in Food, By Type, 2017�2025 (Ton)
Table 123 China: Market Size in Personal Care Products, By Type, 2017�2025 (USD Thousand)
Table 124 China: Market Size in Personal Care Products, By Type, 2017�2025 (Ton)
Table 125 Japan: Sucrose Esters Market Size, By Application, 2017�2025 (USD Million)
Table 126 Japan: By Market Size in Food, By Type, 2017�2025 (USD Thousand)
Table 127 Japan: Market Size in Food, By Type, 2017�2025 (Ton)
Table 128 Japan: Market Size in Personal Care Products, By Type, 2017�2025 (USD Thousand)
Table 129 Japan: Market Size in Personal Care Products, By Type, 2017�2025 (Ton)
Table 130 India: By Market Size, By Application, 2017�2025 (USD Million)
Table 131 India: Sucrose Esters Market Size in Food, By Type, 2017�2025 (USD Thousand)
Table 132 India: Market Size in Food, By Type, 2017�2025 (Ton)
Table 133 India: Market Size in Personal Care Products, By Type, 2017�2025 (USD Thousand)
Table 134 India: Sucrose Esters Market Size in Personal Care Products, By Type, 2017�2025 (Ton)
Table 135 Rest of Asia Pacific: Sucrose Esters Market Size, By Application, 2017�2025 (USD Million)
Table 136 Rest of Asia Pacific: By Market Size in Food, By Type, 2017�2025 (USD Thousand)
Table 137 Rest of Asia Pacific: By Market Size in Food, By Type, 2017�2025 (Ton)
Table 138 Rest of Asia Pacific: By Market Size in Personal Care Products, By Type, 2017�2025 (USD Thousand)
Table 139 Rest of Asia Pacific: Sucrose Esters Market Size in Personal Care Products, By Type, 2017�2025 (Ton)
Table 140 South America: Sucrose Esters Market Size, By Country, 2017�2025 (USD Million)
Table 141 South America: By Market Size, By Country, 2017�2025 (Ton)
Table 142 South America: Sucrose Esters Market Size, By Application, 2017�2025 (USD Million)
Table 143 South America: By Market Size, By Application, 2017�2025 (Ton)
Table 144 South America: Market Size in Food, By Type, 2017�2025 (USD Thousand)
Table 145 South America: By Market Size in Food, By Type, 2017�2025 (Ton)
Table 146 South America: Market Size in Personal Care Products, By Type, 2017�2025 (USD Thousand)
Table 147 South America: Sucrose Esters Market Size in Personal Care Products, By Type, 2017�2025 (Ton)
Table 148 Brazil: Sucrose Esters Market Size, By Application, 2017�2025 (USD Million)
Table 149 Brazil: Market Size in Food, By Type, 2017�2025 (USD Thousand)
Table 150 Brazil: By Market Size in Food, By Type, 2017�2025 (Ton)
Table 151 Brazil: Sucrose Esters Market Size in Personal Care Products, By Type, 2017�2025 (USD Thousand)
Table 152 Brazil: Market Size in Personal Care Products, By Type, 2017�2025 (Ton)
Table 153 Colombia: Sucrose Esters Market Size, By Application, 2017�2025 (USD Million)
Table 154 Colombia: By Market Size in Food, By Type, 2017�2025 (USD Thousand)
Table 155 Colombia: Market Size in Food, By Type, 2017�2025 (Ton)
Table 156 Colombia: Sucrose Esters Market Size in Personal Care Products, By Type, 2017�2025 (USD Thousand)
Table 157 Colombia: Market Size in Personal Care Products, By Type, 2017�2025 (Ton)
Table 158 Rest of South America: Sucrose Esters Market Size, By Application, 2017�2025 (USD Million)
Table 159 Rest of South America: Market Size in Food, By Type, 2017�2025 (USD Thousand)
Table 160 Rest of South America: Market Size in Food, By Type, 2017�2025 (Ton)
Table 161 Rest of South America: Market Size in Personal Care Products, By Type, 2017�2025 (USD Thousand)
Table 162 Rest of South America: Market Size in Personal Care Products, By Type, 2017�2025 (Ton)
Table 163 RoW: Sucrose Esters Market Size, By Region, 2017�2025 (USD Million)
Table 164 RoW: Market Size, By Region, 2017�2025 (Ton)
Table 165 RoW: Market Size, By Application, 2017�2025 (USD Million)
Table 166 RoW: Market Size, By Application, 2017�2025 (Ton)
Table 167 RoW: Market Size in Food, By Type, 2017�2025 (USD Thousand)
Table 168 RoW: Market Size in Food, By Type, 2017�2025 (Ton)
Table 169 RoW: Market Size in Personal Care Products, By Type, 2017�2025 (USD Thousand)
Table 170 RoW: Market Size in Personal Care Products, By Type, 2017�2025 (Ton)
Table 171 Middle East: Sucrose Esters Market Size, By Application, 2017�2025 (USD Million)
Table 172 Middle East: By Market Size in Food, By Type, 2017�2025 (USD Thousand)
Table 173 Middle East: Market Size in Food, By Type, 2017�2025 (Ton)
Table 174 Middle East: By Market Size in Personal Care Products, By Type, 2017�2025 (USD Thousand)
Table 175 Middle East: By Market Size in Personal Care Products, By Type, 2017�2025 (Ton)
Table 176 Africa: Sucrose Esters Market Size, By Application, 2017�2025 (USD Million)
Table 177 Africa: By Market Size in Food, By Type, 2017�2025 (USD Thousand)
Table 178 Africa: Market Size in Food, By Type, 2017�2025 (Ton)
Table 179 Africa: By Market Size in Personal Care Products, By Type, 2017�2025 (USD Thousand)
Table 180 Africa: Sucrose Esters Market Size in Personal Care Products, By Type, 2017�2025 (Ton)
Table 181 New Product Launches, 2019
Table 182 Expansions, 2019
List of Figures (36 Figures)
Figure 1 Market Segmentation
Figure 2 Research Design
Figure 3 Data Triangulation Methodology
Figure 4 Key Data From Primary Sources
Figure 5 Sucrose Esters Market Size, By Application, 2019 vs. 2025 (USD Million)
Figure 6 Market Size in Food, By Type, 2019 vs. 2025 (USD Million)
Figure 7 Sucrose Esters Market Size in Personal Care Products, By Type, 2019 vs. 2025 (USD Million)
Figure 8 Market Size, By Form, 2019 vs. 2025 (USD Million)
Figure 9 Sucrose Esters Market Share (Value), By Region, 2018
Figure 10 Growing Trend of Consuming Convenience Food Products in Developing Countries to Drive the Market Growth
Figure 11 Colombia is Projected to Grow at the Highest Cagr During the Forecast Period
Figure 12 China Accounted for the Largest Share in the Asia Pacific Market in 2018
Figure 13 Europe is Projected to Dominate the Market
Figure 14 The Dairy Products Segment is Projected to Dominate the Market During the Forecast Period
Figure 15 North America to Dominates the Personal Care Segment in 2019
Figure 16 Market Dynamics
Figure 17 Sucrose Esters Market: Value Chain
Figure 18 Sucrose Esters Market Share (Value), By Application, 2019 vs. 2025
Figure 19 Sucrose Esters Market Share (Value), By Form, 2019 vs. 2025
Figure 20 Colombia to Record the Highest Growth Rate in the Market During the Forecast Period
Figure 21 Europe: Market for Sucrose Esters Snapshot
Figure 22 Asia Pacific: Market for Sucrose Esters Snapshot
Figure 23 South America: Market for Sucrose Esters Snapshot
Figure 24 Sucrose Esters Market: Competitive Leadership Mapping, 2018
Figure 25 Sucrose Esters Start-Up Market: Competitive Leadership Mapping, 2018
Figure 26 Market Share Analysis, 2018
Figure 27 BASF: Company Snapshot
Figure 28 BASF: SWOT Analysis
Figure 29 Evonik Industries: Company Snapshot
Figure 30 Evonik Industries: SWOT Analysis
Figure 31 P&G Chemicals: Company Snapshot
Figure 32 P&G Chemicals: SWOT Analysis
Figure 33 Croda International: Company Snapshot
Figure 34 Croda International: SWOT Analysis
Figure 35 Mitsubishi Chemical Holdings Corporation: Company Snapshot
Figure 36 Mitsubishi Chemical Holdings Corporation: SWOT Analysis
The study involved four major steps in estimating the size of the sucrose esters market. Exhaustive secondary research was done to collect information on the market, as well as the parent market. The next step was to validate these findings, assumptions, and sizing with industry experts across the value chain through primary research. Both the top-down and bottom-up approaches were employed to estimate the complete market size. After that, market breakdown and data triangulation were used to estimate the market size of segments and subsegments.
Secondary Research
In the secondary research process, various sources were referred to, to identify and collect information for this study. These secondary sources included reports from the Food and Agriculture Organization (FAO), World Health Organization (WHO), FoodDrinkEurope (FDE), International Chewing Gum Association (ICGA), European Food Safety Authority (EFSA), Canadian Food Inspection Agency, and Food and Drug Administration (FDA). The secondary sources also included annual reports, press releases, investor presentations of companies, white papers, certified publications, articles by recognized authors and regulatory bodies, trade directories, and databases.
Secondary research was mainly conducted to obtain key information about the industry�s supply chain, the total pool of key players, market classification & segmentation according to the industry trends to the bottom-most level and geographical markets. It was also used to obtain information about the key developments from a market-oriented perspective.
Primary Research
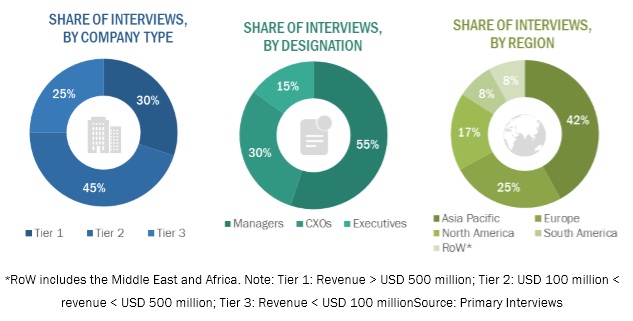
The overall sucrose esters market comprises several stakeholders in the supply chain, which include global and regional food products (dairy products, bakery products, confectioneries, soups & sauces, and meat products, among others) dealers, personal care products manufacturers, pharmaceuticals, chemicals, and agrochemicals manufacturers, as well as manufacturers of food ingredients and food additives. Primary sources from both the supply and demand sides of the market were interviewed to obtain qualitative and quantitative information. The primary interviewees from the demand side include key opinion leaders, regional food products dealers and manufacturers, and personal care products manufacturers, as well as pharmaceuticals, chemicals, and agrochemicals manufacturers. The primary sources from the supply side include manufacturers of food ingredients and food additives, cosmetics and personal care ingredient manufacturers, research institutions involved in R&D, and key opinion leaders.
To know about the assumptions considered for the study, download the pdf brochure
Market Size Estimation
Both the top-down and bottom-up approaches were used to estimate and validate the total size of the sucrose esters market. These approaches were also used extensively to estimate the size of various subsegments in the market. The research methodology used to estimate the market size includes the following details:
- The key players were identified through extensive secondary research.
- The sucrose esters market size, in terms of value, was determined through primary and secondary research.
- All percentage share splits and breakdowns were determined using secondary sources and verified through primary sources.
- All the possible parameters that affect the market covered in this research study were accounted for, viewed in extensive detail, verified through primary research, and analyzed to obtain the final quantitative and qualitative data.
Data Triangulation
After arriving at the overall market size from the estimation process explained above, the total market was split into several segments and subsegments. The data triangulation and market breakdown procedures were employed to estimate the global sucrose esters market and arrive at the exact statistics for all segments and subsegments, wherever applicable. The data was triangulated by studying various factors and trends from the demand and supply sides. Along with this, the market size was validated using both the top-down and bottom-up approaches.
Report Objectives
- Determining and projecting the size of the sucrose esters market, with respect to application, form, function, and regional markets, over a six-year period, ranging from 2019 to 2025
- Identifying the attractive opportunities in the market by determining the largest and fastest-growing segments across regions
- Providing detailed information about the key factors influencing the growth of the market (drivers, restraints, opportunities, and industry-specific challenges)
- Analyzing the micromarkets, with respect to individual growth trends, prospects, and their contribution to the total market
- Identifying and profiling the key players in the sucrose esters market
- Providing a comparative analysis of market leaders on the basis of the following:
- Product offerings
- Business strategies
- Strengths and weaknesses
- Key financials
- Understanding the competitive landscape and identifying the major growth strategies adopted by players across the key regions
- Analyzing the value chain and products offered across key regions and their impact on the growth of the prominent market players
- Providing insights on key product innovations and investments in the sucrose esters market
Available Customizations
Geographical Analysis
- Further breakdown of the Rest of Europe sucrose esters market, by key country
- Further breakdown of the Rest of Asia Pacific sucrose esters market, by key country
Company Information
- Analyses and profiling of additional market players (up to five)


Growth opportunities and latent adjacency in Sucrose Esters Market