Biodiesel Market by Feedstock Type (Vegetable Oils (Soybean, Rapeseed, Palm), Animal Fats (Lard/White Grease, Poultry, Tallow), Brown Grease/ Trap Grease), Application (Fuel, Power Generation), and Region - Global Forecast to 2021


To get the lastest information, inquire now!
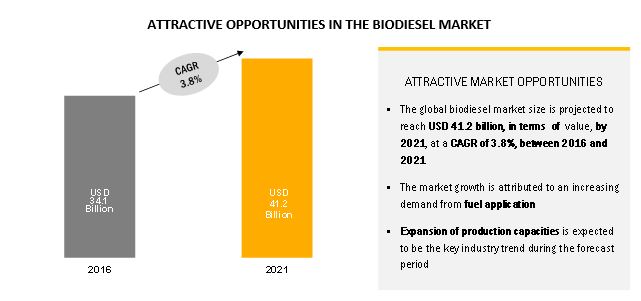
[163 Pages Report] The biodiesel market size was is estimated to be USD 34.1 billion, in 2016, and is projected to reach USD 41.2 billion, by 2021, at a CAGR of 3.8%, between 2016 and 2021. Increasing demand for environmentally-friendly fuels that reduce greenhouse gas emissions and ensure complete burning is an important factor driving the biodiesel market. The support of the government for biodiesel production by providing subsidies and imposing mandates indicates a continued growth of the market.
The vegetable oils segment accounted for the largest share of the market.
Feedstock obtained from vegetable oils such as rapeseed oil, soybean oil, and palm oil accounts for the largest share in the production of biodiesel. The feedstock used in a particular country depends on the availability of crops in that country. For instance, rapeseed oil is currently the most common feedstock used in biodiesel production, followed by soybean oil. Rapeseed oil is commonly used in many European countries for biodiesel production, whereas soybean oil is used in the U.S. and Argentina. Coconut oil and palm oil is used in Malaysia and Indonesia.
Fuel is projected to be the fastest-growing application of biodiesel during the forecast period.
Fuel application accounted for the largest share of in 2015, owing to the increasing consumption of biodiesel fuel in marine, automotive, railway, and agriculture industries. Biodiesel has a higher lubricity (50:1) than that of conventional petroleum diesel, which is also driving its application as fuel.
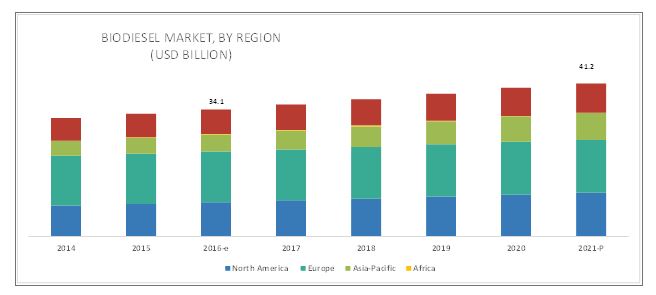
Europe is estimated to account for the largest market share during the forecast period.
Europe is the leading market of biodiesel, globally. However, Europe is projected to grow at a very low CAGR of in terms of volume. This is due to the saturation of biodiesel market in Europe. Asia-Pacific is projected to be the fastest-growing region.
Market Dynamics
Drivers
Potential to reduce emissions
Biodiesel is simple to use, biodegradable, and non-toxic in nature and, most importantly, it is free of aromatics, and sulfur compounds. It emits lower greenhouse gases and air pollutants, reduces toxic carbon-based emissions and can be used in most diesel engines. The increasing concern regarding greenhouse gas emissions through the use of fossil fuels is driving the growth of the biodiesel market. Biodiesel reduces emission of greenhouse gases by up to 50% as compared to petroleum diesel; and also has low toxic and carcinogenic aromatic carbon content. The U.S. consumed approximately 2 billion gallons of biodiesel in 2015, which resulted in the reduction of carbon emissions by at least 18.2 million metric tons, according to new U.S. EPA data. The production of biodiesel by several countries has helped them in reducing their dependence on foreign oil reserves, as it is domestically produced, and can be used in any diesel engine with little or no modifications to the engine or the fuel system. Owing to the fluctuating prices of petroleum-based products, biodiesel is becoming an increasingly affordable option.
Restraints
Performance concerns
Substituting conventional fuels with biodiesel blends is considered to be extremely vital for social and environmental reasons; however, there are potential problems if used in vehicles. One such example is the increase in water separation and fuel foaming, compared to pure fossil fuels. In addition, blending with low-stability biodiesel can possibly lead to higher levels of injector deposits and corrosion arising from the generation of low-molecular weight acids. There have been complaints reported from the OEMs and fuel injection equipment manufacturers for this type of damage in the field. Furthermore, significant loss of power in advanced direct injection engines have also been witnessed due to the use of poor quality biodiesel blends. An effective performance diesel fuel additive, popularly known as flow improvers, can help to guard against such problems.
Opportunities
OEM support for biodiesel continues to grow
DaimlerChrysler (Germany), Volkswagen (Germany), and Mercedes Benz (Germany) are supporting the use of biodiesel by extending warranties on vehicles run on the fuel. DaimlerChrysler, for instance, intends to increase the warranty coverage of the engine of the vehicle if the consumers use 20% blend of biodiesel in their vehicles. This is boosting the growth of biodiesel automotive applications. In addition, the U.S. Department of Defense, which is single largest consumer of oil, globally, has decided to run most of its on-road fleets on biodiesel blends. Several state governments including those of Carolina and North Dakota have followed suit. In some European countries such as Germany and France, the government has made legislations for the vehicles to run on specific blends (5% to 10%) of biodiesel. These government initiatives are also fueling the growth of biodiesel automotive applications.
Challenges
Easy availability of raw materials in emerging regions leading to overcapacity
The major raw materials used to manufacture biodiesel include palm oil, animal tallow, soy oil, palm kernel oil, and coconut oil. The emerging regions in the Asia-Pacific produce these raw materials in abundance. Moreover, the biodiesel market in the Asia-Pacific is at a growing stage as opposed to the North American and European markets which are mature, leading to manufacturers shifting to Asia-Pacific. Another aspect contributing to the growth of the Asia-Pacific market is the easy availability of raw materials. As a result, major global market players are focusing on shifting biodiesel production to these emerging regions. Easy availability of raw materials in the developing regions has lowered the entry barriers for manufacturers. As a result, many small, medium, and large manufacturers have entered the market for biodiesel and its feedstock market leading to an oversupply. In order to bridge the gap between demand and supply, the surplus production of biodiesel is being exported causing a price war in the local markets. This is a primary challenge that is faced in the biodiesel market.
Report Scope
|
Report Metric |
Details |
|
Years considered for the study |
2014–2021 |
|
Base year considered |
2015 |
|
Forecast period |
2016–2021 |
|
Units considered |
Volumer (Million liters) and Value (USD Million) |
|
Segments covered |
Feedstock Type, Blend, Production Technology, Application and Region |
|
Geographies covered |
North America, APAC, Europe, Middle East & Africa, and Latin America |
|
Companies covered |
Archer Daniels Midland Company (U.S.), Wilmar International Limited (Malaysia), Bunge Limited (U.S.), Neste Corporation (Finland), Renewable Energy Group Inc. (U.S.), Cargill Inc. (U.S.), BIOX Corporation (Canada), Munzer Bioindustrie (Austria), and Emami Group (India) |
Report Segmentation
-
Biodiesel Market, By Blend
- B100
- B20
- B10
- B5
-
Biodiesel Market, By Production Technology
- Pyrolysis
- Trans-esterification
- Others (Dilution, Micro-Emulsification)
-
Biodiesel Market, By Feedstock type
-
Vegetable Oils
- Edible Oils (Rapeseed/Canola, Soybean, Palm)
- Others
-
Animal Fats
- Poultry
- Tallow
- Lard & White Grease
- Others
-
Vegetable Oils
-
Biodiesel Market, By Application
-
Fuel
- Automotive (On road vehicles, Off road vehicles)
- Marine
- Agriculture
- Others
- Power Generation
- Others(Solvents, Diluent, Coatings, Printing Inks, Adhesives)
-
Fuel
-
Biodiesel Market, By Region
- Europe
- North America
- Asia-Pacific
- Latin America
- Africa
Key Market Players
The leading players in the biodiesel Market are Archer Daniels Midland Company (U.S.), Wilmar International Limited (Malaysia), Bunge Limited (U.S.), Neste Corporation (Finland), Renewable Energy Group Inc. (U.S.), Louis Dreyfus Company (Netherlands), Cargill Inc. (U.S.), BIOX Corporation (Canada), Munzer Bioindustrie (Austria), and Emami Group (India)
Recent Developments
- In November 2016, Renewable Energy Group Inc. started expansion of its Ralston, IA bio-refinery worth USD 24 million. This expansion will increase the annual production capacity to 30 million gallon from 12 million gallon and will help the company to serve the increasing demand of biodiesel in the U.S.
- In August 2016, Cargill Inc. expanded its canola research facility in Aberdeen (Canada). The expansion included a pathology lab, new state-of-the-art Quality Assurance lab, ventilated seed prep room, and high efficiency LED lighting throughout the facility, with UV repelling windows. This expansion covered 14,000 Sq. ft. area, and it will allow the company to conduct research and innovations in the specialty canola business.
- In June 2016, BIOX Corporation acquired a biodiesel facility in Sombra, Ontario owned by Methes Energies Canada Inc. The facility has the capacity of producing 50 million liters of biodiesel. This acquisition will increase the company's production capacity by 75% and enable it to serve its customers in North America.
Key questions addressed by the report:
- What are the global trends in demand for biodiesel? Will the market witness an increase or decline in demand in the coming years?
- What is the estimated demand for the different applications of biodiesel?
- What were the revenue pockets for the biodiesel market in 2015?
- What are the different end-use industries of biodiesel?
- Who are the major biodiesel manufacturers globally?
To speak to our analyst for a discussion on the above findings, click Speak to Analyst
 Exclusive indicates content/data unique to MarketsandMarkets and not available with any competitors.
Table of Contents
1 Introduction (Page No. - 16)
1.1 Objectives of the Study
1.2 Market Definition
1.3 Market Scope
1.3.1 Markets Covered
1.3.2 Years Considered for the Study
1.4 Currency
1.5 Unit Considered
1.6 Stakeholders
2 Research Methodology (Page No. - 19)
2.1 Research Data
2.1.1 Secondary Data
2.1.1.1 Key Data From Secondary Sources
2.1.2 Primary Data
2.1.2.1 Key Data From Primary Sources
2.1.2.2 Breakdown of Primary Interviews
2.2 Market Size Estimation
2.3 Data Triangulation
2.4 Research Assumptions and Limitations
2.4.1 Assumptions
2.4.2 Limitations
3 Executive Summary (Page No. - 28)
4 Premium Insights (Page No. - 31)
4.1 Significant Opportunities in Biodiesel Market
4.2 Biodiesel Market in Europe, By Feedstock Type, and Country
4.3 Fastest-Growing Biodiesel Market
4.4 Biodiesel Market, By Feedstock Type
4.5 Biodiesel Market Using Vegetable Oils as A Feedstock
4.6 Biodiesel Market, By Application
5 Market Overview (Page No. - 35)
5.1 Introduction
5.2 Market Evolution
5.3 Market Segmentation
5.3.1 By Feedstock Type
5.3.2 By Application
5.3.3 By Region
5.4 Impact Analysis
5.5 Market Dynamics
5.5.1 Drivers
5.5.1.1 Potential to Reduce Emissions
5.5.1.2 Biodegradability of Biodiesel
5.5.1.3 Environment-Friendliness and Renewability of Biodiesel
5.5.1.4 Tax Incentives Support Market Development
5.5.2 Restraints
5.5.2.1 Performance Concerns
5.5.2.2 Weaker Cold Filtration Properties
5.5.2.3 Insufficient Availability of All Types of Feedstocks Restrains Growth
5.5.3 Opportunities
5.5.3.1 OEM Support for Biodiesel Continues to Grow
5.5.3.2 Growing Uses for Crude Glycerin From Biodiesel Production
5.5.4 Challenges
5.5.4.1 Easy Availability of Raw Materials in Emerging Regions Leading to Overcapacity
6 Industry Trends (Page No. - 45)
6.1 Introduction
6.2 Biodiesel Market Trends, By Region
6.2.1 Americas: Reviving With New Biodiesel Destinations
6.2.2 Europe: Increasing Tax, Decreasing Production
6.2.3 Asia: Biodiesel Market Opportunity
6.3 Supply-Chain Analysis
6.3.1 Biodiesel vs Petroleum Diesel: Comparative Analysis
6.4 Porter’s Five Forces
6.4.1 Threat of Substitutes
6.4.2 Threat of New Entrants
6.4.3 Bargaining Power of Suppliers
6.4.4 Bargaining Power of Buyers
6.4.5 Intensity of Competitive Rivalry
7 Macro Economic Indicators (Page No. - 54)
7.1 GDP Growth Rate Forecasts of Major Global Economies
7.2 Feedstock Analysis
7.3 Regional Analysis
8 Biodiesel Market, By Blend (Page No. - 59)
8.1 Introduction
8.2 B100
8.3 B20
8.4 B10
8.5 B5
9 Biodiesel Market, By Production Technology (Page No. - 60)
9.1 Introduction
9.2 Pyrolysis
9.3 Trans-Esterification
9.4 Others(Including Dilution and Micro-Emulsification)
10 Biodiesel Market, By Feedstock Type (Page No. - 61)
10.1 Introduction
10.2 Vegetable Oils
10.2.1 Edible Oils
10.2.1.1 Rapeseed/Canola Oil
10.2.1.2 Soybean Oil
10.2.1.3 Palm Oil
10.2.2 Others (Includes Non-Edible Oils)
10.3 Animal Fats
10.3.1 Poultry
10.3.2 Tallow
10.3.3 Lard and Choice White Grease
10.4 Others
11 Biodiesel Market, By Application (Page No. - 73)
11.1 Introduction
11.2 Fuel
11.2.1 Automotive
11.2.1.1 on Road (Heavy Duty, Medium Duty, Light Duty)
11.2.1.2 Off-Road (Construction Machinery, Mining Equipment, and Locomotives)
11.2.2 Marine
11.2.3 Agriculture
11.2.4 Others
11.3 Power Generation
11.4 Others (Solvents, Diluent, Coatings, Printing Inks, Adhesives)
12 Biodiesel Market, By Region (Page No. - 77)
12.1 Introduction
12.2 Europe
12.2.1 Germany
12.2.2 France
12.2.3 Spain
12.2.4 Italy
12.2.5 U.K.
12.2.6 Poland
12.2.7 Austria
12.2.8 Rest of Europe
12.3 North America
12.3.1 U.S.
12.3.2 Canada
12.4 Asia-Pacific
12.4.1 China
12.4.2 India
12.4.3 Thailand
12.4.4 South Korea
12.4.5 Malaysia
12.4.6 Indonesia
12.4.7 Australia
12.4.8 Rest of Asia-Pacific
12.5 Latin America
12.5.1 Brazil
12.5.2 Argentina
12.5.3 Colombia
12.5.4 Peru
12.6 Africa
12.6.1 South Africa
12.6.2 Mozambique
12.6.3 Rest of Africa
13 Competitive Landscape (Page No. - 126)
13.1 Overview
13.2 Supplier Ranking for Biodiesel Market, in 2015
13.3 Competitive Situation and Trends
13.4 Expansion: Most Popular Growth Strategy Between 2013 and 2016
13.4.1 Expansions
13.4.2 Agreements & Joint Ventures
13.4.3 Acquisitions
13.4.4 New Product Developments
14 Company Profiles (Page No. - 135)
14.1 Archer Daniels Midland Company (ADM)
14.1.1 Business Overview
14.1.2 Products Offered
14.1.3 Recent Developments
14.1.4 SWOT Analysis
14.1.5 MnM View
14.2 Wilmar International Limited
14.2.1 Business Overview
14.2.2 Products Offered
14.2.3 Recent Developments
14.2.4 SWOT Analysis
14.2.5 MnM View
14.3 Bunge Limited
14.3.1 Business Overview
14.3.2 Products Offered
14.3.3 Recent Developments
14.3.4 SWOT Analysis
14.3.5 MnM View
14.4 Neste Corporation
14.4.1 Business Overview
14.4.2 Products Offered
14.4.3 Recent Developments
14.4.4 SWOT Analysis
14.4.5 MnM View
14.5 Renewable Energy Group Inc.
14.5.1 Business Overview
14.5.2 Products Offered
14.5.3 Recent Developments
14.5.4 SWOT Analysis
14.5.5 MnM View
14.6 Cargill Inc.
14.6.1 Business Overview
14.6.2 Products Offered
14.6.3 Recent Developments
14.7 Louis Dreyfus Company
14.7.1 Business Overview
14.7.2 Products Offered
14.8 Biox Corporation
14.8.1 Business Overview
14.8.2 Recent Developments
14.9 Münzer Bioindustrie GmbH
14.9.1 Overview
14.9.2 Products Offered
14.10 Terravia Holdings Inc.
14.10.1 Overview
14.10.2 Products Offered
14.10.3 Recent Developments
14.11 Emami Group
14.12 Shirke Energy
14.13 AG Processing, Inc.
14.14 Ecodiesel Colombia S.A.
14.15 Futurefuel Group
15 Appendix (Page No. - 158)
15.1 Key Expert Insights
15.2 Discussion Guide
15.3 Introducing RT: Real Time Market Intelligence
15.4 Available Customizations
15.5 Related Reports
List of Tables (124 Tables)
Table 1 Biodiesel Market: By Feedstock Type
Table 2 Biodiesel Market: By Application
Table 3 Emission Reduction Values of Biodiesel
Table 4 Biodiesel Lifecycle Operations
Table 5 Petroleum Diesel Lifecycle Operations
Table 6 Comparative Analysis of Biodiesel With Other Alternative Fuels
Table 7 Trends and Forecast for GDP Growth Rates Between 2016 and 2021
Table 8 Country-Wise Biodiesel Blend Mandate
Table 9 Primary Feedstock Used in Different Countries
Table 10 Comparison of Feedstock Types
Table 11 Biodiesel Market Size, By Feedstock Type, 2014–2021 (Million Liters)
Table 12 Biodiesel Market Size, By Feedstock Type, 2014–2021 (USD Million)
Table 13 Vegetable Oils Market Size, By Feedstock, 2014–2021 (Million Liter)
Table 14 Vegetable Oils Market Size, By Feedstock, 2014–2021 (USD Million)
Table 15 Vegetable Oils Market Size, By Region, 2014–2021 (Million Liter)
Table 16 Vegetable Oils Market Size, By Region, 2014–2021 (USD Million)
Table 17 Animal Fats Market Size, By Feedstock, 2014–2021 (Million Liter)
Table 18 Animal Fats Market Size, By Feedstock, 2014–2021 (USD Million)
Table 19 Animal Fats Market Size, By Region, 2014–2021 (Million Liter)
Table 20 Animal Fats Market Size, By Region, 2014–2021 (USD Million)
Table 21 Others Market Size, By Region, 2014–2021 (Million Liter)
Table 22 Others Market Size, By Region, 2014–2021 (USD Million)
Table 23 Biodiesel Market Size, By Application, 2014–2021 (Million Liter)
Table 24 Biodiesel Market Size, By Application, 2014–2021 (USD Million)
Table 25 Top10 Biodiesel-Consuming Countries, 2014–2021 (Million Liter)
Table 26 Top10 Biodiesel-Producing Countries, 2014–2021 (Million Liter)
Table 27 Biodiesel Market Size, By Region, 2014–2021 (Million Liter)
Table 28 Biodiesel Market Size, By Region, 2014–2021 (USD Million)
Table 29 Biodiesel Feedstock Market Size, By Region, 2014–2021 (Million Liter)
Table 30 Biodiesel Feedstock Market Size, By Region, 2014–2021 (USD Million)
Table 31 Europe: Biodiesel Market Size, By Country, 2014–2021 (Million Liter)
Table 32 Europe: Biodiesel Market Size, By Country, 2014–2021 (USD Million)
Table 33 Europe: Biodiesel Feedstock Market Size, By Country, 2014–2021 (Million Liter)
Table 34 Europe: Biodiesel Feedstock Market Size, By Country, 2014–2021 (USD Million)
Table 35 Europe: Biodiesel Market Size, By Feedstock Type, 2014–2021 (Million Liter)
Table 36 Europe: Biodiesel Market Size, By Feedstock Type, 2014–2021 (USD Million)
Table 37 Europe: Vegetable Oils Market Size, By Feedstock, 2014–2021 (Million Liter)
Table 38 Europe: Vegetable Oils Market Size, By Feedstock, 2014–2021 (USD Million)
Table 39 Germany: Biodiesel Market Size, By Feedstock Type, 2014–2021 (Million Liter)
Table 40 Germany: Biodiesel Market Size, By Feedstock Type, 2014–2021 (USD Million)
Table 41 France: Biodiesel Market Size, By Feedstock Type, 2014–2021 (Million Liter)
Table 42 France: Biodiesel Market Size, By Feedstock Type, 2014–2021 (USD Million)
Table 43 Spain: Biodiesel Market Size, By Feedstock Type, 2014–2021 (Million Liter)
Table 44 Spain: Biodiesel Market Size, By Feedstock Type, 2014–2021 (USD Million)
Table 45 Italy: Biodiesel Market Size, By Feedstock Type, 2014–2021 (Million Liter)
Table 46 Italy: Biodiesel Market Size, By Feedstock Type, 2014–2021 (USD Million)
Table 47 U.K.: Biodiesel Market Size, By Feedstock Type, 2014–2021 (Million Liter)
Table 48 U.K.: Biodiesel Market Size, By Feedstock Type, 2014–2021 (USD Million)
Table 49 Poland: Biodiesel Market Size, By Feedstock Type, 2014–2021 (Million Liter)
Table 50 Poland: Biodiesel Market Size, By Feedstock Type, 2014–2021 (USD Million)
Table 51 Austria: Biodiesel Market Size, By Feedstock Type, 2014–2021 (Million Liter)
Table 52 Austria: Biodiesel Market Size, By Feedstock Type, 2014–2021 (USD Million)
Table 53 Rest of Europe: Biodiesel Market Size, By Feedstock Type, 2014–2021 (Million Liter)
Table 54 Rest of Europe: Biodiesel Market Size, By Feedstock Type, 2014–2021 (USD Million)
Table 55 North America: Biodiesel Market Size, By Country, 2014–2021 (Million Liter)
Table 56 North America: Biodiesel Market Size, By Country, 2014–2021 (USD Million)
Table 57 North America: Biodiesel Feedstock Market Size, By Country, 2014–2021 (Million Liter)
Table 58 North America: Biodiesel Feedstock Market Size, By Country, 2014–2021 (USD Million)
Table 59 North America: Biodiesel Market Size, By Feedstock Type, 2014–2021 (Million Liter)
Table 60 North America: Biodiesel Market Size, By Feedstock Type, 2014–2021 (USD Million)
Table 61 North America: Vegetable Oils Market Size, By Feedstock, 2014–2021 (Million Liter)
Table 62 North America: Vegetable Oils Market Size, By Feedstock, 2014–2021 (USD Million)
Table 63 U.S.: Biodiesel Market Size, By Feedstock Type, 2014–2021 (Million Liter)
Table 64 U.S.: Biodiesel Market Size, By Feedstock Type, 2014–2021 (USD Million)
Table 65 Canada: Biodiesel Market Size, By Feedstock Type, 2014–2021 (Million Liter)
Table 66 Canada: Biodiesel Market Size, By Feedstock Type, 2014–2021 (USD Million)
Table 67 Asia-Pacific: Biodiesel Market Size, By Country, 2014–2021 (Million Liter)
Table 68 Asia-Pacific: Biodiesel Market Size, By Country, 2014–2021 (USD Million)
Table 69 Asia-Pacific: Biodiesel Feedstock Market Size, By Country, 2014–2021 (Million Liter)
Table 70 Asia-Pacific: Biodiesel Feedstock Market Size, By Country, 2014–2021 (USD Million)
Table 71 Asia-Pacific: Biodiesel Market Size, By Feedstock Type, 2014–2021 (Million Liter)
Table 72 Asia-Pacific: Biodiesel Market Size, By Feedstock Type, 2014–2021 (USD Million)
Table 73 Asia-Pacific: Vegetable Oils Market Size, By Feedstock, 2014–2021 (Million Liter)
Table 74 Asia-Pacific: Vegetable Oils Market Size, By Feedstock, 2014–2021 (USD Million)
Table 75 China: Biodiesel Market Size, By Feedstock Type, 2014–2021 (Million Liter)
Table 76 China: Biodiesel Market Size, By Feedstock Type, 2014–2021 (USD Million)
Table 77 India: Biodiesel Market Size, By Feedstock Type, 2014–2021 (Million Liter)
Table 78 India: Biodiesel Market Size, By Feedstock Type, 2014–2021 (USD Million)
Table 79 Thailand: Biodiesel Market Size, By Feedstock Type, 2014–2021 (Million Liter)
Table 80 Thailand: Biodiesel Market Size, By Feedstock Type, 2014–2021 (USD Million)
Table 81 South Korea: Biodiesel Market Size, By Feedstock Type, 2014–2021 (Million Liter)
Table 82 South Korea: Biodiesel Market Size, By Feedstock Type, 2014–2021 (USD Million)
Table 83 Malaysia: Biodiesel Market Size, By Feedstock Type, 2014–2021 (Million Liter)
Table 84 Malaysia: Biodiesel Market Size, By Feedstock Type, 2014–2021 (USD Million)
Table 85 Indonesia: Biodiesel Market Size, By Feedstock Type, 2014–2021 (Million Liter)
Table 86 Indonesia: Biodiesel Market Size, By Feedstock Type, 2014–2021 (USD Million)
Table 87 Australia: Biodiesel Market Size, By Feedstock Type, 2014–2021 (Million Liter)
Table 88 Australia: Biodiesel Market Size, By Feedstock Type, 2014–2021 (USD Million)
Table 89 Rest of Asia-Pacific: Biodiesel Market Size, By Feedstock Type, 2014–2021 (Million Liter)
Table 90 Rest of Asia-Pacific: Biodiesel Market Size, By Feedstock Type, 2014–2021 (USD Million)
Table 91 Latin America: Biodiesel Market Size, By Country, 2014–2021 (Million Liter)
Table 92 Latin America: Biodiesel Market Size, By Country, 2014–2021 (USD Million)
Table 93 Latin America: Biodiesel Feedstock Market Size, By Country, 2014–2021 (Million Liter)
Table 94 Latin America: Biodiesel Feedstock Market Size, By Country, 2014–2021 (USD Million)
Table 95 Latin America: Biodiesel Market Size, By Feedstock Type, 2014–2021 (Million Liter)
Table 96 Latin America: Biodiesel Market Size, By Feedstock Type, 2014–2021 (USD Million)
Table 97 Latin America: Vegetable Oils Market Size, By Feedstock, 2014–2021 (Million Liter)
Table 98 Latin America: Vegetable Oils Market Size, By Feedstock, 2014–2021 (USD Million)
Table 99 Brazil: Biodiesel Market Size, By Feedstock Type, 2014–2021 (Million Liter)
Table 100 Brazil: Biodiesel Market Size, By Feedstock Type, 2014–2021 (USD Million)
Table 101 Argentina: Biodiesel Market Size, By Feedstock Type, 2014–2021 (Million Liter)
Table 102 Argentina: Biodiesel Market Size, By Feedstock Type, 2014–2021 (USD Million)
Table 103 Colombia: Biodiesel Market Size, By Feedstock Type, 2014–2021 (Million Liter)
Table 104 Colombia: Biodiesel Market Size, By Feedstock Type, 2014–2021 (USD Million)
Table 105 Peru: Biodiesel Market Size, By Feedstock Type, 2014–2021 (Million Liter)
Table 106 Peru: Biodiesel Market Size, By Feedstock Type, 2014–2021 (USD Million)
Table 107 Africa: Biodiesel Market Size, By Country, 2014–2021 (Million Liter)
Table 108 Africa: Biodiesel Market Size, By Country, 2014–2021 (USD Million)
Table 109 Africa: Biodiesel Feedstock Market Size, By Country, 2014–2021 (Million Liter)
Table 110 Africa: Biodiesel Feedstock Market Size, By Country, 2014–2021 (USD Million)
Table 111 Africa: Biodiesel Market Size, By Feedstock Type, 2014–2021 (Million Liter)
Table 112 Africa: Biodiesel Market Size, By Feedstock Type, 2014–2021 (USD Million)
Table 113 Africa: Vegetable Oils Market Size, By Feedstock, 2014–2021 (Million Liter)
Table 114 Africa: Vegetable Oils Market Size, By Feedstock, 2014–2021 (USD Million)
Table 115 South Africa: Biodiesel Market Size, By Feedstock Type, 2014–2021 (Million Liter)
Table 116 South Africa: Biodiesel Market Size, By Feedstock Type, 2014–2021 (USD Million)
Table 117 Mozambique: Biodiesel Market Size, By Feedstock Type, 2014–2021 (Million Liter)
Table 118 Mozambique: Biodiesel Market Size, By Feedstock Type, 2014–2021 (USD Million)
Table 119 Rest of Africa: Biodiesel Market Size, By Feedstock Type, 2014–2021 (Million Liter)
Table 120 Rest of Africa: Biodiesel Market Size, By Feedstock Type, 2014–2021 (USD Million)
Table 121 Expansions, 2014-2016
Table 122 Agreements & Joint Ventures, 2013–2016
Table 123 Acquisitions, 2014–2016
Table 124 New Product Developments, 2013–2014
List of Figures (52 Figures)
Figure 1 Biodiesel Market: Research Design
Figure 2 Breakdown of Primary Interviews
Figure 3 Market Size Estimation: Bottom-Up Approach
Figure 4 Market Size Estimation: Top-Down Approach
Figure 5 Biodiesel: Data Triangulation
Figure 6 Vegetable Oils to Be Dominant Feedstock Type Between 2016 and 2021
Figure 7 Soybean to Be Largest Used Vegetable Oil Feedstock Between 2016 and 2021
Figure 8 Fuel to Be the Dominant Application of Biodiesel Between 2015 and 2021
Figure 9 Europe LED Biodiesel Market in 2016
Figure 10 Biodiesel Market Size, 2016 vs 2021 (USD Billion)
Figure 11 Germany to Lead Biodiesel Market in Europe
Figure 12 Malaysia to Be Fastest-Growing Market Between 2016 and 2021
Figure 13 Soybean Oil to Dominate Biodiesel Market Between 2016 And2021 (Million Liters)
Figure 14 Europe to Lead Market in Usage of Vegetable Oils as A Feedstock, 2016–2021 (Million Liters)
Figure 15 Fuel Accounted for Largest Share, in 2015
Figure 16 Evolution of Biodiesel
Figure 17 Biodiesel Market Segmentation, By Region
Figure 18 Environmental Friendliness of Biodiesel to have A Long Term Impact on Biodiesel Market Growth
Figure 19 Low Emission From Biodiesel Fostering Market Growth
Figure 20 Biodiesel Market Supply-Chain Analysis
Figure 21 Biodiesel Market: Porter’s Five Forces Analysis
Figure 22 Feedstock Fat Content
Figure 23 Oil Yield From Vegetable Feedstocks
Figure 24 Global Biodiesel Production, 2015
Figure 25 Top-10 Biodiesel Producing Countries, 2015
Figure 26 Vegetable Oils Accounted for Majority Share of Biodiesel Market, in 2015 (USD Million)
Figure 27 Europe is Estimated to Lead Vegetable Oils Market in Biodiesel Production, in 2016
Figure 28 North America is Estimated to Lead Animal Fats Feedstock Market for Biodiesel Production, Between 2016 and 2021
Figure 29 Latin America is Projected to Dominate Others Feedstock Market for Biodiesel During Forecast Period
Figure 30 Fuel Application Accounted for Majority Share of Biodiesel Market, 2015
Figure 31 Regional Snapshot: Rapidly Growing Markets are Emerging as New Strategic Locations
Figure 32 Europe Market Snapshot: Italy to Be the Fastest-Growing Market
Figure 33 U.S. Market Snapshot, 2016 vs 2021
Figure 34 Asia-Pacific Snapshot: China to Be the Largest Market
Figure 35 Vegetable Oils Accounted for the Largest Market Share of Asia-Pacific in 2015
Figure 36 Companies Adopted Expansion as the Key Growth Strategy Between 2013 and 2016
Figure 37 Major Biodiesel Producers & Their Ranks, 2015
Figure 38 Market Evaluation Framework: Expansions Fueled Growth Between 2013 and 2016
Figure 39 Archer Daniels Midland Company: Company Snapshot
Figure 40 Archer Daniels Midland Company: SWOT Analysis
Figure 41 Wilmar International Limited: Company Snapshot
Figure 42 Wilmar International Limited: SWOT Analysis
Figure 43 Bunge Limited: Company Snapshot
Figure 44 Bunge Limited: SWOT Analysis
Figure 45 Neste Corporation: Company Snapshot
Figure 46 Neste Corporation: SWOT Analysis
Figure 47 Renewable Energy Group Inc.: Company Snapshot
Figure 48 Cargill Inc.: Company Snapshot
Figure 49 Louis Dreyfus Company: Company Snapshot
Figure 50 Biox Corporation: Company Snapshot
Figure 51 Münzer Bioindustrie GmbH: Company Snapshot
Figure 52 Terravia Holdings Inc.: Company Snapshot


Growth opportunities and latent adjacency in Biodiesel Market
Need data on Biodiesel market size and future outlook with a focus on Eastern Europe.
applications of biodiesel by market share in India
General information on biodiesel market by animal fats feedstock type
Interested in feedstock from animal fats.
General inquiry on graphical representation of report
Biodiesel Market
Biodiesel market report needed for Europe market
General information on biodiesel market
Information UCO by sourece type