Absorbent Glass Mat (AGM) Battery Market by Voltage (2�4 Volts, 6�8 Volts, 12 Volts & Above), Type (Stationary, Motive), End User (OEM, Aftermarket), Application (Automotive, UPS, Energy storage, Industrial), and Geography - Global Forecast to 2025-2036


The global absorbent glass mat (AGM) battery market was valued at USD 12.91 billion in 2024 and is estimated to reach USD 26. 71 billion by 2036, at a CAGR of 5.3% between 2025 and 2036.
The global Absorbent Glass Mat (AGM) Battery market is driven by the rising demand for reliable and maintenance-free energy storage solutions across automotive, renewable, and industrial applications. Growing adoption of start-stop vehicles, data centers, and backup power systems is fueling market growth. Technological advancements in battery efficiency, extended lifecycle, and enhanced safety are further boosting adoption. Manufacturers are focusing on innovation, cost optimization, and capacity expansion to strengthen their global footprint and meet evolving energy demands.
 battery market")
Absorbent Glass Mat (AGM) batteries are advanced lead-acid batteries designed to store and deliver reliable power for a variety of applications. They offer maintenance-free operation, enhanced safety, and resistance to vibration, making them ideal for automotive, renewable energy, and backup power systems. AGM batteries provide high charge efficiency, deep cycling capability, and compatibility with modern electronics, supporting uninterrupted performance in vehicles, data centers, and industrial equipment.
Market by Voltage
2–4 V
The 2–4 V segment represents a significant share of the Absorbent Glass Mat (AGM) battery market, primarily driven by its extensive use in backup power systems, emergency lighting, and small-scale energy storage applications. These batteries are valued for their compact size, high energy density, and sealed construction, making them ideal for environments where maintenance-free operation and reliability are critical. In telecommunications and uninterruptible power supply (UPS) systems, 2–4 V AGM batteries ensure stable power continuity and protect sensitive equipment from outages or voltage fluctuations. Their long cycle life, low self-discharge, and resistance to vibration further enhance their adoption in both commercial and industrial installations.
6–8 V
The 6–8 V segment is expected to witness steady growth, largely driven by demand from electric vehicles, renewable energy systems, and deep-cycle applications. These batteries offer higher capacity and are well-suited for motive power applications such as golf carts, mobility scooters, and material handling equipment. Additionally, the 6–8 V AGM batteries provide superior charge acceptance, fast recovery from deep discharge, and robust performance under cyclic loading conditions. Their sealed design and spill-proof nature make them ideal for applications requiring flexibility in installation and safety in enclosed or vibration-prone environments.
Market by Type
Stationary
Stationary AGM batteries hold a dominant position in the market, primarily serving as reliable backup and storage solutions for telecommunications, data centers, security systems, and power utilities. Their maintenance-free design, high float life, and ability to operate in various temperature conditions make them well-suited for critical infrastructure applications. Integration with renewable energy systems such as solar and wind further boosts their demand, as they offer stable performance and deep-discharge capability to support off-grid and hybrid setups. In addition, advancements in grid energy storage and microgrid development continue to expand the deployment of stationary AGM batteries globally.
Motive
Motive AGM batteries are witnessing rapid adoption due to their role in powering electric vehicles, forklifts, and automated guided vehicles (AGVs). Their high discharge efficiency, fast recharge capability, and durability under high-load conditions make them a preferred choice over conventional flooded lead-acid batteries. The motive segment also benefits from increasing electrification in material handling and logistics operations, as industries prioritize clean energy and zero-maintenance power solutions. These batteries deliver consistent performance, even under frequent charge-discharge cycles, supporting both indoor and outdoor mobility applications across industrial and commercial sectors.
Market by Geography
Geographically, the Absorbent Glass Mat (AGM) battery market is witnessing robust adoption across North America, Europe, APAC, and the Rest of the World (RoW). APAC dominates the market, driven by rapid industrialization, expanding automotive production, and increasing renewable energy installations. North America follows, supported by strong demand for backup power solutions, telecom infrastructure, and electric mobility applications. Europe remains a key market due to its focus on sustainable energy storage, grid modernization, and stringent emission standards promoting electric vehicle adoption. Meanwhile, the Middle East, Africa, and South America are emerging as high-growth regions, fueled by investments in power reliability, solar energy projects, and the transition toward maintenance-free energy storage technologies across residential, commercial, and industrial applications.
Market Dynamics
Driver: Growing adoption of agm batteries in diverse high-current applications
The demand for Absorbent Glass Mat (AGM) batteries is increasing across a wide range of high-current applications due to their superior performance, safety, and versatility. They are extensively used in renewable energy systems such as solar and wind power for applications including solar home setups, off-grid installations, solar street lighting, and wind turbines. In the automotive sector, AGM batteries are preferred for premium vehicles like BMW and Mercedes, power sports vehicles such as boats and jet skis, and industrial machinery including forklifts. Their lightweight design, spill-proof construction, and flexible mounting orientation also make them ideal for high-end motorcycles like Triumph and Harley-Davidson. Furthermore, their robust starting power and ability to support advanced electronics make AGM batteries well-suited for marine vessels, heavy trucks, coaches, and buses.
Restraint: Rising preference for advanced alternatives in the energy storage market
While valve-regulated lead-acid (VRLA) batteries, including AGM batteries, have traditionally been regarded as cost-effective solutions, their dominance is waning with the emergence of advanced energy storage technologies. Lithium-ion batteries, in particular, have gained significant traction due to their higher energy density, longer lifespan, and rapidly declining costs, challenging the competitiveness of VRLA batteries across multiple industries. Additionally, Nickel-Metal Hydride (NiMH) batteries remain a mature and reliable choice for hybrid applications, favored by major OEMs such as Toyota, Honda, and Lexus for their safety and durability. Nickel-cadmium batteries also continue to serve as cost-efficient and robust alternatives. The growing adoption of these newer technologies poses a significant challenge to the long-term growth potential of the AGM battery market.
Opportunity: Increasing use of high-performance engine starter batteries in modern vehicles
The growing integration of start-stop systems in modern and luxury vehicles is driving demand for advanced, high-performance engine starter batteries. These systems, designed to improve fuel efficiency and reduce emissions, require batteries capable of delivering high starting currents and supporting frequent engine restarts. Unlike conventional starter batteries, AGM and Enhanced Flooded Batteries (EFB) are engineered to handle continuous charge-discharge cycles while maintaining reliable power output. When the engine is turned off at traffic lights or during idling, these batteries continue to power essential components such as infotainment systems, lights, and climate controls. AGM batteries, in particular, offer excellent cold-start capability, high reserve capacity, and strong resistance to deep cycling. Their ability to operate efficiently under partial state-of-charge conditions makes them ideal for vehicles with start-stop technology, ensuring consistent performance, reduced fuel consumption, and enhanced battery longevity in demanding automotive environments.
Challenge: Lower specific energy and efficiency limitations compared to advanced battery technologies
A major drawback of Absorbent Glass Mat (AGM) batteries is their relatively low specific energy compared to advanced chemistries such as lithium-ion, even though they outperform conventional flooded lead-acid types and are more affordable than gel batteries. AGM batteries generally have a lower usable capacity, with only about 30%–50% of their rated capacity effectively available. For instance, a 600 Ah battery bank may deliver just 300 Ah of practical capacity, and deeper discharges significantly shorten its lifespan. Even under optimal usage, deep-cycle AGM batteries typically offer around 1,000 cycles, translating to less than two years of service in frequent-use scenarios. Furthermore, AGM batteries suffer from notable charging inefficiencies, losing up to 15% of input energy during charging. This inherent energy loss reduces overall system efficiency, particularly in renewable energy setups such as solar systems, where maximizing energy capture and storage is critical. Consequently, these performance limitations constrain their competitiveness in energy-dense and efficiency-sensitive applications.
Future Outlook
Between 2025 and 2036, the Absorbent Glass Mat (AGM) battery market is projected to grow steadily, driven by rising demand for reliable, maintenance-free energy storage across automotive, industrial, and renewable sectors. The shift toward electrification, backup power reliability, and renewable integration will sustain strong adoption. Technological improvements enhancing cycle life, charge efficiency, and temperature tolerance will further expand applications in EVs, telecom, and grid storage. As industries and consumers prioritize sustainability and performance, AGM batteries will remain a critical component of hybrid energy systems, supporting the transition toward resilient, efficient, and cleaner power infrastructure worldwide.
Key Market Players
Top absorbent glass mat (AGM) batteries companies Clarios (US), EnerSys (US), Exide Technologies (France), C&D Technologies, Inc. (US), East Penn Manufacturing Company (US)
Key Questions addressed in this report:
- What are the global trends in demand for the market?
- What are the upcoming technologies/product areas that will have a significant impact on the market in the future?
- What will be the revenue pockets for the market players in the next 11 years?
- What are the prime strategies followed by key players in the market?
{ "@context": "https://schema.org", "@type": "Report", "name": "Absorbent Glass Mat (AGM) Battery Market – Global Forecast to 2025", "alternateName": "AGM Battery Market by Voltage, Type, End-User, Application & Geography", "reportCode": "SE 7482", "url": "https://www.marketsandmarkets.com/Market-Reports/absorbent-glass-mat-battery-market-113887664.html", "publisher": { "@type": "Organization", "name": "MarketsandMarkets", "url": "https://www.marketsandmarkets.com" }, "datePublished": "2019-12-01", "about": { "@type": "Technology", "name": "Absorbent Glass Mat (AGM) Battery" }, "description": "The global AGM battery market size is estimated to grow from USD 10.2 billion in 2019 to USD 13.9 billion by 2025, at a CAGR of approx. 5.3%. Segmented by voltage (2–4 V, 6–8 V, 12 V & above), type (Stationary, Motive), end-user (OEM, Aftermarket), application (Automotive, UPS, Energy Storage, Industrial) and geography (North America, Europe, Asia Pacific, Rest of World).", "inLanguage": "en", "dateModified": "2019-12-01", "estimatedRevenue": { "@type": "MonetaryAmount", "currency": "USD", "value": "10200000000" }, "forecastRevenue": { "@type": "MonetaryAmount", "currency": "USD", "value": "13900000000" }, "additionalProperty": [ { "@type": "PropertyValue", "name": "CAGR", "value": "5.3%", "unitText": "percent per annum" }, { "@type": "PropertyValue", "name": "ForecastPeriod", "value": "2019-2025", "unitText": "years" }, { "@type": "PropertyValue", "name": "VoltageSegments", "value": "2–4 V, 6–8 V, 12 V & above" }, { "@type": "PropertyValue", "name": "TypeSegments", "value": "Stationary, Motive" }, { "@type": "PropertyValue", "name": "ApplicationSegments", "value": "Automotive, UPS, Energy storage, Industrial" }, { "@type": "PropertyValue", "name": "GeographicalRegions", "value": "North America; Europe; Asia Pacific; Rest of World" } ] }
 Exclusive indicates content/data unique to MarketsandMarkets and not available with any competitors.
TABLE OF CONTENTS
1 INTRODUCTION (Page No. - 22)
1.1 STUDY OBJECTIVES
1.2 MARKET DEFINITION AND SCOPE
1.2.1 INCLUSIONS AND EXCLUSIONS
1.3 STUDY SCOPE
1.3.1 MARKETS COVERED
FIGURE 1 AGM BATTERY MARKET SEGMENTATION
1.3.2 GEOGRAPHIC SCOPE
1.3.3 YEARS CONSIDERED
1.4 CURRENCY
1.5 LIMITATIONS
1.6 STAKEHOLDERS
2 RESEARCH METHODOLOGY (Page No. - 27)
2.1 RESEARCH DATA
FIGURE 2 AGM BATTERY MARKET: RESEARCH DESIGN
2.1.1 SECONDARY AND PRIMARY RESEARCH
2.1.2 SECONDARY DATA
2.1.2.1 Secondary sources
2.1.3 PRIMARY DATA
2.1.3.1 Primary sources
2.1.3.2 Key industry insights
2.1.3.3 Breakdown of primaries
2.2 MARKET SIZE ESTIMATION
2.2.1 BOTTOM-UP APPROACH
2.2.1.1 Approach for arriving at the market share by bottom-up approach (demand side)
FIGURE 3 BOTTOM-UP APPROACH
2.2.2 TOP-DOWN APPROACH
2.2.2.1 Approach for arriving at the market share by top-down analysis (supply side)
FIGURE 4 TOP-DOWN APPROACH
2.3 DATA TRIANGULATION
FIGURE 5 DATA TRIANGULATION
2.4 RESEARCH ASSUMPTIONS
3 EXECUTIVE SUMMARY (Page No. - 37)
TABLE 1 AGM BATTERY MARKET, IN TERMS OF VALUE AND VOLUME, 2017–2025
FIGURE 6 AGM BATTERY MARKET FOR THE VOLTAGE RANGE OF 2–4 V TO GROW AT THE HIGHEST CAGR DURING FORECAST PERIOD
FIGURE 7 AGM BATTERY MARKET FOR ENERGY STORAGE TO GROW AT THE HIGHEST CAGR DURING THE FORECAST PERIOD
FIGURE 8 APAC IS EXPECTED TO HOLD THE LARGEST SHARE OF THE AGM BATTERY MARKET IN 2019
4 PREMIUM INSIGHTS (Page No. - 42)
4.1 ATTRACTIVE GROWTH OPPORTUNITIES IN THE AGM BATTERY MARKET
FIGURE 9 RISE IN THE USAGE OF ENERGY STORAGE AND UPS APPLICATIONS TO CREATE ATTRACTIVE GROWTH OPPORTUNITIES FOR THE AGM BATTERY MARKET PLAYERS
4.2 AGM BATTERY MARKET, BY VOLTAGE
FIGURE 10 AGM BATTERY MARKET FOR 2–4 V SEGMENT TO GROW AT THE HIGHEST CAGR DURING THE FORECAST PERIOD
4.3 AGM BATTERY MARKET, BY TYPE
FIGURE 11 MOTIVE AGM BATTERY SEGMENT TO WITNESS A HUGE DEMAND DURING THE FORECAST PERIOD
4.4 AGM BATTERY MARKET IN APAC, BY COUNTRY AND APPLICATION
FIGURE 12 CHINA AND THE AUTOMOTIVE SEGMENT ARE EXPECTED TO HOLD THE LARGEST SHARES OF THE AGM BATTERY MARKET IN APAC BY 2025
4.5 AGM BATTERY MARKET, BY APPLICATION
FIGURE 13 ENERGY STORAGE SEGMENT IS EXPECTED TO HOLD THE LARGEST SIZE OF THE AGM BATTERY MARKET, BY APPLICATION, FROM 2019 TO 2025
4.6 AGM BATTERY MARKET, BY COUNTRY, 2018
FIGURE 14 US AND CHINA HELD THE LARGEST SHARES OF THE AGM BATTERY MARKET IN 2018
5 MARKET OVERVIEW (Page No. - 45)
5.1 INTRODUCTION
5.2 MARKET DYNAMICS
FIGURE 15 AGM BATTERY MARKET: DRIVERS, RESTRAINTS, OPPORTUNITIES, AND CHALLENGES
5.2.1 DRIVERS
5.2.1.1 Inherent advantages of AGM batteries
5.2.1.2 Upsurge in renewable energy investment
FIGURE 16 GLOBAL INVESTMENT IN RENEWABLE ENERGY SOURCES, 2010–2018 (USD BILLION)
5.2.1.3 Easy recyclability of AGM batteries
5.2.1.4 Increasing demand for AGM batteries for a wide range of high-current applications
5.2.2 RESTRAINTS
5.2.2.1 Inclination toward other effective alternatives in the energy storage space
5.2.2.2 Safety-related issues
5.2.3 OPPORTUNITIES
5.2.3.1 Rising adoption of high-performance engine starter batteries in vehicles
FIGURE 17 WORLD MOTOR VEHICLE PRODUCTION, 2017–2018 (IN UNITS)
5.2.3.2 Large storage requirements in data centers
FIGURE 18 GLOBAL INCREASE IN DATA HANDLING CAPACITY (2018–2025)
5.2.3.3 Increase in renewable energy generation target
5.2.4 CHALLENGES
5.2.4.1 Lower specific energy than other batteries
5.2.4.2 Growth of electric vehicles
TABLE 2 COMPARISON SUMMARY OF VALVE-REGULATED LEAD-ACID BATTERIES AND LITHIUM-ION BATTERIES
FIGURE 19 IMPACT OF DRIVERS ON THE AGM BATTERY MARKET
FIGURE 20 IMPACT OF RESTRAINTS AND CHALLENGES ON THE AGM BATTERY MARKET
5.3 VALUE CHAIN ANALYSIS
FIGURE 21 AGM BATTERY MARKET: MAJOR VALUE ADDED BY MANUFACTURERS AND COMPONENT PROVIDERS
5.3.1 R&D
5.3.2 COMPONENT PROVIDERS
5.3.3 MANUFACTURERS
5.3.4 SYSTEM INTEGRATORS & DISTRIBUTORS
5.3.5 END-USERS
5.3.6 POST-SALES SERVICE PROVIDERS
6 AGM BATTERY MARKET, BY VOLTAGE (Page No. - 56)
6.1 INTRODUCTION
FIGURE 22 AGM BATTERY MARKET SEGMENTATION, BY VOLTAGE
FIGURE 23 AGM BATTERY WITH A VOLTAGE RANGE OF 12 V & ABOVE TO GROW AT THE HIGHEST CAGR DURING FORECAST PERIOD
TABLE 3 AGM BATTERY MARKET, BY VOLTAGE, 2017–2025 (USD MILLION)
6.2 2–4 V
6.2.1 DESIGNED TO MEET THE NEEDS OF UPS AND OTHER GENERAL-PURPOSE APPLICATIONS
6.3 6–8 V
6.3.1 SUITABLE FOR DEEP-CYCLE APPLICATIONS
6.4 12 V & ABOVE
6.4.1 DESIGNED FOR HIGH-CURRENT APPLICATIONS, THUS THE MOST DEMANDED ONES
7 AGM BATTERY MARKET, BY TYPE (Page No. - 60)
7.1 INTRODUCTION
FIGURE 24 AGM BATTERY MARKET, BY TYPE
FIGURE 25 STATIONARY AGM BATTERY SEGMENT TO GROW AT A HIGHER CAGR THAN THE MOTIVE SEGMENT FROM 2019 TO 2025
TABLE 4 AGM BATTERY MARKET, BY TYPE, 2017–2025 (USD MILLION)
7.2 STATIONARY
7.2.1 DEEP-CYCLE TECHNOLOGY IN STATIONARY AGM BATTERIES PROVIDES POWER FOR LONGER TIME WITH LOW DISCHARGE RATE
TABLE 5 STATIONARY AGM BATTERY MARKET, BY APPLICATION, 2017–2025 (USD MILLION)
FIGURE 26 STATIONARY AGM BATTERY MARKET FOR APAC EXPECTED TO ACCOUNT FOR THE LARGEST SIZE DURING THE FORECAST PERIOD
TABLE 6 STATIONARY AGM BATTERY MARKET, BY REGION, 2017–2025 (USD MILLION)
TABLE 7 STATIONARY AGM BATTERY MARKET IN NORTH AMERICA, BY COUNTRY, 2017–2025 (USD MILLION)
TABLE 8 STATIONARY AGM BATTERY MARKET IN EUROPE, BY COUNTRY, 2017–2025 (USD MILLION)
TABLE 9 STATIONARY AGM BATTERY MARKET IN APAC, BY COUNTRY, 2017–2025 (USD MILLION)
TABLE 10 STATIONARY AGM BATTERY MARKET IN ROW, BY REGION, 2017–2025 (USD MILLION)
7.3 MOTIVE
7.3.1 REDUCED CO2 EMISSION AND NOISE REDUCTION DRIVE THE DEMAND FOR MOTIVE AGM BATTERIES
TABLE 11 MOTIVE AGM BATTERY MARKET, BY APPLICATION, 2017–2025 (USD MILLION)
TABLE 12 MOTIVE AGM BATTERY MARKET, BY REGION, 2017–2025 (USD MILLION)
TABLE 13 MOTIVE AGM BATTERY MARKET IN NORTH AMERICA, BY COUNTRY, 2017–2025 (USD MILLION)
TABLE 14 MOTIVE AGM BATTERY MARKET IN EUROPE, BY COUNTRY, 2017–2025 (USD MILLION)
FIGURE 27 INDIA TO EXHIBIT THE HIGHEST CAGR FOR MOTIVE AGM BATTERY MARKET FROM 2019 TO 2025
TABLE 15 MOTIVE AGM BATTERY MARKET IN APAC, BY COUNTRY, 2017–2025 (USD MILLION)
TABLE 16 MOTIVE AGM BATTERY MARKET IN ROW, BY REGION, 2017–2025 (USD MILLION)
8 AGM BATTERY MARKET, BY END-USER (Page No. - 69)
8.1 INTRODUCTION
FIGURE 28 AGM BATTERY MARKET, BY END-USER (2018)
FIGURE 29 OEM SEGMENT TO HOLD THE LARGEST SIZE OF THE AGM BATTERY MARKET FROM 2019 TO 2025
TABLE 17 AGM BATTERY MARKET, BY END-USER, 2017–2025 (USD MILLION)
8.2 OEM
8.2.1 OEM SEGMENT IS ONE OF THE BIGGEST ADOPTERS OF AGM BATTERIES
TABLE 18 AGM BATTERY MARKET FOR OEM, BY APPLICATION, 2017–2025 (USD MILLION)
TABLE 19 AGM BATTERY MARKET FOR OEM, BY REGION, 2017–2025 (USD MILLION)
8.3 AFTERMARKET
8.3.1 RISING NEED FOR REPLACING OLD AGM BATTERIES DRIVES THE AFTERMARKET SEGMENT
TABLE 20 AGM BATTERY MARKET FOR AFTERMARKET, BY APPLICATION, 2017–2025 (USD MILLION)
TABLE 21 AGM BATTERY MARKET FOR AFTERMARKET, BY REGION, 2017–2025 (USD MILLION)
9 AGM BATTERY MARKET, BY APPLICATION (Page No. - 73)
9.1 INTRODUCTION
FIGURE 30 AGM BATTERY MARKET, BY APPLICATION
FIGURE 31 AGM BATTERY MARKET FOR ENERGY STORAGE APPLICATION TO GROW AT THE HIGHEST CAGR FROM 2019 TO 2025
TABLE 22 AGM BATTERY MARKET, BY APPLICATION, 2017–2025 (USD MILLION)
9.2 AUTOMOTIVE
9.2.1 PASSENGER VEHICLE
9.2.1.1 AGM batteries are a preferred solution for start-stop vehicle technology
9.2.2 MOTORCYCLE
9.2.2.1 AGM batteries are ideal for motorbikes with high energy requirements
9.2.3 OTHERS
9.2.3.1 Significant demand for AGM batteries in motor homes, AGVs, and golf carts applications propel the market
TABLE 23 AGM BATTERY MARKET FOR AUTOMOTIVE APPLICATION, 2017–2025 (MILLION UNITS)
TABLE 24 AGM BATTERY MARKET FOR AUTOMOTIVE APPLICATION, VEHICLE TYPE, 2017–2025 (USD MILLION)
TABLE 25 AGM BATTERY MARKET FOR AUTOMOTIVE APPLICATION, BY TYPE, 2017–2025 (USD MILLION)
TABLE 26 AGM BATTERY MARKET FOR AUTOMOTIVE APPLICATION, BY END-USER, 2017–2025 (USD MILLION)
TABLE 27 AGM BATTERY MARKET FOR AUTOMOTIVE APPLICATION, BY REGION, 2017–2025 (USD MILLION)
TABLE 28 AGM BATTERY MARKET FOR AUTOMOTIVE APPLICATION IN NORTH AMERICA, BY COUNTRY, 2017–2025 (USD MILLION)
TABLE 29 AGM BATTERY MARKET FOR AUTOMOTIVE APPLICATION IN EUROPE, BY COUNTRY, 2017–2025 (USD MILLION)
TABLE 30 AGM BATTERY MARKET FOR AUTOMOTIVE APPLICATION IN APAC, BY COUNTRY, 2017–2025 (USD MILLION)
TABLE 31 AGM BATTERY MARKET FOR AUTOMOTIVE APPLICATION IN ROW, BY REGION, 2017–2025 (USD MILLION)
9.3 UPS
9.3.1 AGM BATTERIES WORK AS AN EMERGENCY POWER SUPPLY FOR VARIOUS INDUSTRIES
TABLE 32 AGM BATTERY MARKET FOR UPS APPLICATION, BY TYPE, 2017–2025 (USD MILLION)
TABLE 33 AGM BATTERY MARKET FOR UPS APPLICATION, BY END-USER, 2017–2025 (USD MILLION)
TABLE 34 AGM BATTERY MARKET FOR UPS APPLICATION, BY REGION, 2017–2025 (USD MILLION)
TABLE 35 AGM BATTERY MARKET FOR UPS APPLICATION IN NORTH AMERICA, BY COUNTRY, 2017–2025 (USD MILLION)
TABLE 36 AGM BATTERY MARKET FOR UPS APPLICATION IN EUROPE, BY COUNTRY, 2017–2025 (USD MILLION)
TABLE 37 AGM BATTERY MARKET FOR UPS APPLICATION IN APAC, BY COUNTRY, 2017–2025 (USD MILLION)
TABLE 38 AGM BATTERY MARKET FOR UPS APPLICATION IN ROW, BY REGION, 2017–2025 (USD MILLION)
9.4 INDUSTRIAL
9.4.1 GROWTH IN INDUSTRIAL AUTOMATION IS EXPECTED TO BOOST THE DEMAND FOR AGM BATTERIES
TABLE 39 AGM BATTERY MARKET FOR INDUSTRIAL APPLICATION, BY TYPE, 2017–2025 (USD MILLION)
TABLE 40 AGM BATTERY MARKET FOR INDUSTRIAL APPLICATION, BY END-USER, 2017–2025 (USD MILLION)
TABLE 41 AGM BATTERY MARKET FOR INDUSTRIAL APPLICATION, BY REGION, 2017–2025 (USD MILLION)
TABLE 42 AGM BATTERY MARKET FOR INDUSTRIAL APPLICATION IN NORTH AMERICA, BY COUNTRY, 2017–2025 (USD MILLION)
TABLE 43 AGM BATTERY MARKET FOR INDUSTRIAL APPLICATION IN EUROPE, BY COUNTRY, 2017–2025 (USD MILLION)
TABLE 44 AGM BATTERY MARKET FOR INDUSTRIAL APPLICATION IN APAC, BY COUNTRY, 2017–2025 (USD MILLION)
TABLE 45 AGM BATTERY MARKET FOR INDUSTRIAL APPLICATION IN ROW, BY REGION, 2017–2025 (USD MILLION)
9.5 ENERGY STORAGE
9.5.1 RAPID GROWTH OF RENEWABLE ENERGY INSTALLATIONS DRIVE THE DEMAND FOR AGM BATTERIES IN ENERGY STORAGE APPLICATIONS
TABLE 46 AGM BATTERY MARKET FOR ENERGY STORAGE APPLICATION, BY TYPE, 2017–2025 (USD MILLION)
TABLE 47 AGM BATTERY MARKET FOR ENERGY STORAGE APPLICATION, BY END-USER, 2017–2025 (USD MILLION)
TABLE 48 AGM BATTERY MARKET FOR ENERGY STORAGE APPLICATION, BY REGION, 2017–2025 (USD MILLION)
TABLE 49 AGM BATTERY MARKET FOR ENERGY STORAGE APPLICATION IN NORTH AMERICA, BY COUNTRY, 2017–2025 (USD MILLION)
TABLE 50 AGM BATTERY MARKET FOR ENERGY STORAGE APPLICATION IN EUROPE, BY COUNTRY, 2017–2025 (USD MILLION)
TABLE 51 AGM BATTERY MARKET FOR ENERGY STORAGE APPLICATION IN APAC, BY COUNTRY, 2017–2025 (USD MILLION)
TABLE 52 AGM BATTERY MARKET FOR ENERGY STORAGE APPLICATION IN ROW, BY REGION, 2017–2025 (USD MILLION)
9.6 OTHERS
9.6.1 MEDICAL EQUIPMENT
9.6.1.1 Need for backup power and portability are the factors propelling the demand for AGM batteries for medical equipment
9.6.2 MARINE
9.6.2.1 Demand for high cranky power and deep-cycle solution supporting the heavy marine accessory load drives the marine AGM battery market
TABLE 53 AGM BATTERY MARKET FOR OTHERS APPLICATION, BY TYPE, 2017–2025 (USD MILLION)
TABLE 54 AGM BATTERY MARKET FOR OTHERS APPLICATION, BY END-USER, 2017–2025 (USD MILLION)
TABLE 55 AGM BATTERY MARKET FOR OTHERS APPLICATION, BY REGION, 2017–2025 (USD MILLION)
TABLE 56 AGM BATTERY MARKET FOR OTHERS APPLICATION IN NORTH AMERICA, BY COUNTRY, 2017–2025 (USD MILLION)
TABLE 57 AGM BATTERY MARKET FOR OTHERS APPLICATION IN EUROPE, BY COUNTRY, 2017–2025 (USD MILLION)
TABLE 58 AGM BATTERY MARKET FOR OTHERS APPLICATION IN APAC, BY COUNTRY, 2017–2025 (USD MILLION)
TABLE 59 AGM BATTERY MARKET FOR OTHERS APPLICATION IN ROW, BY REGION, 2017–2025 (USD MILLION)
10 GEOGRAPHIC ANALYSIS (Page No. - 92)
10.1 INTRODUCTION
FIGURE 32 GEOGRAPHIC SNAPSHOT (2018): INDIA TO WITNESS SIGNIFICANT GROWTH DURING THE FORECAST PERIOD
TABLE 60 AGM BATTERY MARKET, BY REGION, 2017–2025 (USD MILLION)
FIGURE 33 APAC HELD THE LARGEST SHARE OF THE AGM BATTERY MARKET IN 2018
10.2 NORTH AMERICA
FIGURE 34 NORTH AMERICA: SNAPSHOT OF THE AGM BATTERY MARKET
TABLE 61 AGM BATTERY MARKET IN NORTH AMERICA, BY END-USER, 2017–2025 (USD MILLION)
TABLE 62 AGM BATTERY MARKET IN NORTH AMERICA, BY TYPE, 2017–2025 (USD MILLION)
TABLE 63 AGM BATTERY MARKET IN NORTH AMERICA, BY APPLICATION, 2017–2025 (USD MILLION)
TABLE 64 AGM BATTERY MARKET IN NORTH AMERICA, BY COUNTRY, 2017–2025 (USD MILLION)
10.2.1 US
10.2.1.1 US, being the home for the majority of well-established AGM battery manufacturers, has a huge growth opportunity
TABLE 65 AGM BATTERY MARKET IN US, BY TYPE, 2017–2025 (USD MILLION)
TABLE 66 AGM BATTERY MARKET IN US, BY APPLICATION, 2017–2025 (USD MILLION)
10.2.2 CANADA
10.2.2.1 Canada is set to install AGM batteries for renewable integration and data centers
TABLE 67 AGM BATTERY MARKET IN CANADA, BY TYPE, 2017–2025 (USD MILLION)
TABLE 68 AGM BATTERY MARKET IN CANADA, BY APPLICATION, 2017–2025 (USD MILLION)
10.2.3 MEXICO
10.2.3.1 Rising investments in the automotive sector are propelling the growth of the AGM battery market in Mexico
TABLE 69 AGM BATTERY MARKET IN MEXICO, BY TYPE, 2017–2025 (USD MILLION)
TABLE 70 AGM BATTERY MARKET IN MEXICO, BY APPLICATION, 2017–2025 (USD MILLION)
10.3 EUROPE
FIGURE 35 EUROPE: SNAPSHOT OF THE AGM BATTERY MARKET
TABLE 71 AGM BATTERY MARKET IN EUROPE, BY END-USER, 2017–2025 (USD MILLION)
TABLE 72 AGM BATTERY MARKET IN EUROPE, BY TYPE, 2017–2025 (USD MILLION)
TABLE 73 AGM BATTERY MARKET IN EUROPE, BY APPLICATION, 2017–2025 (USD MILLION)
TABLE 74 AGM BATTERY MARKET IN EUROPE, BY COUNTRY, 2017–2025 (USD MILLION)
10.3.1 GERMANY
10.3.1.1 Well-established automotive sector in Germany is boosting the German AGM battery market
TABLE 75 AGM BATTERY MARKET IN GERMANY, BY TYPE, 2017–2025 (USD MILLION)
TABLE 76 AGM BATTERY MARKET IN GERMANY, BY APPLICATION, 2017–2025 (USD MILLION)
10.3.2 UK
10.3.2.1 Focus on the recycling of all lead-acid batteries is propelling the growth of the AGM battery market in the UK
TABLE 77 AGM BATTERY MARKET IN UK, BY TYPE, 2017–2025 (USD MILLION)
TABLE 78 AGM BATTERY MARKET IN UK, BY APPLICATION, 2017–2025 (USD MILLION)
10.3.3 FRANCE
10.3.3.1 UPS is one of the major applications driving the AGM battery market in France
TABLE 79 AGM BATTERY MARKET IN FRANCE, BY TYPE, 2017–2025 (USD MILLION)
TABLE 80 AGM BATTERY MARKET IN FRANCE, BY APPLICATION, 2017–2025 (USD MILLION)
10.3.4 REST OF EUROPE
TABLE 81 AGM BATTERY MARKET IN ROE, BY TYPE, 2017–2025 (USD MILLION)
TABLE 82 AGM BATTERY MARKET IN ROE, BY APPLICATION, 2017–2025 (USD MILLION)
10.4 APAC
FIGURE 36 APAC: SNAPSHOT OF THE AGM BATTERY MARKET
TABLE 83 AGM BATTERY MARKET IN APAC, BY END-USER, 2017–2025 (USD MILLION)
TABLE 84 AGM BATTERY MARKET IN APAC, BY TYPE, 2017–2025 (USD MILLION)
TABLE 85 AGM BATTERY MARKET IN APAC, BY APPLICATION, 2017–2025 (USD MILLION)
TABLE 86 AGM BATTERY MARKET IN APAC, BY COUNTRY, 2017–2025 (USD MILLION)
10.4.1 CHINA
10.4.1.1 AGM battery market is likely to witness growth in China, as it is the largest producer and consumer of lead
TABLE 87 AGM BATTERY MARKET IN CHINA, BY TYPE, 2017–2025 (USD MILLION)
TABLE 88 AGM BATTERY MARKET IN CHINA, BY APPLICATION, 2017–2025 (USD MILLION)
10.4.2 JAPAN
10.4.2.1 Increasing sales of lead-acid batteries for start-stop vehicles in Japan is driving the AGM battery market in the automotive industry
TABLE 89 AGM BATTERY MARKET IN JAPAN, BY TYPE, 2017–2025 (USD MILLION)
TABLE 90 AGM BATTERY MARKET IN JAPAN, BY APPLICATION, 2017–2025 (USD MILLION)
10.4.3 INDIA
10.4.3.1 Increasing deployment of off-grid solar systems in rural communities is leading to the growth of the AGM battery market
TABLE 91 AGM BATTERY MARKET IN INDIA, BY TYPE, 2017–2025 (USD MILLION)
TABLE 92 AGM BATTERY MARKET IN INDIA, BY APPLICATION, 2017–2025 (USD MILLION)
10.4.4 REST OF APAC
TABLE 93 AGM BATTERY MARKET IN ROAPAC, BY TYPE, 2017–2025 (USD MILLION)
TABLE 94 AGM BATTERY MARKET IN ROAPAC, BY APPLICATION, 2017–2025 (USD MILLION)
10.5 ROW
TABLE 95 AGM BATTERY MARKET IN ROW, BY END-USER, 2017–2025 (USD MILLION)
TABLE 96 AGM BATTERY MARKET IN ROW, BY TYPE, 2017–2025 (USD MILLION)
TABLE 97 AGM BATTERY MARKET IN ROW, BY APPLICATION, 2017–2025 (USD MILLION)
TABLE 98 AGM BATTERY MARKET IN ROW, BY REGION, 2017–2025 (USD MILLION)
10.5.1 MIDDLE EAST & AFRICA
10.5.1.1 UAE is expected to install infrastructure to boost the telecom sector
TABLE 99 AGM BATTERY MARKET IN MIDDLE EAST & AFRICA, BY TYPE, 2017–2025 (USD MILLION)
TABLE 100 AGM BATTERY MARKET IN MIDDLE EAST & AFRICA, BY APPLICATION, 2017–2025 (USD MILLION)
10.5.2 SOUTH AMERICA
10.5.2.1 Brazil to make massive investments in the telecom industry and data centers
TABLE 101 AGM BATTERY MARKET IN SOUTH AMERICA, BY TYPE, 2017–2025 (USD MILLION)
TABLE 102 AGM BATTERY MARKET IN SOUTH AMERICA, BY APPLICATION, 2017–2025 (USD MILLION)
11 COMPETITIVE LANDSCAPE (Page No. - 119)
11.1 OVERVIEW
11.2 MARKET RANKING ANALYSIS, 2018
FIGURE 37 AGM BATTERY MARKET: RANKING ANALYSIS (2018)
11.3 COMPETITIVE LEADERSHIP MAPPING
11.3.1 VISIONARY LEADERS
11.3.2 DYNAMIC DIFFERENTIATORS
11.3.3 INNOVATORS
11.3.4 EMERGING COMPANIES
FIGURE 38 AGM BATTERY MARKET (GLOBAL) COMPETITIVE LEADERSHIP MAPPING, 2018
11.4 COMPETITIVE SITUATIONS AND TRENDS
11.4.1 PRODUCT LAUNCHES AND DEVELOPMENTS
TABLE 103 PRODUCT LAUNCHES AND DEVELOPMENTS, 2018
11.4.2 EXPANSIONS, ACQUISITIONS, AND AGREEMENTS
TABLE 104 EXPANSIONS, ACQUISITIONS, AND AGREEMENTS, 2018–2019
12 COMPANY PROFILES (Page No. - 125)
12.1 KEY PLAYERS
(Business Overview, Products Offered, Recent Developments, SWOT Analysis, and MnM View)*
12.1.1 EXIDE TECHNOLOGIES
12.1.2 CLARIOS
12.1.3 POWER SONIC CORPORATION
12.1.4 ENERSYS
FIGURE 39 ENERSYS: COMPANY SNAPSHOT
12.1.5 EAST PENN MANUFACTURING COMPANY
12.1.6 C&D TECHNOLOGIES
12.1.7 PANASONIC INDUSTRY EUROPE
12.1.8 STORAGE BATTERY SYSTEMS
12.1.9 FULLRIVER BATTERY
12.1.10 UNIVERSAL POWER GROUP
* Business Overview, Products Offered, Recent Developments, SWOT Analysis, and MnM View might not be captured in case of unlisted companies.
12.2 RIGHT-TO-WIN
12.3 OTHER COMPANIES
12.3.1 BOSCH
12.3.2 CROWN BATTERY
12.3.3 GS BATTERY
12.3.4 CELLPOWER BATTERIES
12.3.5 FIAMM ENERGY TECHNOLOGY
12.3.6 B.B. BATTERY
12.3.7 CONCORDE BATTERY CORPORATION
12.3.8 LEOCH
12.3.9 VICTRON ENERGY
12.3.10 ROLLS BATTERY
12.3.11 VMAX USA
12.3.12 EAGLEPICHER TECHNOLOGIES
13 APPENDIX (Page No. - 156)
13.1 INSIGHTS OF INDUSTRY EXPERTS
13.2 DISCUSSION GUIDE
13.3 KNOWLEDGE STORE: MARKETSANDMARKETS’ SUBSCRIPTION PORTAL
13.4 AVAILABLE CUSTOMIZATIONS
13.5 RELATED REPORTS
13.6 AUTHOR DETAILS
The study involved 4 major activities in estimating the market size for AGM batteries. Exhaustive secondary research has been conducted to collect information on the market, peer market, and parent market. The validation of these findings and assumptions with industry experts across the value chain through primary research has been the next step. Both top-down and bottom-up approaches have been employed to estimate the complete market size. After that, market breakdown and data triangulation procedures have been used to estimate the market size of each segment and subsegment.
Secondary Research
In the secondary research process, various secondary sources have been referred to for identifying and collecting information for this study. Secondary sources include government sources; corporate filings (such as annual reports, investor presentations, and financial statements); and trade, business, and professional associations. The secondary data has been collected and analyzed to arrive at the overall market size, which has been validated further through primary research.
Primary Research
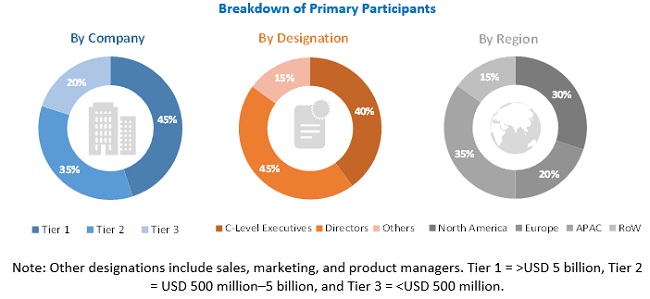
The AGM battery market comprises several stakeholders, such as associations and industrial bodies, pneumatic system manufacturers, pneumatic system distributors and providers, manufacturers, research organizations and consulting companies, and technology investors. Extensive primary research has been conducted after understanding and analyzing the market through secondary research. Several primary interviews have been conducted with market experts from both the demand- and supply-side vendors from across 4 regions—North America, Europe, APAC, and RoW. Approximately 20% of the primary interviews have been conducted with the demand side and 80% with the supply side. This primary data has been collected through questionnaires, emails, and telephonic interviews
To know about the assumptions considered for the study, download the pdf brochure
Market Size Estimation
Both top-down and bottom-up approaches have been used to estimate and validate the total size of the market. These methods have also been used extensively to estimate the size of various subsegments in the market. The following method has been used to estimate the market size:
Bottom-Up:
- The list of more than 30 companies offering AGM batteries was identified. Their offerings were mapped based on voltage, type, end user, and applications.
- After understanding the different types of AGM batteries offered by various manufacturers, based on the data gathered through primary and secondary sources, the market was categorized into different segments.
- To derive the global market, global shipments of each application that were considered in the scope of the report were tracked.
- A suitable penetration rate was assigned to shipment for each application to derive the total shipment volume of AGM batteries.
- Using the average selling price (ASP) of AGM batteries, we derived the market based on each application. The ASP of AGM battery was identified based on secondary sources and validated through primaries.
- For the projected market values for each application segment, the Y-o-Y was set to show a slow, growing, or steady growth in accordance with the actual growth rate of the application market.
- For the CAGR, the market trend analysis was carried out by understanding the industry penetration rate, and the demand for and supply of AGM batteries in different end-use industries.
- We also tracked the market through the data sanity method. The revenues of more than 30 key providers were analyzed through annual reports and press releases, which summed up to the overall market.
- For each company, a percentage is assigned to their overall revenue, and in a few cases, segmental revenue was derived from the AGM battery business. These percentages for each company were assigned based on the company’s product portfolio and its range of AGM battery offerings.
- The estimates at every level were verified and crosschecked by discussing with key opinion leaders, including CXOs, directors, and operation managers, and with domain experts in MarketsandMarkets.
- Various paid and unpaid information sources such as annual reports, press releases, white papers, and databases were studied.
Top-Down:
- The global market size of AGM batteries was estimated through data sanity of 30 major companies.
- Types of AGM batteries, their features and properties, and key applications served by all players in the market were studied to estimate and arrive at the percentage split of the segments.
- Different types of batteries and their penetration for end-use applications that use or are expected to implement AGM batteries in the near future were identified.
- The market split for AGM battery by voltage, type, end user, and application, based on secondary research, was estimated.
- The demand generated by companies operating in different application segments of the end-use application was analyzed.
- Ongoing and upcoming projects pertaining to the implementation of AGM batteries by end-use applications were tracked, and the market size was estimated based on these developments and other critical parameters.
- Multiple discussions with key opinion leaders across major companies involved in the development of AGM batteries and related components were conducted to validate the market split of individual voltage, type, end user, and application.
- Geographic splits were estimated using secondary sources based on factors such as the number of players in a specific country and region, and on the adoption and use cases of each battery type with regard to applications in the region.
Data Triangulation
After arriving at the overall market size through the process explained above, the total market has been split into several segments. To complete the overall market engineering process and arrive at the exact statistics for all segments, the data triangulation and market breakdown procedure have been employed wherever applicable. The data has been triangulated by studying various factors and trends from both demand- and supply-sides. Along with this, the market has been validated using both top-down and bottom-up approaches.
Report Objectives
- To describe and forecast the global market, in terms of value, by voltage, type, end user, and application
- To forecast the global AGM battery market, in terms of volume
- To describe and forecast the market, in terms of value, by region—North America, Europe, Asia Pacific (APAC), and the Rest of the World (RoW), along with their respective countries
- To provide detailed information regarding major factors influencing the growth of the market (drivers, restraints, opportunities, and challenges)
- To strategically analyze micromarkets with respect to individual growth trends, future prospects, and contributions to the total market
- To analyze opportunities in the market for various stakeholders by identifying high-growth segments of the market
- To strategically profile key players and comprehensively analyze their market shares and core competencies, along with detailing the competitive landscape for the market leaders
- To analyze various competitive developments such as partnerships, acquisitions, product developments, expansions, and SWOT analysis in the market
Available Customizations:
With the given market data, MarketsandMarkets offers customizations according to the specific requirements of a company. The following customization options are available for the report:
Company Information
- Detailed analysis and profiling of additional market players (up to 13)


Growth opportunities and latent adjacency in Absorbent Glass Mat (AGM) Battery Market