AdTech Market

AdTech Market by Offering (Software Tools/Platform (DSPs, SSPs, DMPs, Ad exchange, Ad networks), Services), Marketing Channel (Mobile Apps, Website, Social Media), Advertising type (Programmatic, Search, Display), Vertical and Region – Global Forecast to 2030

Report Code: TC 8842 Nov, 2023, by marketsandmarkets.com

The global AdTech Market is projected to grow from USD 579.4 billion in 2023 to USD 1,496.2 billion by 2030 at a compound annual growth rate (CAGR) of 14.5% during the forecast period. Due to various business drivers, the AdTech market is expected to grow significantly during the forecast period. The market is experiencing significant growth due to the increasing demand for data-informed marketing strategies. The growing popularity of audio streaming and podcasts for audio advertising and the proliferation of smartphones for greater mobile optimization and in-app advertising is also responsible for driving the market’s growth.

AdTech Market

To know about the assumptions considered for the study, Request for Free Sample Report

AdTech Market

To know about the assumptions considered for the study, download the pdf brochure

Market Dynamics

Driver: Proliferation of smartphones for greater mobile optimization and in-app advertising

The proliferation of smartphones, with their ubiquitous presence, has significantly bolstered the demand for AdTech solutions, particularly in the realm of mobile optimization and in-app advertising. As users increasingly rely on their mobile devices for various activities, advertisers must adopt a mobile-first approach, optimizing content and ad campaigns to provide a seamless and responsive user experience on smartphones. Simultaneously, in-app advertising has gained prominence, capitalizing on the high levels of user engagement within mobile applications. Advertisers are leveraging this contextually relevant advertising medium to reach and engage users, utilizing interactive ad formats and benefiting from the monetization opportunities it offers to app developers. In this mobile-centric landscape, programmatic mobile advertising further enhances efficiency and precision, enabling data-driven targeting and cross-device tracking, ensuring that ads are delivered consistently and effectively across mobile devices and platforms. There have been notable deals and investments in the in-app advertising space in recent years. For instance, in 2020, Unity Technologies acquired DeltaDNA, a player in real-time player management and game analytics, to enhance in-app advertising and personalization.

Restraints: Stringent privacy regulations and security concerns

Privacy regulations and security concerns collectively impede the growth of AdTech solutions in the market. Privacy regulations, like GDPR and CCPA, mandate stringent data collection and usage restrictions, requiring explicit user consent and limiting available data for targeted advertising. Simultaneously, security vulnerabilities pose significant risks, necessitating increased efforts and costs to secure sensitive user information. High-profile data breaches erode user trust and brand reputation, further complicating the AdTech landscape. Advertisers and AdTech providers must strike a delicate balance between regulatory compliance, data security, and effective advertising strategies to ensure the industry's sustainable growth. Privacy regulations and security concerns hinder the growth of AdTech solutions by imposing strict compliance requirements, reducing the availability of user data, and necessitating increased security measures.

Opportunity: Widespread adoption of AR and VR technologies for more interactive and immersive ad experiences

The widespread adoption of augmented reality (AR) and virtual reality (VR) is a transformative opportunity for AdTech solutions in the market. The growth of AR and VR is supported by data showing the increasing demand for immersive experiences. According to MarketsandMarkets, worldwide spending on AR and VR is forecasted to reach USD 25.1 billion in 2023, reflecting the significant market potential. AdTech solutions can harness this momentum to deliver captivating, interactive ad formats. Users are embracing AR and VR, with applications extending from gaming to education, training, and beyond. This opens the door for AdTech to offer highly engaging and immersive ad experiences, allowing users to interact with products, services, and brand content in a virtual space. The opportunities are vast, from showcasing products in a three-dimensional space to creating interactive narratives that immerse users in brand stories. This level of engagement not only captures user attention but also fosters a deeper connection with brands. By integrating AR and VR into advertising campaigns, AdTech solutions stand to enhance user experiences and offer advertisers an exciting avenue for reaching and resonating with their target audiences, driving the continued adoption of AdTech solutions in the quest for more impactful advertising.

Challenge: Presence of Ad-Blocking Bypass Solutions

Ad-blocking bypass solutions create a multifaceted challenge for adopting AdTech solutions in the market. These tools disrupt user experience and trust, as users employ ad-blockers to reduce intrusive ads. The ongoing battle between ad-blockers and bypass solution developers results in reduced effectiveness for campaigns targeting bypass users, often leading to lower engagement and conversion rates. Privacy concerns, negative brand image, legal and ethical considerations, and resource-intensive development further complicate the landscape. Users' resistance to advertising and the potential backlash associated with bypass attempts add to the challenge, demanding a delicate balance between user experience, privacy, and ethical practices. Advertisers and AdTech providers must carefully navigate this complex environment to preserve user trust and ensure the effective adoption of AdTech solutions.

AdTech Market Ecosystem

AdTech Market

By offering the demand Side Platforms (DSP) segment to account for a larger market size during forecast period

The AdTech solutions include Demand-Side Platforms (DSP), Supply-Side Platforms (SSP), Ad Networks, Data Management Platforms (DMP), Agency Trading Desks (ATD), Ad Exchange Platforms, Ad Creative and Production Tools, Ad Analytics and Attribution Platforms, Ad Verification and Brand Safety and other solutions (Data Analytics and Insights, Ad Fraud Prevention, Compliance and Policy Management and CRM Integration). Factors propelling the growth of DSPs in the AdTech market are the surge in digital advertising spending, the proliferation of mobile devices, and the increasing emphasis on data-driven advertising strategies are some of the driving factors. Additionally, the shift toward programmatic advertising continues to be a dominant trend, with advertisers seeking more efficient and automated ways to reach their target audiences.

By advertising type, native advertising registers the highest CAGR during the forecast period

The native advertising segment is projected to grow more during the forecast period. Native ads, being more integrated and less obtrusive, offer a way to overcome this challenge. Advertisers are increasingly seeking ways to improve engagement and build brand loyalty, and native advertising provides a means to do so by delivering content that's relevant and appealing to the audience. As mobile usage continues to grow, native ads are being adapted for mobile devices to ensure a seamless user experience. Native advertising platforms are also focusing on enhancing the tracking and measurement capabilities to provide advertisers with better insights into their campaign performance.

By verticals, BFSI holds the highest CAGR during the forecast period

The increased competition among financial institutions is one of the factors. Banks and insurance companies are constantly looking for ways to differentiate themselves in a crowded market, and AdTech plays a crucial role in helping them target the right audience with personalized offers and services. This competitive landscape is pushing BFSI companies to invest in advanced advertising technologies and services. AdTech solutions enable these organizations to analyze vast amounts of data to understand customer behavior, preferences, and risk profiles.

By region,  Asia Pacific holds the highest CAGR during the forecast period

From a technological perspective, the Asia Pacific AdTech market is enthusiastically embracing cutting-edge innovations. Markets such as South Korea and Japan are witnessing a flourishing trend in influencer marketing, while China's e-commerce giants are pioneering novel advertising strategies, including live-stream shopping. As consumer behavior undergoes transformation, AdTech firms are devising strategies to cater to the diverse preferences and behaviors prevalent across the Asia Pacific region.

AdTech Market Size, and Share

Key Market Players

The AdTech solution and service providers have implemented various types of organic and inorganic growth strategies, such as new product launches, product upgrades, partnerships, and agreements, business expansions, and mergers and acquisitions to strengthen their offerings in the market. Some major players in the AdTech market include Meta (US), Google (US), Amazon (US), Adobe (US), Yahoo (US), Zeta (US), Microsoft (US), Celtra (US), Basis Technologies (US), Luna (US), NextRoll (US), Quantcast (US), Criteo (France), Affle (India), InMobi (India), Demandbase (US), The Trade Desk (US), Adform (Denmark), Equativ (France), Tremor International (Israel), Innovid (US), Mediaocean (US), DoubleVerify (US), Magnite (US), Copy.ai (US), Nickelytics (US), C Wire (Switzerland), Cavai (Norway), Titan Digital (US), Glimpse Protocol (UK), StackAdapt (Canada), Cosmose AI (Singapore), Vidsy (UK), and Linkby (Australia).

Get online access to the report on the World's First Market Intelligence Cloud

  • Easy to Download Historical Data & Forecast Numbers
  • Company Analysis Dashboard for high growth potential opportunities
  • Research Analyst Access for customization & queries
  • Competitor Analysis with Interactive dashboard
  • Latest News, Updates & Trend analysis
Request Sample

Scope of the Report

Report Metrics

Details

Market size available for years

2019–2030

Base year considered

2022

Forecast period

2023–2030

Forecast units

USD (Billion)

Segments covered

Offering, Advertising Type, Advertising Media,  Vertical, and Region

Geographies covered

North America, Asia Pacific, Europe, Middle East & Africa, and Latin America

Companies covered

Meta (US), Google (US), Amazon (US), Adobe (US), Yahoo (US), Zeta (US), Microsoft (US), Celtra (US), Basis Technologies (US), Luna (US), NextRoll (US), Quantcast (US), Criteo (France), Affle (India), InMobi (India), Demandbase (US), The Trade Desk (US), Adform (Denmark), Equativ (France), Tremor International (Israel), Innovid (US), Mediaocean (US), DoubleVerify (US), Magnite (US), Copy.ai (US), Nickelytics (US), C Wire (Switzerland), Cavai (Norway), Titan Digital (US), Glimpse Protocol (UK), StackAdapt (Canada), Cosmose AI (Singapore), Vidsy (UK), and Linkby (Australia).

This research report categorizes the AdTech market based on offering, advertising type, advertising media, vertical, and region.

By Offering:
  • Solutions
    • Demand-Side Platform (DSP)
    • Supply-Side Platform (SSP)
    • Ad Networks
    • Data Management Platform (DMP)
    • Agency Trading Desks (ATD)
    • Ad Exchange Platform
    • Ad Creative and Production Tools
    • Ad Analytics and Attribution Platforms
    • Ad Verification and Brand Safety
    • Other solutions
  • Solutions by Deployment Mode
    • Cloud
    • On-premise
  • Solutions by Mode of Interface
    • Desktop
    • Mobile
  • Services
    • Professional Services
      • Training & Consulting
      • System Integration & Implementation
      • Support & Maintenance
    • Managed Services
By Advertising Type:
  • Programmatic Advertising
  • Search Advertising
  • Display Advertising
  • Mobile Advertising
  • Email Advertising
  • Native Advertising
  • Other Advertising Type
By Advertising Media:
  • Television Advertising
  • Radio Advertising
  • Print Advertising
    • Magazines
    • Newspapers
  • Outdoor Advertising
    • Public Signs
    • Billboards
    • Posters
  • Digital Advertising
    • Display Advertising
    • Mobile Advertising
    • Search Engine Advertising
    • Social Media Advertising
By Vertical:
  • BFSI
  • Media & Entertainment
  • Healthcare & Life Sciences
  • Retail & eCommerce
  • Manufacturing
  • Transportation & Logistics
  • Food & Beverages
  • Travel & Hospitality
  • Telecom
  • Others Verticals
By Region:
  • North America
    • US
    • Canada
  • Europe
    • UK
    • Germany
    • France
    • Italy
    • Spain
    • Rest of Europe
  • Asia Pacific
    • China
    • India
    • Japan
    • Australia and New Zealand (ANZ)
    • South Korea
    • ASEAN Countries
    • Rest of Asia Pacific
  • Middle East & Africa
    • UAE
    • Saudi Arabia
    • South Africa
    • Qatar
    • Rest of the Middle East & Africa
  • Latin America
    • Brazil
    • Mexico
    • Argentina
    • Rest of Latin America

Recent Developments:

  • In August 2023, Meta acquired Kustomer, a customer relationship management (CRM) platform, for USD 1 billion. This acquisition is seen as a way for Meta to expand its advertising business to include more customer data.
  • In August 2023, Amazon Ads launched a Household Reach and Frequency measurement reporting capability, which allowed Streaming TV (STV) advertisers to measure the effectiveness of their STV campaigns more accurately and to plan and optimize their campaigns more effectively. With this release, advertisers can now access reach and frequency insights both at the viewer and household level.
  • In August 2023, Zeta launched a Snowflake Native App, Customer Growth Intelligence (CGI), on Snowflake Marketplace. This new offering enhances and extends the deep integration between the two companies, sharing a vision to reinvent how enterprises ingest, store, synthesize, surface, and activate consumer data to make complex solutions simpler for marketers.
  • In July 2023, Meta and Microsoft partnered to bring Meta's advertising platform to Microsoft's cloud computing platform, Azure. This partnership will allow Meta to reach a wider audience of advertisers and provide them with more data and insights.
  • In June 2023, Adobe unveiled Generative Recolor (beta), the first integration of Adobe Firefly in Adobe Illustrator, enabling designers to quickly experiment with colors using simple text prompts. The new release advances Adobe's vision of empowering creators of every skill level with Firefly as a creative co-pilot, bringing their visions to life at the speed of imagination.
  • In October 2022, Yahoo announced a strong advanced TV (ATV) partnership with DIRECTV Advertising to provide access to DIRECTV’s set-top box (STB) data, unlocking new value for connected TV (CTV) buyers. With this expanded partnership, Yahoo’s demand-side platform (DSP) customers can now activate TV usage data from millions of DIRECTV households to optimize the planning, activation, and measurement of digital campaigns across DIRECTV and non-DIRECTV inventory.
  • In September 2022, Yahoo launched Yahoo Member Connect, a cutting-edge media network solution that helps leading brands add to their core business. Yahoo Member Connect supports all types of businesses looking to build and scale their own media networks – enabling them to monetize data and media assets, engage with customers at scale, and offer rich ad experiences with quality content.

Frequently Asked Questions (FAQ):

To speak to our analyst for a discussion on the above findings, click Speak to Analyst

TABLE OF CONTENTS
 
1 INTRODUCTION (Page No. - 40)
    1.1 STUDY OBJECTIVES 
    1.2 MARKET DEFINITION 
    1.3 STUDY SCOPE 
           1.3.1 MARKET SEGMENTATION
           1.3.2 INCLUSIONS AND EXCLUSIONS
           1.3.3 REGIONS COVERED
    1.4 YEARS CONSIDERED 
    1.5 CURRENCY CONSIDERED 
    1.6 STAKEHOLDERS 
 
2 RESEARCH METHODOLOGY (Page No. - 45)
    2.1 RESEARCH DATA 
           FIGURE 1 MARKET: RESEARCH DESIGN
           2.1.1 SECONDARY DATA
           2.1.2 PRIMARY DATA
                    TABLE 1 PRIMARY INTERVIEWS
                    2.1.2.1 Breakdown of primary interviews
                    2.1.2.2 Key industry insights
    2.2 DATA TRIANGULATION 
           FIGURE 2 DATA TRIANGULATION
    2.3 MARKET SIZE ESTIMATION 
           FIGURE 3 MARKET: TOP-DOWN AND BOTTOM-UP APPROACHES
           2.3.1 TOP-DOWN APPROACH
           2.3.2 BOTTOM-UP APPROACH
                    FIGURE 4 MARKET SIZE ESTIMATION METHODOLOGY – APPROACH 1, BOTTOM-UP (SUPPLY-SIDE): COLLECTIVE REVENUE FROM ALL SOLUTIONS/SERVICES
                    FIGURE 5 MARKET SIZE ESTIMATION METHODOLOGY – APPROACH 2, BOTTOM-UP (SUPPLY-SIDE): COLLECTIVE REVENUE FROM ALL SOLUTIONS/SERVICES
                    FIGURE 6 MARKET SIZE ESTIMATION METHODOLOGY – APPROACH 3, BOTTOM-UP (SUPPLY-SIDE): COLLECTIVE REVENUE FROM ALL SOLUTIONS/SERVICES
                    FIGURE 7 MARKET SIZE ESTIMATION METHODOLOGY – APPROACH 4, BOTTOM-UP (DEMAND-SIDE): SHARE OF ADTECH SOLUTIONS AND SERVICES THROUGH OVERALL SPENDING
    2.4 MARKET FORECAST 
           TABLE 2 FACTOR ANALYSIS
    2.5 RESEARCH ASSUMPTIONS 
    2.6 LIMITATIONS AND RISK ASSESSMENT 
    2.7 RECESSION IMPACT 
           TABLE 3 RECESSION IMPACT
 
3 EXECUTIVE SUMMARY (Page No. - 58)
    TABLE 4 MARKET SIZE AND GROWTH RATE, 2019–2022 (USD BILLION, Y-O-Y %) 
    TABLE 5 MARKET SIZE AND GROWTH RATE, 2023–2030 (USD BILLION, Y-O-Y %) 
    FIGURE 8 SOLUTIONS SEGMENT TO DOMINATE MARKET IN 2023 
    FIGURE 9 DSPS SEGMENT TO ACCOUNT FOR LARGEST SHARE IN 2023 
    FIGURE 10 ON-PREMISES SEGMENT TO DOMINATE MARKET IN 2023 
    FIGURE 11 DESKTOP SEGMENT TO DOMINATE ADTECH SOLUTIONS MARKET IN 2023 
    FIGURE 12 PROFESSIONAL SERVICES SEGMENT TO DOMINATE MARKET IN 2023 
    FIGURE 13 SYSTEM INTEGRATION & IMPLEMENTATION SEGMENT TO LEAD MARKET IN 2023 
    FIGURE 14 PROGRAMMATIC ADVERTISING SEGMENT TO ACCOUNT FOR LARGEST MARKET IN 2023 
    FIGURE 15 TELEVISION ADVERTISING SEGMENT TO ACCOUNT FOR LARGEST SHARE IN 2023 
    FIGURE 16 BFSI SEGMENT TO GROW AT HIGHEST CAGR IN 2023 
    FIGURE 17 ASIA PACIFIC TO GROW AT HIGHEST CAGR DURING FORECAST PERIOD 
 
4 PREMIUM INSIGHTS (Page No. - 64)
    4.1 ATTRACTIVE OPPORTUNITIES FOR PLAYERS IN ADTECH  MARKET 
           FIGURE 18 INCREASING DEMAND FOR DATA-INFORMED MARKETING STRATEGIES TO DRIVE MARKET GROWTH
    4.2 IMPACT OF RECESSION ON MARKET 
           FIGURE 19 MARKET TO WITNESS MINOR DECLINE IN Y-O-Y GROWTH IN 2023
    4.3 MARKET: TOP THREE ADVERTISING TYPES 
           FIGURE 20 NATIVE ADVERTISING SEGMENT TO GROW AT HIGHEST CAGR DURING FORECAST PERIOD
    4.4 NORTH AMERICA: MARKET, BY OFFERING AND KEY VERTICAL 
           FIGURE 21 SOLUTIONS AND MEDIA & ENTERTAINMENT SEGMENTS TO ACCOUNT FOR SIGNIFICANT SHARE IN 2023
    4.5 MARKET, BY REGION 
           FIGURE 22 NORTH AMERICA TO ACCOUNT FOR LARGEST SHARE IN 2023
 
5 MARKET OVERVIEW AND INDUSTRY TRENDS (Page No. - 67)
    5.1 INTRODUCTION 
    5.2 MARKET DYNAMICS 
           FIGURE 23 ADTECH MARKET: DRIVERS, RESTRAINTS, OPPORTUNITIES, AND CHALLENGES
           5.2.1 DRIVERS
                    5.2.1.1 Increasing demand for data-informed marketing strategies
                    5.2.1.2 Growing popularity of audio streaming and podcasts for advertising
                    5.2.1.3 Proliferation of smartphones for greater mobile optimization and in-app advertising
           5.2.2 RESTRAINTS
                    5.2.2.1 Stringent privacy regulations and security concerns
                    5.2.2.2 Inaccurate data quality and accuracy
           5.2.3 OPPORTUNITIES
                    5.2.3.1 Rapid adoption of AI and ML technologies for hyper-personalized user experience
                    5.2.3.2 Focus on voice-activated ads and conversational advertising
                    5.2.3.3 Widespread adoption of AR and VR technologies for more interactive and immersive ad experiences
           5.2.4 CHALLENGES
                    5.2.4.1 Presence of ad-blocking bypass solutions
                    5.2.4.2 Lack of standardized viewability metrics
    5.3 CASE STUDIES 
           5.3.1 UNITED TRUCK DRIVING SCHOOL IMPLEMENTED TITAN DIGITAL’S SERVICES TO CONTROL ITS ADVERTISING BUDGET
           5.3.2 TITAN DIGITAL’S TEAM DEVELOPED 3-STEP PLAN TO HELP WHS BECOME MORE COMPETITIVE
           5.3.3 CANVAS WORLDWIDE IMPLEMENTED INNOVID'S SOLUTIONS TO SAVE TIME AND REDUCE RISK OF HUMAN ERROR
           5.3.4 DRIVES LIFT-IN TUNE-UP WORKED WITH TREMOR VIDEO’S TR.LY CREATIVE STUDIO TO DRIVE MOST INCREMENTAL TUNE-IN AT LOWEST COST PER TUNE-IN
           5.3.5 FAN CONTROLLED FOOTBALL PARTNERED WITH EQUATIV TO MANAGE AND INCREASE AD INVENTORY
           5.3.6 AMNET FRANCE DEPLOYED EQUATIV’S SOLUTIONS TO DELIVER BEST-PERFORMING VIDEO INVENTORY ACROSS FOUR TARGETED MARKETS
           5.3.7 RAZER PARTNERED WITH EQUATIV TO REACH GAMERS WITH EFFECTIVE ADVERTISING
           5.3.8 DSP ASSET MANAGERS PARTNERED WITH PURETECH DIGITAL AND INMOBI TO LEVERAGE ITS AWARENESS AMPLIFICATION EFFORTS
           5.3.9 SALAM PARTNERED WITH INMOBI TO DEVELOP INNOVATIVE RICH MEDIA CREATIVE WITH FINGERPRINT SENSOR UNLOCK TO COMPLEMENT STANDARD BANNERS
           5.3.10 STARBUCKS AND ARLA FOODS USED QUANTCAST’S CTV ADVERTISING PLATFORM TO REACH THEIR CORE AUDIENCE AND OPTIMIZE CAMPAIGNS IN REAL-TIME
           5.3.11 SKY AND MEDIACOM PARTNERED WITH QUANTCAST TO ACTIVATE COOKIELESS INVENTORY AND REACH INACCESSIBLE CONSUMERS
    5.4 TARIFF AND REGULATORY LANDSCAPE 
           5.4.1 REGULATORY BODIES, GOVERNMENT AGENCIES, AND OTHER ORGANIZATIONS
                    5.4.1.1 North America
                               TABLE 6 NORTH AMERICA: LIST OF REGULATORY BODIES, GOVERNMENT AGENCIES, AND OTHER ORGANIZATIONS
                    5.4.1.2 Europe
                               TABLE 7 EUROPE: LIST OF REGULATORY BODIES, GOVERNMENT AGENCIES, AND OTHER ORGANIZATIONS
                    5.4.1.3 Asia Pacific
                               TABLE 8 ASIA PACIFIC: LIST OF REGULATORY BODIES, GOVERNMENT AGENCIES, AND OTHER ORGANIZATIONS
                    5.4.1.4 Middle East & Africa
                               TABLE 9 MIDDLE EAST & AFRICA: LIST OF REGULATORY BODIES, GOVERNMENT AGENCIES, AND OTHER ORGANIZATIONS
                    5.4.1.5 Latin America
                               TABLE 10 LATIN AMERICA: LIST OF REGULATORY BODIES, GOVERNMENT AGENCIES, AND OTHER ORGANIZATIONS
    5.5 ADTECH MARKET ARCHITECTURE 
           FIGURE 24 MARKET ARCHITECTURE
    5.6 ECOSYSTEM ANALYSIS 
           TABLE 11 ROLE OF PLAYERS IN MARKET ECOSYSTEM
           FIGURE 25 ECOSYSTEM MAP
    5.7 PATENT ANALYSIS 
           5.7.1 METHODOLOGY
           5.7.2 PATENTS FILED, BY DOCUMENT TYPE
                    TABLE 12 PATENTS FILED, 2013–2023
           5.7.3 INNOVATION AND PATENT APPLICATIONS
                    FIGURE 26 NUMBER OF PATENTS GRANTED, 2013–2023
                    5.7.3.1 Top applicants
                               FIGURE 27 TOP TEN PATENT APPLICANTS, 2013–2023
                               TABLE 13 TOP 20 PATENT OWNERS IN ADTECH MARKET, 2013–2023
                               TABLE 14 LIST OF PATENTS IN MARKET, 2023
                               FIGURE 28 REGIONAL ANALYSIS OF PATENTS GRANTED, 2023
    5.8 SUPPLY CHAIN ANALYSIS 
           FIGURE 29 MARKET: SUPPLY CHAIN ANALYSIS
    5.9 FUTURE DIRECTION OF MARKET LANDSCAPE 
           5.9.1 TECHNOLOGY ROADMAP FOR MARKET UNTIL 2030
                    FIGURE 30 TECHNOLOGY ROADMAP FOR MARKET UNTIL 2030
                    TABLE 15 SHORT-TERM ROADMAP, 2023–2025
                    TABLE 16 MID-TERM ROADMAP, 2026–2028
                    TABLE 17 LONG-TERM ROADMAP, 2029–2030
    5.10 PRICING ANALYSIS 
           5.10.1 AVERAGE SELLING PRICE TRENDS OF KEY PLAYERS, BY OFFERING
                    FIGURE 31 AVERAGE SELLING PRICE TRENDS OF KEY COMPANIES
           5.10.2 INDICATIVE PRICING ANALYSIS, BY ADTECH VENDOR
                    TABLE 18 INDICATIVE PRICING ANALYSIS, BY ADTECH VENDORS
    5.11 BRIEF HISTORY OF MARKET 
                    FIGURE 32 ADTECH MARKET EVOLUTION
    5.12 TRENDS/DISRUPTIONS IMPACTING BUYERS/CUSTOMERS 
                    FIGURE 33 TRENDS/DISRUPTIONS IMPACTING BUYERS/CUSTOMERS
    5.13 PORTER’S FIVE FORCES ANALYSIS 
                    FIGURE 34 PORTER’S FIVE FORCES ANALYSIS
           5.13.1 THREAT OF NEW ENTRANTS
           5.13.2 THREAT OF SUBSTITUTES
           5.13.3 BARGAINING POWER OF SUPPLIERS
           5.13.4 BARGAINING POWER OF BUYERS
           5.13.5 INTENSITY OF COMPETITIVE RIVALRY
    5.14 KEY CONFERENCES AND EVENTS 
                    TABLE 19 DETAILED LIST OF KEY CONFERENCES AND EVENTS, 2023–2024
    5.15 KEY STAKEHOLDERS AND BUYING CRITERIA 
           5.15.1 KEY STAKEHOLDERS IN BUYING PROCESS
                    FIGURE 35 INFLUENCE OF STAKEHOLDERS ON BUYING PROCESS FOR TOP THREE VERTICALS
                    TABLE 20 INFLUENCE OF STAKEHOLDERS ON BUYING PROCESS FOR TOP THREE VERTICALS
           5.15.2 BUYING CRITERIA
                    FIGURE 36 KEY BUYING CRITERIA FOR TOP THREE VERTICALS
                    TABLE 21 KEY BUYING CRITERIA FOR TOP THREE VERTICALS
    5.16 TECHNOLOGY ANALYSIS 
           5.16.1 KEY TECHNOLOGIES
                    5.16.1.1 Artificial intelligence and machine learning (AI and ML)
                    5.16.1.2 Big data
                    5.16.1.3 Augmented reality (AR) and virtual reality (VR)
                    5.16.1.4 Blockchain
           5.16.2 ADJACENT TECHNOLOGIES
                    5.16.2.1 IoT
                    5.16.2.2 Ad serving
                    5.16.2.3 Web analytics
                    5.16.2.4 Marketing automation
    5.17 BUSINESS MODEL ANALYSIS 
           5.17.1 SUPPLY SIDE
           5.17.2 DEMAND SIDE
 
6 ADTECH MARKET, BY OFFERING (Page No. - 109)
    6.1 INTRODUCTION 
           6.1.1 OFFERINGS: MARKET DRIVERS
                    FIGURE 37 SERVICES SEGMENT TO REGISTER HIGHER CAGR DURING FORECAST PERIOD
                    TABLE 22 MARKET, BY OFFERING, 2019–2022 (USD BILLION)
                    TABLE 23 MARKET, BY OFFERING, 2023–2030 (USD BILLION)
    6.2 SOLUTIONS 
           FIGURE 38 DATA MANAGEMENT PLATFORMS (DMPS) SEGMENT TO GROW AT HIGHEST CAGR DURING FORECAST PERIOD
           TABLE 24 MARKET, BY SOLUTION, 2019–2022 (USD BILLION)
           TABLE 25 MARKET, BY SOLUTION, 2023–2030 (USD BILLION)
           6.2.1 DEMAND-SIDE PLATFORMS (DSPS)
                    6.2.1.1 Increasing emphasis on data-driven advertising strategies to propel growth
                               TABLE 26 DSPS: MARKET, BY REGION, 2019–2022 (USD BILLION)
                               TABLE 27 DSPS: MARKET, BY REGION, 2023–2030 (USD BILLION)
           6.2.2 SUPPLY-SIDE PLATFORMS (SSPS)
                    6.2.2.1 Rising popularity of video advertising to drive demand for SSPs
                               TABLE 28 SSPS: ADTECH MARKET, BY REGION, 2019–2022 (USD BILLION)
                               TABLE 29 SSPS: MARKET, BY REGION, 2023–2030 (USD BILLION)
           6.2.3 AD NETWORKS
                    6.2.3.1 Need to facilitate efficient distribution of advertisements across digital platforms to drive market
                               TABLE 30 AD NETWORKS: MARKET, BY REGION, 2019–2022 (USD BILLION)
                               TABLE 31 AD NETWORKS: MARKET, BY REGION, 2023–2030 (USD BILLION)
           6.2.4 DATA MANAGEMENT PLATFORMS (DMPS)
                    6.2.4.1 Focus on developing cross-device targeting capabilities to boost growth
                               TABLE 32 DMPS: MARKET, BY REGION, 2019–2022 (USD BILLION)
                               TABLE 33 DMPS: MARKET, BY REGION, 2023–2030 (USD BILLION)
           6.2.5 AGENCY TRADING DESKS (ATDS)
                    6.2.5.1 Emergence of new programmatic advertising for flexible and controlled solutions to drive market
                               TABLE 34 ATDS: MARKET, BY REGION, 2019–2022 (USD BILLION)
                               TABLE 35 ATDS: MARKET, BY REGION, 2023–2030 (USD BILLION)
           6.2.6 AD EXCHANGE PLATFORMS
                    6.2.6.1 Rising advancements in multiple ad exchanging platforms to fuel growth
                               TABLE 36 AD EXCHANGE PLATFORMS: ADTECH MARKET, BY REGION, 2019–2022 (USD BILLION)
                               TABLE 37 AD EXCHANGE PLATFORMS: MARKET, BY REGION, 2023–2030 (USD BILLION)
           6.2.7 AD CREATIVE AND PRODUCTION TOOLS
                    6.2.7.1 Focus on creating more effective and engaging ads to boost demand for ad creative and production tools
                               TABLE 38 AD CREATIVE AND PRODUCTION TOOLS: MARKET, BY REGION, 2019–2022 (USD BILLION)
                               TABLE 39 AD CREATIVE AND PRODUCTION TOOLS: MARKET, BY REGION, 2023–2030 (USD BILLION)
           6.2.8 AD ANALYTICS AND ATTRIBUTION PLATFORMS
                    6.2.8.1 Demand for leveraging advanced targeting options, such as geofencing and contextual advertising, to bolster growth
                               TABLE 40 AD ANALYTICS AND ATTRIBUTION PLATFORMS: MARKET, BY REGION, 2019–2022 (USD BILLION)
                               TABLE 41 AD ANALYTICS AND ATTRIBUTION PLATFORMS: MARKET, BY REGION, 2023–2030 (USD BILLION)
           6.2.9 AD VERIFICATION AND BRAND SAFETY
                    6.2.9.1 Use of ML and NLP to improve ad targeting within appropriate contexts to encourage market expansion
                               TABLE 42 AD VERIFICATION AND BRAND SAFETY: MARKET, BY REGION, 2019–2022 (USD BILLION)
                               TABLE 43 AD VERIFICATION AND BRAND SAFETY: ADTECH MARKET, BY REGION, 2023–2030 (USD BILLION)
           6.2.10 OTHER SOLUTIONS
                    TABLE 44 OTHER SOLUTIONS: MARKET, BY REGION, 2019–2022 (USD BILLION)
                    TABLE 45 OTHER SOLUTIONS: MARKET, BY REGION, 2023–2030 (USD BILLION)
    6.3 SERVICES 
           FIGURE 39 MANAGED SERVICES SEGMENT TO GROW AT HIGHER CAGR DURING FORECAST PERIOD
           TABLE 46 MARKET, BY SERVICE, 2019–2022 (USD BILLION)
           TABLE 47 MARKET, BY SERVICE, 2023–2030 (USD BILLION)
           6.3.1 PROFESSIONAL SERVICES
                    FIGURE 40 TRAINING & CONSULTING SERVICES TO REGISTER HIGHEST CAGR DURING FORECAST PERIOD
                    TABLE 48 MARKET, BY PROFESSIONAL SERVICE, 2019–2022 (USD BILLION)
                    TABLE 49 MARKET, BY PROFESSIONAL SERVICE, 2023–2030 (USD BILLION)
                    TABLE 50 PROFESSIONAL SERVICES: ADTECH MARKET, BY REGION, 2019–2022 (USD BILLION)
                    TABLE 51 PROFESSIONAL SERVICES: MARKET, BY REGION, 2023–2030 (USD BILLION)
                    6.3.1.1 Training & consulting
                               6.3.1.1.1 Strong emphasis on empowering organizations to implement and optimize AdTech solutions to boost growth
                               TABLE 52 TRAINING & CONSULTING SERVICES: MARKET, BY REGION, 2019–2022 (USD BILLION)
                               TABLE 53 TRAINING & CONSULTING SERVICES: MARKET, BY REGION, 2023–2030 (USD BILLION)
                    6.3.1.2 System integration & implementation
                               6.3.1.2.1 Rising complexity of modern AdTech ecosystem to drive demand for system integration & implementation services
                               TABLE 54 SYSTEM INTEGRATION & IMPLEMENTATION SERVICES: ADTECH MARKET, BY REGION, 2019–2022 (USD BILLION)
                               TABLE 55 SYSTEM INTEGRATION & IMPLEMENTATION SERVICES: MARKET, BY REGION, 2023–2030 (USD BILLION)
                    6.3.1.3 Support & maintenance
                               6.3.1.3.1 Need to minimize downtime and technical issues and provide problem resolution to fuel growth
                               TABLE 56 SUPPORT & MAINTENANCE SERVICES: MARKET, BY REGION, 2019–2022 (USD BILLION)
                               TABLE 57 SUPPORT & MAINTENANCE SERVICES: MARKET, BY REGION, 2023–2030 (USD BILLION)
           6.3.2 MANAGED SERVICES
                    6.3.2.1 Need for businesses to efficiently navigate complexities of digital advertising to drive popularity of managed services
                               TABLE 58 MANAGED SERVICES: MARKET, BY REGION, 2019–2022 (USD BILLION)
                               TABLE 59 MANAGED SERVICES: MARKET, BY REGION, 2023–2030 (USD BILLION)
    6.4 ADTECH SOLUTIONS MARKET, BY DEPLOYMENT MODE 
           FIGURE 41 ON-PREMISES SEGMENT TO GROW AT HIGHER CAGR DURING FORECAST PERIOD
           TABLE 60 ADTECH SOLUTIONS MARKET, BY DEPLOYMENT MODE, 2019–2022 (USD BILLION)
           TABLE 61 ADTECH SOLUTIONS MARKET, BY DEPLOYMENT MODE, 2023–2030 (USD BILLION)
           6.4.1 CLOUD
                    6.4.1.1 Strong emphasis on protecting user data and ensuring compliance to bolster growth
                               TABLE 62 CLOUD: ADTECH SOLUTIONS MARKET, BY REGION, 2019–2022 (USD BILLION)
                               TABLE 63 CLOUD: ADTECH SOLUTIONS MARKET, BY REGION, 2023–2030 (USD BILLION)
           6.4.2 ON-PREMISES
                    6.4.2.1 Focus on providing direct control over configurations and data-handling practices to drive growth
                               TABLE 64 ON-PREMISES: ADTECH SOLUTIONS MARKET, BY REGION, 2019–2022 (USD BILLION)
                               TABLE 65 ON-PREMISES: ADTECH SOLUTIONS MARKET, BY REGION, 2023–2030 (USD BILLION)
    6.5 ADTECH SOLUTIONS MARKET, BY MODE OF INTERFACE 
           FIGURE 42 MOBILE SEGMENT TO GROW AT HIGHER CAGR DURING FORECAST PERIOD
           TABLE 66 ADTECH SOLUTIONS MARKET, BY MODE OF INTERFACE, 2019–2022 (USD BILLION)
           TABLE 67 ADTECH SOLUTIONS MARKET, BY MODE OF INTERFACE, 2023–2030 (USD BILLION)
           6.5.1 DESKTOP
                    6.5.1.1 Precise ad targeting and efficient ad placements to accelerate market
                               TABLE 68 DESKTOP: ADTECH SOLUTIONS MARKET, BY REGION, 2019–2022 (USD BILLION)
                               TABLE 69 DESKTOP: ADTECH SOLUTIONS MARKET, BY REGION, 2023–2030 (USD BILLION)
           6.5.2 MOBILE
                    6.5.2.1 Demand for responsive and engaging mobile ads that seamlessly integrate into apps to boost market
                               TABLE 70 MOBILE: ADTECH SOLUTIONS MARKET, BY REGION, 2019–2022 (USD BILLION)
                               TABLE 71 MOBILE: ADTECH SOLUTIONS MARKET, BY REGION, 2023–2030 (USD BILLION)
 
7 ADTECH MARKET, BY ADVERTISING TYPE (Page No. - 137)
    7.1 INTRODUCTION 
           7.1.1 ADVERTISING TYPES: MARKET DRIVERS
                    FIGURE 43 NATIVE ADVERTISING SEGMENT TO REGISTER HIGHEST CAGR DURING FORECAST PERIOD
                    TABLE 72 MARKET, BY ADVERTISING TYPE, 2019–2022 (USD BILLION)
                    TABLE 73 MARKET, BY ADVERTISING TYPE, 2023–2030 (USD BILLION)
    7.2 PROGRAMMATIC ADVERTISING 
           7.2.1 EMPHASIS ON AUTOMATING TASKS INVOLVED IN BUYING AND SELLING AD SPACE TO BOLSTER GROWTH
                    TABLE 74 PROGRAMMATIC ADVERTISING: MARKET, BY REGION, 2019–2022 (USD BILLION)
                    TABLE 75 PROGRAMMATIC ADVERTISING: MARKET, BY REGION, 2023–2030 (USD BILLION)
    7.3 SEARCH ADVERTISING 
           7.3.1 HIGH TARGETING OF AD USERS’ SEARCH FOR SPECIFIC PRODUCTS OR SERVICES TO DRIVE GROWTH
                    TABLE 76 SEARCH ADVERTISING: MARKET, BY REGION, 2019–2022 (USD BILLION)
                    TABLE 77 SEARCH ADVERTISING: MARKET, BY REGION, 2023–2030 (USD BILLION)
    7.4 DISPLAY ADVERTISING 
           7.4.1 DEMAND FOR IMMERSIVE AND INTERACTIVE USER EXPERIENCE TO DRIVE DEMAND FOR DISPLAY ADVERTISING
                    TABLE 78 DISPLAY ADVERTISING: MARKET, BY REGION, 2019–2022 (USD BILLION)
                    TABLE 79 DISPLAY ADVERTISING: MARKET, BY REGION, 2023–2030 (USD BILLION)
    7.5 MOBILE ADVERTISING 
           7.5.1 INCREASED MOBILE INTERNET USAGE TO DRIVE POPULARITY OF MOBILE ADVERTISING
                    TABLE 80 MOBILE ADVERTISING: ADTECH MARKET, BY REGION, 2019–2022 (USD BILLION)
                    TABLE 81 MOBILE ADVERTISING: MARKET, BY REGION, 2023–2030 (USD BILLION)
    7.6 EMAIL ADVERTISING 
           7.6.1 NEED FOR LEVERAGING DATA ANALYTICS AND AI TO CREATE HIGHLY TAILORED EMAIL CAMPAIGNS TO BOOST GROWTH
                    TABLE 82 EMAIL ADVERTISING: MARKET, BY REGION, 2019–2022 (USD BILLION)
                    TABLE 83 EMAIL ADVERTISING: MARKET, BY REGION, 2023–2030 (USD BILLION)
    7.7 NATIVE ADVERTISING 
           7.7.1 FOCUS ON PROVIDING ADVERTISERS WITH BETTER INSIGHTS INTO THEIR CAMPAIGN PERFORMANCE TO PROPEL GROWTH
                    TABLE 84 NATIVE ADVERTISING: MARKET, BY REGION, 2019–2022 (USD BILLION)
                    TABLE 85 NATIVE ADVERTISING: MARKET, BY REGION, 2023–2030 (USD BILLION)
    7.8 OTHER ADVERTISING TYPES 
           TABLE 86 OTHER ADVERTISING TYPES: MARKET, BY REGION, 2019–2022 (USD BILLION)
           TABLE 87 OTHER ADVERTISING TYPES: MARKET, BY REGION, 2023–2030 (USD BILLION)
 
8 ADTECH MARKET, BY ADVERTISING MEDIA (Page No. - 147)
    8.1 INTRODUCTION 
           8.1.1 ADVERTISING MEDIA: MARKET DRIVERS
                    FIGURE 44 DIGITAL ADVERTISING SEGMENT TO WITNESS HIGHEST GROWTH RATE DURING FORECAST PERIOD
                    TABLE 88 MARKET, BY ADVERTISING MEDIA, 2019–2022 (USD BILLION)
                    TABLE 89 MARKET, BY ADVERTISING MEDIA, 2023–2030 (USD BILLION)
    8.2 TELEVISION ADVERTISING 
           8.2.1 HIGH VIEWERSHIP OF TV CONTENT, PARTICULARLY IN LIVE EVENTS, SPORTS, AND PREMIUM SHOWS, TO DRIVE MARKET
                    TABLE 90 TELEVISION ADVERTISING: MARKET, BY REGION, 2019–2022 (USD BILLION)
                    TABLE 91 TELEVISION ADVERTISING: MARKET, BY REGION, 2023–2030 (USD BILLION)
    8.3 RADIO ADVERTISING 
           8.3.1 RISE OF DIGITAL AUDIO PLATFORMS TO ENCOURAGE MARKET EXPANSION
                    TABLE 92 RADIO ADVERTISING: MARKET, BY REGION, 2019–2022 (USD BILLION)
                    TABLE 93 RADIO ADVERTISING: MARKET, BY REGION, 2023–2030 (USD BILLION)
    8.4 PRINT ADVERTISING 
           TABLE 94 PRINT ADVERTISING: ADTECH MARKET, BY REGION, 2019–2022 (USD BILLION)
           TABLE 95 PRINT ADVERTISING: MARKET, BY REGION, 2023–2030 (USD BILLION)
           8.4.1 MAGAZINES
                    8.4.1.1 Demand for tangible and visually engaging medium for advertisers to convey messages to propel growth
           8.4.2 NEWSPAPER
                    8.4.2.1 Adoption of online and digital platforms for advertorials to encourage market expansion
    8.5 OUTDOOR ADVERTISING 
           TABLE 96 OUTDOOR ADVERTISING: MARKET, BY REGION, 2019–2022 (USD BILLION)
           TABLE 97 OUTDOOR ADVERTISING: MARKET, BY REGION, 2023–2030 (USD BILLION)
           8.5.1 PUBLIC SIGNS
                    8.5.1.1 Public signs help advertisers convey messages to broad audience
           8.5.2 BILLBOARDS
                    8.5.2.1 Need for large, eye-catching displays to create brand visibility and impact to drive growth
           8.5.3 POSTERS
                    8.5.3.1 Growing trend toward using eco-friendly materials and energy-efficient lighting to convey messages to drive demand for posters
    8.6 DIGITAL ADVERTISING 
           TABLE 98 DIGITAL ADVERTISING: ADTECH MARKET, BY REGION, 2019–2022 (USD BILLION)
           TABLE 99 DIGITAL ADVERTISING: MARKET, BY REGION, 2023–2030 (USD BILLION)
           8.6.1 DISPLAY AND MOBILE ADVERTISING
                    8.6.1.1 Adoption of smartphones and increasing screentime on mobile devices to drive growth
           8.6.2 SEARCH ENGINE ADVERTISING
                    8.6.2.1 Focus on enabling unparalleled reach and precision bidding on specific keywords to fuel growth
           8.6.3 SOCIAL MEDIA ADVERTISING
                    8.6.3.1 Extensive use of digital marketing platforms for interactive and visually engaging content to drive growth
 
9 ADTECH MARKET, BY VERTICAL (Page No. - 158)
    9.1 INTRODUCTION 
           9.1.1 VERTICALS: MARKET DRIVERS
                    FIGURE 45 BFSI SEGMENT TO WITNESS HIGHEST GROWTH DURING FORECAST PERIOD
                    TABLE 100 MARKET, BY VERTICAL, 2019–2022 (USD BILLION)
                    TABLE 101 MARKET, BY VERTICAL, 2023–2030 (USD BILLION)
    9.2 BANKING, FINANCIAL SERVICES, AND INSURANCE 
           9.2.1 EMERGENCE OF AI AND ML FOR PREDICTIVE ANALYTICS AND CHATBOT-DRIVEN CUSTOMER INTERACTIONS TO DRIVE DEMAND
                    TABLE 102 BANKING, FINANCIAL SERVICES, AND INSURANCE: MARKET, BY REGION, 2019–2022 (USD BILLION)
                    TABLE 103 BANKING, FINANCIAL SERVICES, AND INSURANCE: MARKET, BY REGION, 2023–2030 (USD BILLION)
    9.3 MEDIA & ENTERTAINMENT 
           9.3.1 ADOPTION OF OTT PLATFORMS BY CONSUMERS TO FOSTER GROWTH
                    TABLE 104 MEDIA & ENTERTAINMENT: MARKET, BY REGION, 2019–2022 (USD BILLION)
                    TABLE 105 MEDIA & ENTERTAINMENT: MARKET, BY REGION, 2023–2030 (USD BILLION)
    9.4 RETAIL & ECOMMERCE 
           9.4.1 SHIFT IN CONSUMER BEHAVIOR TOWARD ONLINE SHOPPING TO DRIVE DEMAND FOR ADTECH SOLUTIONS IN RETAIL & ECOMMERCE INDUSTRY
                    TABLE 106 RETAIL & ECOMMERCE: MARKET, BY REGION, 2019–2022 (USD BILLION)
                    TABLE 107 RETAIL & ECOMMERCE: MARKET, BY REGION, 2023–2030 (USD BILLION)
    9.5 HEALTHCARE & LIFE SCIENCES 
           9.5.1 NEED FOR FACILITATING PERSONALIZED HEALTHCARE INFORMATION AND IMPROVING OVERALL PATIENT EXPERIENCE TO PROPEL GROWTH
                    TABLE 108 HEALTHCARE & LIFE SCIENCES: ADTECH MARKET, BY REGION, 2019–2022 (USD BILLION)
                    TABLE 109 HEALTHCARE & LIFE SCIENCES: MARKET, BY REGION, 2023–2030 (USD BILLION)
    9.6 TRAVEL & HOSPITALITY 
           9.6.1 RELIANCE OF TRAVELERS ON SMARTPHONES TO DRIVE ADOPTION OF VIDEO ADVERTISING IN TRAVEL & HOSPITALITY SECTOR
                    TABLE 110 TRAVEL & HOSPITALITY: MARKET, BY REGION, 2019–2022 (USD BILLION)
                    TABLE 111 TRAVEL & HOSPITALITY: MARKET, BY REGION, 2023–2030 (USD BILLION)
    9.7 MANUFACTURING 
           9.7.1 STRONG EMPHASIS ON SUSTAINABILITY AND ECO-FRIENDLY ADVERTISING TO DRIVE POPULARITY OF ADTECH SOLUTIONS IN MANUFACTURING SECTOR
                    TABLE 112 MANUFACTURING: MARKET, BY REGION, 2019–2022 (USD BILLION)
                    TABLE 113 MANUFACTURING: MARKET, BY REGION, 2023–2030 (USD BILLION)
    9.8 TELECOM 
           9.8.1 FOCUS ON FACILITATING SEAMLESS DELIVERY OF HIGH-QUALITY VIDEO ADS AND AUGMENTED REALITY EXPERIENCES TO FUEL MARKET
                    TABLE 114 TELECOM: MARKET, BY REGION, 2019–2022 (USD BILLION)
                    TABLE 115 TELECOM: MARKET, BY REGION, 2023–2030 (USD BILLION)
    9.9 TRANSPORTATION & LOGISTICS 
           9.9.1 ADOPTION OF ADTECH SOLUTIONS IN TRANSPORTATION & LOGISTICS INDUSTRY HELPS ADDRESS SUSTAINABILITY CONCERNS
                    TABLE 116 TRANSPORTATION & LOGISTICS: MARKET, BY REGION, 2019–2022 (USD BILLION)
                    TABLE 117 TRANSPORTATION & LOGISTICS: MARKET, BY REGION, 2023–2030 (USD BILLION)
    9.10 FOOD & BEVERAGES 
           9.10.1 RISING POPULARITY OF FOOD DELIVERY APPS TO DRIVE ADOPTION OF ADTECH SOLUTIONS IN FOOD & BEVERAGES SECTOR
                    TABLE 118 FOOD & BEVERAGES: MARKET, BY REGION, 2019–2022 (USD BILLION)
                    TABLE 119 FOOD & BEVERAGES: MARKET, BY REGION, 2023–2030 (USD BILLION)
    9.11 OTHER VERTICALS 
                    TABLE 120 OTHER VERTICALS: MARKET, BY REGION, 2019–2022 (USD BILLION)
                    TABLE 121 OTHER VERTICALS: MARKET, BY REGION, 2023–2030 (USD BILLION)
 
10 ADTECH MARKET, BY REGION (Page No. - 172)
     10.1 INTRODUCTION 
               FIGURE 46 ASIA PACIFIC TO REGISTER HIGHEST CAGR DURING FORECAST PERIOD
               FIGURE 47 INDIA TO WITNESS HIGHEST GROWTH DURING FORECAST PERIOD
               TABLE 122 MARKET, BY REGION, 2019–2022 (USD BILLION)
               TABLE 123 MARKET, BY REGION, 2023–2030 (USD BILLION)
     10.2 NORTH AMERICA 
             10.2.1 NORTH AMERICA: MARKET DRIVERS
             10.2.2 NORTH AMERICA: RECESSION IMPACT
                       FIGURE 48 NORTH AMERICA: MARKET SNAPSHOT
                       TABLE 124 NORTH AMERICA: ADTECH MARKET, BY OFFERING, 2019–2022 (USD BILLION)
                       TABLE 125 NORTH AMERICA: MARKET, BY OFFERING, 2023–2030 (USD BILLION)
                       TABLE 126 NORTH AMERICA: MARKET, BY SOLUTION, 2019–2022 (USD BILLION)
                       TABLE 127 NORTH AMERICA: MARKET, BY SOLUTION, 2023–2030 (USD BILLION)
                       TABLE 128 NORTH AMERICA: MARKET, BY SERVICE, 2019–2022 (USD BILLION)
                       TABLE 129 NORTH AMERICA: MARKET, BY SERVICE, 2023–2030 (USD BILLION)
                       TABLE 130 NORTH AMERICA: MARKET, BY PROFESSIONAL SERVICE, 2019–2022 (USD BILLION)
                       TABLE 131 NORTH AMERICA: MARKET, BY PROFESSIONAL SERVICE, 2023–2030 (USD BILLION)
                       TABLE 132 NORTH AMERICA: ADTECH SOLUTIONS MARKET, BY DEPLOYMENT MODE, 2019–2022 (USD BILLION)
                       TABLE 133 NORTH AMERICA: ADTECH SOLUTIONS MARKET, BY DEPLOYMENT MODE, 2023–2030 (USD BILLION)
                       TABLE 134 NORTH AMERICA: ADTECH SOLUTIONS MARKET, BY MODE OF INTERFACE, 2019–2022 (USD BILLION)
                       TABLE 135 NORTH AMERICA: ADTECH SOLUTIONS MARKET, BY MODE OF INTERFACE, 2023–2030 (USD BILLION)
                       TABLE 136 NORTH AMERICA: ADTECH MARKET, BY ADVERTISING TYPE, 2019–2022 (USD BILLION)
                       TABLE 137 NORTH AMERICA: MARKET, BY ADVERTISING TYPE, 2023–2030 (USD BILLION)
                       TABLE 138 NORTH AMERICA: MARKET, BY ADVERTISING MEDIA, 2019–2022 (USD BILLION)
                       TABLE 139 NORTH AMERICA: MARKET, BY ADVERTISING MEDIA, 2023–2030 (USD BILLION)
                       TABLE 140 NORTH AMERICA: MARKET, BY VERTICAL, 2019–2022 (USD BILLION)
                       TABLE 141 NORTH AMERICA: MARKET, BY VERTICAL, 2023–2030 (USD BILLION)
                       TABLE 142 NORTH AMERICA: MARKET, BY COUNTRY, 2019–2022 (USD BILLION)
                       TABLE 143 NORTH AMERICA: MARKET, BY COUNTRY, 2023–2030 (USD BILLION)
             10.2.3 US
                       10.2.3.1 Growing emphasis on data-driven advertising strategies to contribute to market growth
             10.2.4 CANADA
                       10.2.4.1 Strong economic stability and growing digital landscape to encourage market expansion
     10.3 EUROPE 
             10.3.1 EUROPE: MARKET DRIVERS
             10.3.2 EUROPE: RECESSION IMPACT
                       TABLE 144 EUROPE: ADTECH MARKET, BY OFFERING, 2019–2022 (USD BILLION)
                       TABLE 145 EUROPE: MARKET, BY OFFERING, 2023–2030 (USD BILLION)
                       TABLE 146 EUROPE: MARKET, BY SOLUTION, 2019–2022 (USD BILLION)
                       TABLE 147 EUROPE: MARKET, BY SOLUTION, 2023–2030 (USD BILLION)
                       TABLE 148 EUROPE: MARKET, BY SERVICE, 2019–2022 (USD BILLION)
                       TABLE 149 EUROPE: MARKET, BY SERVICE, 2023–2030 (USD BILLION)
                       TABLE 150 EUROPE: MARKET, BY PROFESSIONAL SERVICE, 2019–2022 (USD BILLION)
                       TABLE 151 EUROPE: MARKET, BY PROFESSIONAL SERVICE, 2023–2030 (USD BILLION)
                       TABLE 152 EUROPE: ADTECH SOLUTIONS MARKET, BY DEPLOYMENT MODE, 2019–2022 (USD BILLION)
                       TABLE 153 EUROPE: ADTECH SOLUTIONS MARKET, BY DEPLOYMENT MODE, 2023–2030 (USD BILLION)
                       TABLE 154 EUROPE: ADTECH SOLUTIONS MARKET, BY MODE OF INTERFACE, 2019–2022 (USD BILLION)
                       TABLE 155 EUROPE: ADTECH SOLUTIONS MARKET, BY MODE OF INTERFACE, 2023–2030 (USD BILLION)
                       TABLE 156 EUROPE: ADTECH MARKET, BY ADVERTISING TYPE, 2019–2022 (USD BILLION)
                       TABLE 157 EUROPE: MARKET, BY ADVERTISING TYPE, 2023–2030 (USD BILLION)
                       TABLE 158 EUROPE: MARKET, BY ADVERTISING MEDIA, 2019–2022 (USD BILLION)
                       TABLE 159 EUROPE: MARKET, BY ADVERTISING MEDIA, 2023–2030 (USD BILLION)
                       TABLE 160 EUROPE: MARKET, BY VERTICAL, 2019–2022 (USD BILLION)
                       TABLE 161 EUROPE: MARKET, BY VERTICAL, 2023–2030 (USD BILLION)
                       TABLE 162 EUROPE: MARKET, BY COUNTRY, 2019–2022 (USD BILLION)
                       TABLE 163 EUROPE: MARKET, BY COUNTRY, 2023–2030 (USD BILLION)
             10.3.3 UK
                       10.3.3.1 Adoption of sustainable and ethical advertising practices to propel growth
             10.3.4 GERMANY
                       10.3.4.1 Robust economy and large population of internet users to spur growth
             10.3.5 FRANCE
                       10.3.5.1 Stringent data privacy regulations such as GDPR to influence market growth
             10.3.6 SPAIN
                       10.3.6.1 Demand for advertising strategies that provide human touch to propel market
             10.3.7 ITALY
                       10.3.7.1 Heavy investments in data analytics and AI to deliver tailored content to contribute to market expansion
             10.3.8 REST OF EUROPE
     10.4 ASIA PACIFIC 
             10.4.1 ASIA PACIFIC: MARKET DRIVERS
             10.4.2 ASIA PACIFIC: RECESSION IMPACT
                       FIGURE 49 ASIA PACIFIC: ADTECHMARKET SNAPSHOT
                       TABLE 164 ASIA PACIFIC: MARKET, BY OFFERING, 2019–2022 (USD BILLION)
                       TABLE 165 ASIA PACIFIC: MARKET, BY OFFERING, 2023–2030 (USD BILLION)
                       TABLE 166 ASIA PACIFIC: MARKET, BY SOLUTION, 2019–2022 (USD BILLION)
                       TABLE 167 ASIA PACIFIC: MARKET, BY SOLUTION, 2023–2030 (USD BILLION)
                       TABLE 168 ASIA PACIFIC: MARKET, BY SERVICE, 2019–2022 (USD BILLION)
                       TABLE 169 ASIA PACIFIC: MARKET, BY SERVICE, 2023–2030 (USD BILLION)
                       TABLE 170 ASIA PACIFIC: MARKET, BY PROFESSIONAL SERVICE, 2019–2022 (USD BILLION)
                       TABLE 171 ASIA PACIFIC: MARKET, BY PROFESSIONAL SERVICE, 2023–2030 (USD BILLION)
                       TABLE 172 ASIA PACIFIC: ADTECH SOLUTIONS MARKET, BY DEPLOYMENT MODE, 2019–2022 (USD BILLION)
                       TABLE 173 ASIA PACIFIC: ADTECH SOLUTIONS MARKET, BY DEPLOYMENT MODE, 2023–2030 (USD BILLION)
                       TABLE 174 ASIA PACIFIC: ADTECH SOLUTIONS MARKET, BY MODE OF INTERFACE, 2019–2022 (USD BILLION)
                       TABLE 175 ASIA PACIFIC: ADTECH SOLUTIONS MARKET, BY MODE OF INTERFACE, 2023–2030 (USD BILLION)
                       TABLE 176 ASIA PACIFIC: ADTECH MARKET, BY ADVERTISING TYPE, 2019–2022 (USD BILLION)
                       TABLE 177 ASIA PACIFIC: MARKET, BY ADVERTISING TYPE, 2023–2030 (USD BILLION)
                       TABLE 178 ASIA PACIFIC: MARKET, BY ADVERTISING MEDIA, 2019–2022 (USD BILLION)
                       TABLE 179 ASIA PACIFIC: MARKET, BY ADVERTISING MEDIA, 2023–2030 (USD BILLION)
                       TABLE 180 ASIA PACIFIC: MARKET, BY VERTICAL, 2019–2022 (USD BILLION)
                       TABLE 181 ASIA PACIFIC: MARKET, BY VERTICAL, 2023–2030 (USD BILLION)
                       TABLE 182 ASIA PACIFIC: MARKET, BY COUNTRY, 2019–2022 (USD BILLION)
                       TABLE 183 ASIA PACIFIC: MARKET, BY COUNTRY, 2023–2030 (USD BILLION)
                       TABLE 184 ASIA PACIFIC: MARKET, BY ASEAN COUNTRY, 2019–2022 (USD BILLION)
                       TABLE 185 ASIA PACIFIC: MARKET, BY ASEAN COUNTRY, 2023–2030 (USD BILLION)
             10.4.3 CHINA
                       10.4.3.1 Robust government policies for technological innovation to fuel market
             10.4.4 JAPAN
                       10.4.4.1 Emphasis on high-quality content and aesthetics to drive market
             10.4.5 INDIA
                       10.4.5.1 Focus on video advertising and integration of vernacular languages to propel growth
             10.4.6 SOUTH KOREA
                       10.4.6.1 Adoption of AR and VR for immersive advertising experiences to boost growth
             10.4.7 AUSTRALIA & NEW ZEALAND
                       10.4.7.1 Demand for data security and transparency from tech-savvy consumers to fuel growth
             10.4.8 ASEAN COUNTRIES
                       10.4.8.1 Popularity of eCommerce and government’s push for digitalization to propel growth
             10.4.9 REST OF ASIA PACIFIC
     10.5 MIDDLE EAST & AFRICA 
             10.5.1 MIDDLE EAST & AFRICA: ADTECH MARKET DRIVERS
             10.5.2 MIDDLE EAST & AFRICA: RECESSION IMPACT
                       TABLE 186 MIDDLE EAST & AFRICA: MARKET, BY OFFERING, 2019–2022 (USD BILLION)
                       TABLE 187 MIDDLE EAST & AFRICA: MARKET, BY OFFERING, 2023–2030 (USD BILLION)
                       TABLE 188 MIDDLE EAST & AFRICA: MARKET, BY SOLUTION, 2019–2022 (USD BILLION)
                       TABLE 189 MIDDLE EAST & AFRICA: MARKET, BY SOLUTION, 2023–2030 (USD BILLION)
                       TABLE 190 MIDDLE EAST & AFRICA: MARKET, BY SERVICE, 2019–2022 (USD BILLION)
                       TABLE 191 MIDDLE EAST & AFRICA: MARKET, BY SERVICE, 2023–2030 (USD BILLION)
                       TABLE 192 MIDDLE EAST & AFRICA: MARKET, BY PROFESSIONAL SERVICE, 2019–2022 (USD BILLION)
                       TABLE 193 MIDDLE EAST & AFRICA: MARKET, BY PROFESSIONAL SERVICE, 2023–2030 (USD BILLION)
                       TABLE 194 MIDDLE EAST & AFRICA: ADTECH SOLUTIONS MARKET, BY DEPLOYMENT MODE, 2019–2022 (USD BILLION)
                       TABLE 195 MIDDLE EAST & AFRICA: ADTECH SOLUTIONS MARKET, BY DEPLOYMENT MODE, 2023–2030 (USD BILLION)
                       TABLE 196 MIDDLE EAST & AFRICA: ADTECH SOLUTIONS MARKET, BY MODE OF INTERFACE, 2019–2022 (USD BILLION)
                       TABLE 197 MIDDLE EAST & AFRICA: ADTECH SOLUTIONS MARKET, BY MODE OF INTERFACE, 2023–2030 (USD BILLION)
                       TABLE 198 MIDDLE EAST & AFRICA: ADTECH MARKET, BY ADVERTISING TYPE, 2019–2022 (USD BILLION)
                       TABLE 199 MIDDLE EAST & AFRICA: MARKET, BY ADVERTISING TYPE, 2023–2030 (USD BILLION)
                       TABLE 200 MIDDLE EAST & AFRICA: MARKET, BY ADVERTISING MEDIA, 2019–2022 (USD BILLION)
                       TABLE 201 MIDDLE EAST & AFRICA: MARKET, BY ADVERTISING MEDIA, 2023–2030 (USD BILLION)
                       TABLE 202 MIDDLE EAST & AFRICA: MARKET, BY VERTICAL, 2019–2022 (USD BILLION)
                       TABLE 203 MIDDLE EAST & AFRICA: MARKET, BY VERTICAL, 2023–2030 (USD BILLION)
                       TABLE 204 MIDDLE EAST & AFRICA: MARKET, BY COUNTRY, 2019–2022 (USD BILLION)
                       TABLE 205 MIDDLE EAST & AFRICA: MARKET, BY COUNTRY, 2023–2030 (USD BILLION)
             10.5.3 UAE
                       10.5.3.1 Focus on adopting cutting-edge advertising technologies to drive growth
             10.5.4 SAUDI ARABIA
                       10.5.4.1 Growing emphasis on online sales and customer engagement to boost growth
             10.5.5 QATAR
                       10.5.5.1 Demand for culturally relevant content and eCommerce expansion to drive growth
             10.5.6 SOUTH AFRICA
                       10.5.6.1 Active involvement of institutes and government with advertising technologies to drive growth
             10.5.7 REST OF THE MIDDLE EAST & AFRICA
     10.6 LATIN AMERICA 
             10.6.1 LATIN AMERICA: MARKET DRIVERS
             10.6.2 LATIN AMERICA: RECESSION IMPACT
                       TABLE 206 LATIN AMERICA: ADTECH MARKET, BY OFFERING, 2019–2022 (USD BILLION)
                       TABLE 207 LATIN AMERICA: MARKET, BY OFFERING, 2023–2030 (USD BILLION)
                       TABLE 208 LATIN AMERICA: MARKET, BY SOLUTION, 2019–2022 (USD BILLION)
                       TABLE 209 LATIN AMERICA: MARKET, BY SOLUTION, 2023–2030 (USD BILLION)
                       TABLE 210 LATIN AMERICA: MARKET, BY SERVICE, 2019–2022 (USD BILLION)
                       TABLE 211 LATIN AMERICA: MARKET, BY SERVICE, 2023–2030 (USD BILLION)
                       TABLE 212 LATIN AMERICA: MARKET, BY PROFESSIONAL SERVICE, 2019–2022 (USD BILLION)
                       TABLE 213 LATIN AMERICA: MARKET, BY PROFESSIONAL SERVICE, 2023–2030 (USD BILLION)
                       TABLE 214 LATIN AMERICA: ADTECH SOLUTIONS MARKET, BY DEPLOYMENT MODE, 2019–2022 (USD BILLION)
                       TABLE 215 LATIN AMERICA: ADTECH SOLUTIONS MARKET, BY DEPLOYMENT MODE, 2023–2030 (USD BILLION)
                       TABLE 216 LATIN AMERICA: ADTECH SOLUTIONS MARKET, BY MODE OF INTERFACE, 2019–2022 (USD BILLION)
                       TABLE 217 LATIN AMERICA: ADTECH SOLUTIONS MARKET, BY MODE OF INTERFACE, 2023–2030 (USD BILLION)
                       TABLE 218 LATIN AMERICA: ADTECH MARKET, BY ADVERTISING TYPE, 2019–2022 (USD BILLION)
                       TABLE 219 LATIN AMERICA: MARKET, BY ADVERTISING TYPE, 2023–2030 (USD BILLION)
                       TABLE 220 LATIN AMERICA: MARKET, BY ADVERTISING MEDIA, 2019–2022 (USD BILLION)
                       TABLE 221 LATIN AMERICA: MARKET, BY ADVERTISING MEDIA, 2023–2030 (USD BILLION)
                       TABLE 222 LATIN AMERICA: MARKET, BY VERTICAL, 2019–2022 (USD BILLION)
                       TABLE 223 LATIN AMERICA: MARKET, BY VERTICAL, 2023–2030 (USD BILLION)
                       TABLE 224 LATIN AMERICA: MARKET, BY COUNTRY, 2019–2022 (USD BILLION)
                       TABLE 225 LATIN AMERICA: MARKET, BY COUNTRY, 2023–2030 (USD BILLION)
             10.6.3 BRAZIL
                       10.6.3.1 Government’s strategies to prioritize culturally relevant and localized content to foster growth
             10.6.4 MEXICO
                       10.6.4.1 Robust government initiatives for technological developments to encourage market expansion
             10.6.5 ARGENTINA
                       10.6.5.1 Growing digital advertising landscape to fuel market growth
             10.6.6 REST OF LATIN AMERICA
 
11 COMPETITIVE LANDSCAPE (Page No. - 222)
     11.1 OVERVIEW 
     11.2 STRATEGIES ADOPTED BY KEY PLAYERS 
               TABLE 226 OVERVIEW OF STRATEGIES ADOPTED BY KEY PLAYERS
     11.3 REVENUE ANALYSIS 
             11.3.1 BUSINESS SEGMENT REVENUE ANALYSIS
                       FIGURE 50 BUSINESS SEGMENT REVENUE ANALYSIS, 2020–2022 (USD BILLION)
     11.4 MARKET SHARE ANALYSIS 
               FIGURE 51 MARKET SHARE ANALYSIS FOR KEY PLAYERS, 2022
               TABLE 227 MARKET: INTENSITY OF COMPETITIVE RIVALRY
     11.5 BRAND/PRODUCT COMPARATIVE ANALYSIS IN MARKET 
             11.5.1 COMPARATIVE ANALYSIS OF TRENDING ADTECH PRODUCTS
                       TABLE 228 COMPARATIVE ANALYSIS OF TRENDING ADTECH PRODUCTS
                       TABLE 229 COMPARATIVE ANALYSIS OF OTHER ADTECH PRODUCTS
     11.6 COMPANY EVALUATION MATRIX FOR KEY PLAYERS, 2022 
             11.6.1 STARS
             11.6.2 EMERGING LEADERS
             11.6.3 PERVASIVE PLAYERS
             11.6.4 PARTICIPANTS
                       FIGURE 52 COMPANY EVALUATION MATRIX FOR KEY PLAYERS, 2022
             11.6.5 COMPANY FOOTPRINT
                       TABLE 230 OVERALL PRODUCT FOOTPRINT FOR KEY PLAYERS, 2022
                       TABLE 231 OVERALL PRODUCT FOOTPRINT FOR OTHER KEY PLAYERS, 2022
     11.7 START-UP/SME EVALUATION MATRIX 
             11.7.1 PROGRESSIVE COMPANIES
             11.7.2 RESPONSIVE COMPANIES
             11.7.3 DYNAMIC COMPANIES
             11.7.4 STARTING BLOCKS
                       FIGURE 53 START-UP/SME EVALUATION MATRIX, 2022
             11.7.5 COMPETITIVE BENCHMARKING
                       TABLE 232 DETAILED LIST OF KEY START-UPS/SMES
                       TABLE 233 OVERALL PRODUCT FOOTPRINT FOR START-UPS/SMES, 2022
     11.8 VALUATION AND FINANCIAL METRICS OF KEY ADTECH VENDORS 
               FIGURE 54 FINANCIAL METRICS OF KEY ADTECH VENDORS
               FIGURE 55 YTD PRICE TOTAL RETURN AND STOCK BETA OF KEY ADTECH VENDORS
     11.9 COMPETITIVE SCENARIO AND TRENDS 
             11.9.1 PRODUCT LAUNCHES/ENHANCEMENTS
                       TABLE 234 PRODUCT LAUNCHES/ENHANCEMENTS, 2022–2023
             11.9.2 DEALS
                       TABLE 235 DEALS, 2021–2023
 
12 COMPANY PROFILES (Page No. - 242)
(Business Overview, Products Offered, Recent Developments, MnM View Right to win, Strategic choices made, Weaknesses and competitive threats) *
     12.1 INTRODUCTION 
     12.2 KEY PLAYERS 
             12.2.1 META
                       TABLE 236 META: BUSINESS OVERVIEW
                       FIGURE 56 META: COMPANY SNAPSHOT
                       TABLE 237 META: PRODUCTS/SOLUTIONS/SERVICES OFFERED
                       TABLE 238 META: PRODUCT LAUNCHES/ENHANCEMENTS
                       TABLE 239 META: DEALS
             12.2.2 GOOGLE
                       TABLE 240 GOOGLE: BUSINESS OVERVIEW
                       FIGURE 57 GOOGLE: COMPANY SNAPSHOT
                       TABLE 241 GOOGLE: PRODUCTS/SOLUTIONS/SERVICES OFFERED
                       TABLE 242 GOOGLE: PRODUCT LAUNCHES/ENHANCEMENTS
             12.2.3 AMAZON
                       TABLE 243 AMAZON: BUSINESS OVERVIEW
                       FIGURE 58 AMAZON: COMPANY SNAPSHOT
                       TABLE 244 AMAZON: PRODUCTS/SOLUTIONS/SERVICES OFFERED
                       TABLE 245 AMAZON: PRODUCT LAUNCHES/ENHANCEMENTS
                       TABLE 246 AMAZON: DEALS
             12.2.4 ADOBE
                       TABLE 247 ADOBE: BUSINESS OVERVIEW
                       FIGURE 59 ADOBE: COMPANY SNAPSHOT
                       TABLE 248 ADOBE: PRODUCTS/SOLUTIONS/SERVICES OFFERED
                       TABLE 249 ADOBE: PRODUCT LAUNCHES/ENHANCEMENTS
                       TABLE 250 ADOBE: DEALS
             12.2.5 YAHOO
                       TABLE 251 YAHOO: BUSINESS OVERVIEW
                       TABLE 252 YAHOO: PRODUCTS/SOLUTIONS/SERVICES OFFERED
                       TABLE 253 YAHOO: PRODUCT LAUNCHES/ENHANCEMENTS
                       TABLE 254 YAHOO: DEALS
             12.2.6 ZETA
                       TABLE 255 ZETA: BUSINESS OVERVIEW
                       FIGURE 60 ZETA: COMPANY SNAPSHOT
                       TABLE 256 ZETA: PRODUCTS/SOLUTIONS/SERVICES OFFERED
                       TABLE 257 ZETA: PRODUCT LAUNCHES/ENHANCEMENTS
                       TABLE 258 ZETA: DEALS
     12.3 OTHER KEY PLAYERS 
             12.3.1 MICROSOFT
             12.3.2 CELTRA
             12.3.3 BASIS TECHNOLOGIES
             12.3.4 LUNA
             12.3.5 NEXTROLL
             12.3.6 QUANTCAST
             12.3.7 CRITEO
             12.3.8 AFFLE
             12.3.9 INMOBI
             12.3.10 DEMANDBASE
             12.3.11 THE TRADE DESK
             12.3.12 ADFORM
             12.3.13 EQUATIV
             12.3.14 ILLUMIN
             12.3.15 TREMOR INTERNATIONAL
             12.3.16 INNOVID
             12.3.17 MEDIAOCEAN
             12.3.18 DOUBLEVERIFY
             12.3.19 MAGNITE
     12.4 START-UPS/SMES 
             12.4.1 COPY.AI
             12.4.2 NICKELYTICS
             12.4.3 C WIRE
             12.4.4 CAVAI
             12.4.5 TITAN DIGITAL
             12.4.6 GLIMPSE PROTOCOL
             12.4.7 STACKADAPT
             12.4.8 COSMOSE AI
             12.4.9 VIDSY
             12.4.10 LINKBY
*Details on Business Overview, Products Offered, Recent Developments, MnM View, Right to win, Strategic choices made, Weaknesses and competitive threats might not be captured in case of unlisted companies.
 
13 ADJACENT AND RELATED MARKETS (Page No. - 282)
     13.1 INTRODUCTION 
     13.2 APP ANALYTICS MARKET 
             13.2.1 MARKET DEFINITION
             13.2.2 MARKET OVERVIEW
                       13.2.2.1 App analytics market, by offering
                                   TABLE 259 APP ANALYTICS MARKET, BY OFFERING, 2017–2022 (USD MILLION)
                                   TABLE 260 APP ANALYTICS MARKET, BY OFFERING, 2023–2028 (USD MILLION)
                       13.2.2.2 App analytics market, by type
                                   TABLE 261 APP ANALYTICS MARKET, BY TYPE, 2017–2022 (USD MILLION)
                                   TABLE 262 APP ANALYTICS MARKET, BY TYPE, 2023–2028 (USD MILLION)
                       13.2.2.3 App analytics market, by vertical
                                   TABLE 263 APP ANALYTICS MARKET, BY VERTICAL, 2017–2022 (USD MILLION)
                                   TABLE 264 APP ANALYTICS MARKET, BY VERTICAL, 2023–2028 (USD MILLION)
                       13.2.2.4 App analytics market, by region
                                   TABLE 265 APP ANALYTICS MARKET, BY REGION, 2017–2022 (USD MILLION)
                                   TABLE 266 APP ANALYTICS MARKET, BY REGION, 2023–2028 (USD MILLION)
     13.3 MOBILE APPS AND WEB ANALYTICS MARKET 
             13.3.1 MARKET DEFINITION
             13.3.2 MARKET OVERVIEW
                       13.3.2.1 Mobile apps and web analytics market, by component
                                   TABLE 267 MOBILE APPS AND WEB ANALYTICS MARKET, BY COMPONENT, 2016–2021 (USD MILLION)
                                   TABLE 268 MOBILE APPS AND WEB ANALYTICS MARKET, BY COMPONENT, 2022–2027 (USD MILLION)
                       13.3.2.2 Mobile apps and web analytics market, by organization size
                                   TABLE 269 MOBILE APPS AND WEB ANALYTICS MARKET, BY ORGANIZATION SIZE, 2016–2021 (USD MILLION)
                                   TABLE 270 MOBILE APPS AND WEB ANALYTICS MARKET, BY ORGANIZATION SIZE, 2022–2027 (USD MILLION)
                       13.3.2.3 Mobile apps and web analytics market, by deployment mode
                                   TABLE 271 MOBILE APPS AND WEB ANALYTICS MARKET, BY DEPLOYMENT MODE, 2016–2021 (USD MILLION)
                                   TABLE 272 MOBILE APPS AND WEB ANALYTICS MARKET, BY DEPLOYMENT MODE, 2022–2027 (USD MILLION)
                       13.3.2.4 Mobile apps and web analytics market, by application
                                   TABLE 273 MOBILE APPS AND WEB ANALYTICS MARKET, BY APPLICATION, 2016–2021 (USD MILLION)
                                   TABLE 274 MOBILE APPS AND WEB ANALYTICS MARKET, BY APPLICATION, 2022–2027 (USD MILLION)
                       13.3.2.5 Mobile apps and web analytics market, by region
                                   TABLE 275 MOBILE APPS AND WEB ANALYTICS MARKET, BY REGION, 2016–2021 (USD MILLION)
                                   TABLE 276 MOBILE APPS AND WEB ANALYTICS MARKET, BY REGION, 2022–2027 (USD MILLION)
 
14 APPENDIX (Page No. - 292)
     14.1 DISCUSSION GUIDE 
     14.2 KNOWLEDGESTORE: MARKETSANDMARKETS’ SUBSCRIPTION PORTAL 
     14.3 CUSTOMIZATION OPTIONS 
     14.4 RELATED REPORTS 
     14.5 AUTHOR DETAILS 

The AdTech market research study involved extensive secondary sources, directories, journals, and paid databases. Primary sources were mainly industry experts from the core and related industries, preferred AdTech providers, third-party service providers, consulting service providers, end users, and other commercial enterprises. In-depth interviews were conducted with various primary respondents, including key industry participants and subject matter experts, to obtain and verify critical qualitative and quantitative information and assess the market’s prospects.

Secondary Research

In the secondary research process, various sources were referred to, for identifying and collecting information for this study. Secondary sources included annual reports, press releases, and investor presentations of companies; white papers, journals, and certified publications; and articles from recognized authors, directories, and databases. The data was also collected from other secondary sources, such as journals, government websites, blogs, and vendors' websites. Additionally, AdTech spending of various countries was extracted from the respective sources. Secondary research was mainly used to obtain key information related to the industry’s value chain and supply chain to identify key players based on solutions, services, market classification, and segmentation according to offerings of major players, industry trends related to solutions, services, deployment modes, mode of interface, advertising type, advertising media, verticals, and regions, and key developments from both market- and technology-oriented perspectives.

Primary Research

In the primary research process, various primary sources from both the supply and demand sides were interviewed to obtain qualitative and quantitative information on the market. The primary sources from the supply side included various industry experts, including Chief Experience Officers (CXOs); Vice Presidents (VPs); directors from business development, marketing, and AdTech expertise; related key executives from AdTech solution vendors, SIs, professional service providers, and industry associations; and key opinion leaders.

Primary interviews were conducted to gather insights, such as market statistics, revenue data collected from solutions and services, market breakups, market size estimations, market forecasts, and data triangulation. Primary research also helped understand various trends related to technologies, applications, deployments, and regions. Stakeholders from the demand side, such as Chief Information Officers (CIOs), Chief Technology Officers (CTOs), Chief Strategy Officers (CSOs), and end users using AdTech solutions, were interviewed to understand the buyer’s perspective on suppliers, products, service providers, and their current usage of AdTech solutions and services, which would impact the overall AdTech market.

The breakup of Primary Research:
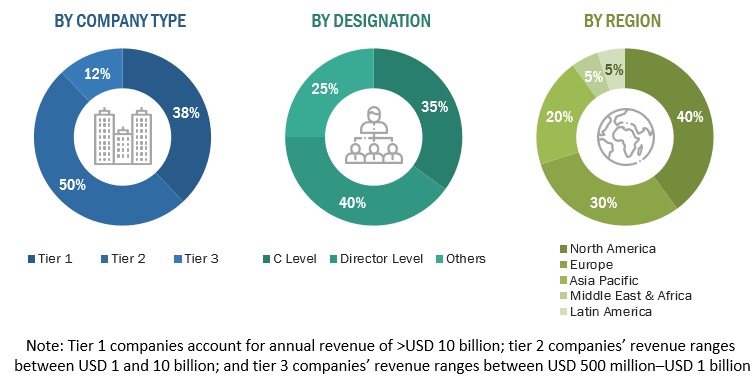
AdTech Market Size, and Share

To know about the assumptions considered for the study, download the pdf brochure

COMPANY NAME

DESIGNATION

C Wire

Co-Founder

Vidsy

Product Lead 

Nickelytics

CEO 

Market Size Estimation

In the bottom-up approach, the adoption rate of AdTech solutions and services among different end users in key countries concerning their regions contributing the most to the market share was identified. For cross-validation, the adoption of AdTech solutions and services among industries and different use cases concerning their regions was identified and extrapolated. Weightage was given to use cases identified in different regions for the market size calculation.

Based on the market numbers, the regional split was determined by primary and secondary sources. The procedure included the analysis of the AdTech market’s regional penetration. Based on secondary research, the regional spending on Information and Communications Technology (ICT), socio-economic analysis of each country, strategic vendor analysis of major AdTech providers, and organic and inorganic business development activities of regional and global players were estimated. With the data triangulation procedure and data validation through primaries, the exact values of the overall AdTech market size and segments’ size were determined and confirmed using the study.

Global AdTech Market Size: Bottom-Up and Top-Down Approach:
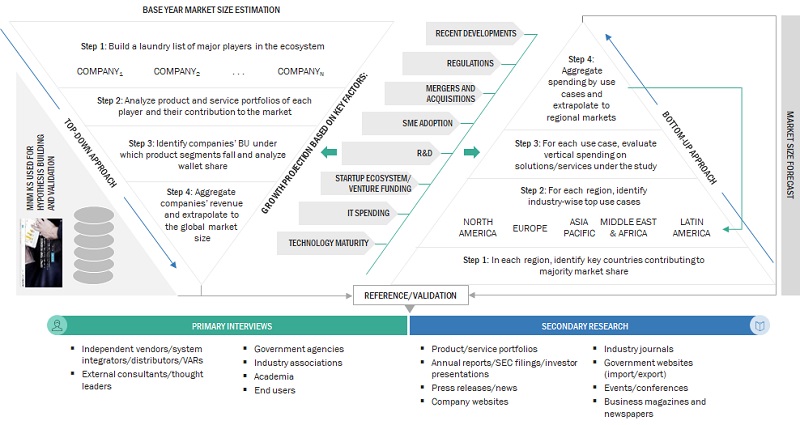
AdTech Market Size, and Share

Data Triangulation

Based on the market numbers, the regional split was determined by primary and secondary sources. The procedure included the analysis of the AdTech market’s regional penetration. Based on secondary research, the regional spending on Information and Communications Technology (ICT), socio-economic analysis of each country, strategic vendor analysis of major AdTech providers, and organic and inorganic business development activities of regional and global players were estimated. With the data triangulation procedure and data validation through primaries, the exact values of the overall AdTech market size and segments’ size were determined and confirmed using the study.

Market Definition

AdTech is a broad category encompassing the software tools and platforms employed by advertisers for the purpose of overseeing, targeting, and evaluating their digital advertising endeavors.

Stakeholders

  • AdTech vendors
  • AdTech service vendors
  • Managed service providers
  • Support and maintenance service providers
  • System Integrators (SIs)/migration service providers
  • Value-added Resellers (VARs) and distributors
  • Distributors and Value-added Resellers (VARs)
  • System Integrators (SIs)
  • Independent Software Vendors (ISV)
  • Third-party providers
  • Technology providers

Report Objectives

  • To define, describe, and predict the AdTech market by offering (solutions & services), advertising type, advertising media, vertical, and region.
  • To provide detailed information related to major factors (drivers, restraints, opportunities, and industry-specific challenges) influencing the market growth
  • To analyze the micro markets concerning individual growth trends, prospects, and their contribution to the total market
  • To analyze the opportunities in the market for stakeholders by identifying the high-growth segments of the AdTech market
  • To analyze opportunities in the market and provide details of the competitive landscape for stakeholders and market leaders
  • To forecast the market size of segments for five main regions: North America, Europe, Asia Pacific, the Middle East & Africa, and Latin America
  • To profile key players and comprehensively analyze their market rankings and core competencies.
  • To analyze competitive developments, such as partnerships, product launches, and mergers & acquisitions
  • To analyze the impact of recession across all the regions across the AdTech market

Available Customizations

With the given market data, MarketsandMarkets offers customizations as per your company’s specific needs. The following customization options are available for the report:

Product Analysis

  • Product quadrant, which gives a detailed comparison of the product portfolio of each company.

Geographic Analysis

  • Further breakup of the North American AdTech market
  • Further breakup of the European market
  • Further breakup of the Asia Pacific market
  • Further breakup of the Middle Eastern & African market
  • Further breakup of the Latin America AdTech market

Company Information

  • Detailed analysis and profiling of additional market players (up to five)
Custom Market Research Services

We will customize the research for you, in case the report listed above does not meet with your exact requirements. Our custom research will comprehensively cover the business information you require to help you arrive at strategic and profitable business decisions.

Request Customization
Report Code
TC 8842
Published ON
Nov, 2023
Choose License Type
BUY NOW
  • SHARE
X
Request Customization
Speak to Analyst
Speak to Analyst
OR FACE-TO-FACE MEETING
PERSONALIZE THIS RESEARCH
  • Triangulate with your Own Data
  • Get Data as per your Format and Definition
  • Gain a Deeper Dive on a Specific Application, Geography, Customer or Competitor
  • Any level of Personalization
REQUEST A FREE CUSTOMIZATION
LET US HELP YOU!
  • What are the Known and Unknown Adjacencies Impacting the AdTech Market
  • What will your New Revenue Sources be?
  • Who will be your Top Customer; what will make them switch?
  • Defend your Market Share or Win Competitors
  • Get a Scorecard for Target Partners
CUSTOMIZED WORKSHOP REQUEST
+1-888-600-6441
  • Call Us
  • +1-888-600-6441 (Corporate office hours)
  • +1-888-600-6441 (US/Can toll free)
  • +44-800-368-9399 (UK office hours)
CONNECT WITH US
ABOUT TRUST ONLINE
©2024 MarketsandMarkets Research Private Ltd. All rights reserved
DMCA.com Protection Status Website Feedback