AI in Pathology Market

AI in Pathology Market Size, Share & Trends by Component (Software, Scanners), Neural Network (CNN, GAN, RNN), Application (Drug Discovery, Diagnosis, Prognosis, Workflow, Education), End User (Pharma, Biotech, Hospital Labs, Research), & Region - Global Forecast to 2028

Report Code: HIT 8721 Jul, 2023, by marketsandmarkets.com

AI in Pathology Market Size, Share & Trends

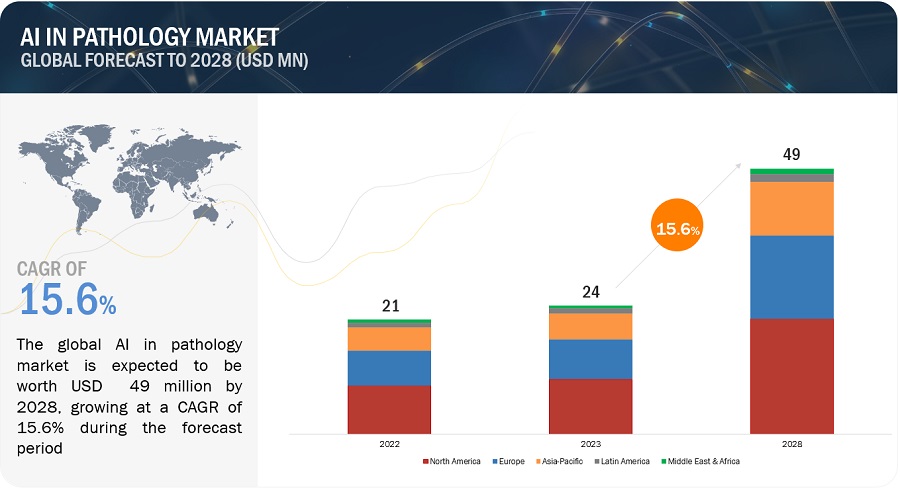
The size of global AI in pathology market in terms of revenue was estimated to be worth $24 million in 2023 and is poised to reach $49 million by 2028, growing at a CAGR of 15.6% from 2023 to 2028. The comprehensive research encompasses an exhaustive examination of industry trends, meticulous pricing analysis, patent scrutiny, insights derived from conferences and webinars, identification of key stakeholders, and a nuanced understanding of market purchasing dynamics.

AI algorithms can analyse digital pathology images to detect and classify various abnormalities, such as tumours, cancerous cells, and tissue structures. This application assists pathologists in identifying and quantifying important features, leading to more accurate diagnoses and treatment decisions. AI in pathology offers several benefits, including improved accuracy, increased efficiency, and enhanced patient care. By leveraging large datasets and training algorithms on vast amounts of annotated pathology images, AI systems can assist pathologists in detecting and characterizing abnormalities, making diagnoses, and predicting patient outcomes.

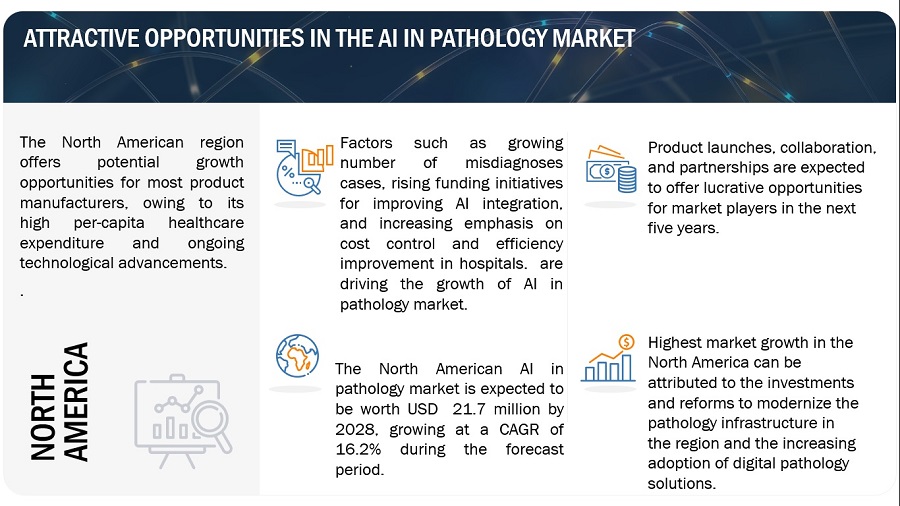
Other factors driving market growth include the rising demand for technologically advanced solutions, a growing number of misdiagnoses, rising funding initiatives for improving patient care quality, and increasing emphasis on cost control and efficiency improvement in hospitals. However, high setup and operational costs, interoperability issues, are expected to restrain market growth to a certain extent.

AI in Pathology Market Trends
AI in Pathology Market

To know about the assumptions considered for the study, Request for Free Sample Report
AI in Pathology Market

AI in Pathology Market Dynamics

Driver: Technology advancements in deep learning have enabled a synergy with artificial intelligence (AI) in pathology space

Pattern recognition and image processing advancements have created synergies between AI technology and modern pathology. Deep convolutional neural networks have shown exceptional performance in image classification. The term "digital pathology" refers to improved slide-scanning techniques combined with AI-based algorithms for detecting, segmenting, scoring, and diagnosing digitized whole-slide images.

Quantifying and standardizing clinical outcomes in pathology remains a difficulty. Computer-assisted technologies are used to accurately grade, stage, classify, and quantify responses to treatment. When given vast input data or high-quality training sets, neural network algorithms perform effectively. Such conditions were met using a digitized database of more than 100,000 clinical photos of skin disease, and a deep convolutional neural network was effectively trained to categorize skin lesions comparable to current pathology quality standards. A mechanistic understanding of the complex layers is not required with such an intuitive image-based analysis, and the approach might be applied to patient-based mobile phone platforms to improve early identification and cancer prevention. Specific deep neural network modules will eventually replace chosen steps of the standard pathology workflow. Among different computational image-recognition tasks, deep learning already performs exceptionally well in segmentation tasks such as nuclei, epithelia, or tubules, immune infiltration by lymphocyte classification, cell cycle characterization and mitosis quantification, and tumor grading. The transformation to a digital pathology lab will result in more accurate drug response prediction and prognosis of this underlying disease over time.

Restraint: High cost of digital pathology systems

The significant initial investment required to establish digital pathology systems poses a hurdle for the adoption of AI, as AI heavily relies on these systems for data acquisition and analysis. A typical digital pathology system, consisting of a slide scanner, an image server, and software, can cost anywhere from USD 500,000 to USD 1,500,000. The scanner alone carries an average price tag of around USD 250,000. In the Asia Pacific region, the average cost of a digital pathology scanner ranges from USD 110,000 to USD 130,000. While large hospitals with substantial capital budgets can afford these systems, pathologists and academic institutes with limited budgets or inadequate IT support often find them financially out of reach. Healthcare providers, especially in developing countries like India, Brazil, and Mexico, face financial constraints that hinder their ability to invest in such expensive technologies. Furthermore, the efficient operation and maintenance of digital pathology systems require trained personnel. The combination of high costs and a scarcity of skilled operators is anticipated to restrict the adoption of these systems. Consequently, the incorporation of AI into pathology will be hindered in the absence of widespread adoption of digital pathology systems.

The global transition to digital pathology in clinical settings, as well as the adoption of AI in pathology, has been sluggish. While some countries like the Netherlands and Scandinavian nations have made significant progress in this field, Germany and the US, for example, are lagging behind.

Opportunity: Shortage of skilled pathologists

Increasing prevalence of disease has increased the demand of pathology services in clinical applications. However, there exists a disparity between the availability and requirement of pathologists on a global scale, particularly in Africa and Asia. Concurrently, laboratories face the challenge of handling a rising volume of specimens with a limited workforce. These circumstances are anticipated to impede the progress of the cancer diagnostics market.

AI in pathology enables medical practitioners to remotely share important information with pathologists beyond geographical boundaries securely and timely. Since, the demand for pathology services is growing rapidly, the number of trained pathologists is not keeping pace. This shortage results in an increased workload for pathologists, longer turnaround times for diagnostic reports, leading to higher stress levels and potential delays in diagnosis. AI in pathology can alleviate this burden by automating routine tasks, assisting in slide analysis, and providing decision support. AI algorithms can quickly analyze digital pathology images, identify potential abnormalities, and provide preliminary findings. This allows pathologists to focus on complex cases, reducing turnaround times and improving overall efficiency. By augmenting pathologists' capabilities, AI can help mitigate the impact of the shortage on patient care.

Thus, the alarming shortage of pathologists is expected to result in the increased utilization of AI in pathology for providing remote pathological consultation and services.

Number of Inhabitants Per Pathologist, By Country, 2020

Country

Number of Inhabitants per Pathologist

US

25,325

Canada

20,658

Germany

47,989

Switzerland

35,355

Source: Cancer Research UK, NCBI, and the Journal of the American Medical Association

Challenge: Lack of sufficient data to train the AI algorithms

AI algorithms require large, diverse, and well-annotated datasets for training and validation. However, acquiring such datasets in pathology can be challenging due to factors like data privacy regulations, data fragmentation across multiple healthcare systems, and the need for expert annotations. Ensuring the availability of high-quality data remains a significant challenge for developing accurate and reliable AI models.

Most AI systems require many high-quality training photos. Ideally, these training images should be "labelled" (i.e., annotated). This essentially means that in all images, a pathologist must manually designate the region of interest (i.e., abnormalities or malignancy). Annotation is best conducted by professionals. Aside from the time constraints, human annotations are frequently an expensive impediment in app development. Crowdsourcing may be cheaper and quicker but has the potential to introduce noise. Pathologists may find careful annotation of huge numbers of photos, it is not only tedious, but also gets difficult when working with low resolution or blurry images, slow networks, and feature ambiguity. Active learning used to annotation could make this laborious work easier. Now, there are just a few publicly available datasets with labelled photos that can be used for this purpose.

Moreover, deep learning, which allows for the learning of very complex visual cues, has created a buzz around AI, as it has been able to address complicated computer vision challenges that were previously thought to be out of reach. As pathology is a visual task it is understandable that academia and “pure” technology companies are now working heavily on deep learning approaches for pathology. The variances between different patient types are the main issue for any pathological AI system. In a sick condition, no two patient samples are alike. To distinguish between different cell types, which is something that any machine learning system must do (even if it is hidden in some obscure features in a deep learning network), we notice that the same cell type has different characteristics in different patients, which are frequently contradictory. Machine learning model performance evaluation guidelines help assure suitable clinical efficacy and safety profile to be employed in patient care for pathology organizations with resources to generate laboratory developed tests. There are illness entities that have been reclassified throughout time, tumor diagnoses where grading has altered with updated American Joint Committee on Cancer (AJCC) staging standards, and other entities that have a considerable degree of interobserver variability. In these cases, pathology data training can be highly noisy and not generalizable to external data. Generalizability will need to be credibly evaluated for models to perform with high quality at various deployment sites.

Ai In Pathology Market Ecosystem

The ecosystem market map of the overall AI in pathology industry comprises the elements present in this market and defines these elements with a demonstration of the bodies involved. It includes products and services. The manufacturers of various products include the organizations involved in the entire process of research, product development, optimization, and launch. Distributors include third parties and e-commerce sites linked with organizations for the distribution of products and software. The services are offered to end-users by vendors either directly or in collaboration with a third party.
AI in Pathology Market Ecosystem

Software segment was the fastest growing segment in the component type of AI in pathology industry in 2022.

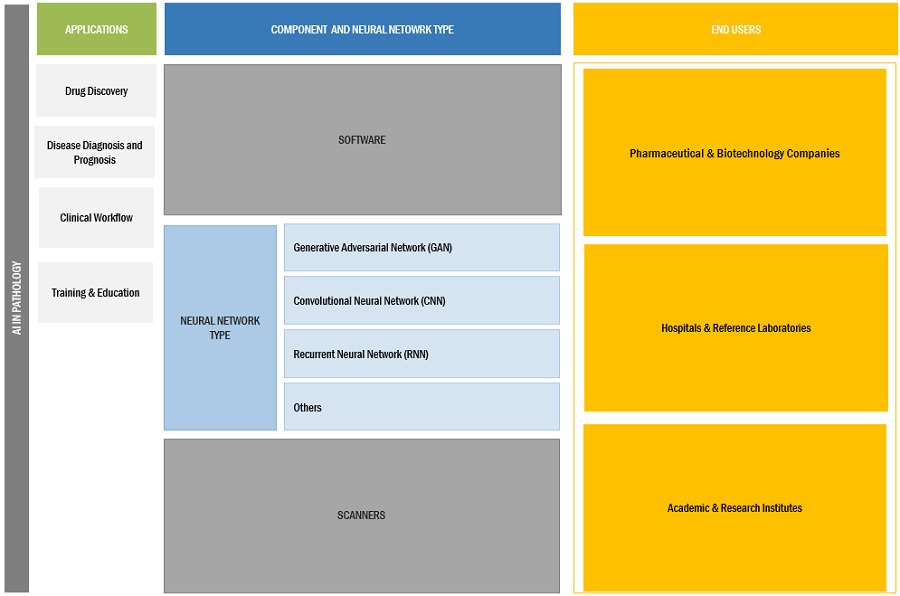
The global AI in pathology market is divided into two main components: software and scanners. In 2022, the software segment emerged as the segment with highest growth rate in the global market. This significant share can be attributed to the widespread acceptance and utilization of AI-based software by pathologists. The software segment offers several advantages, including high adaptability, interoperability, and the automation of various pathology tasks such as image analysis, data extraction, and report generation. These factors drive the adoption and advancement of AI software in pathology, presenting substantial potential for advancements in disease detection, diagnosis, and treatment planning.

Convolutional neural network (CNN) is the fastest growing segment in the AI in pathology industry in 2022.

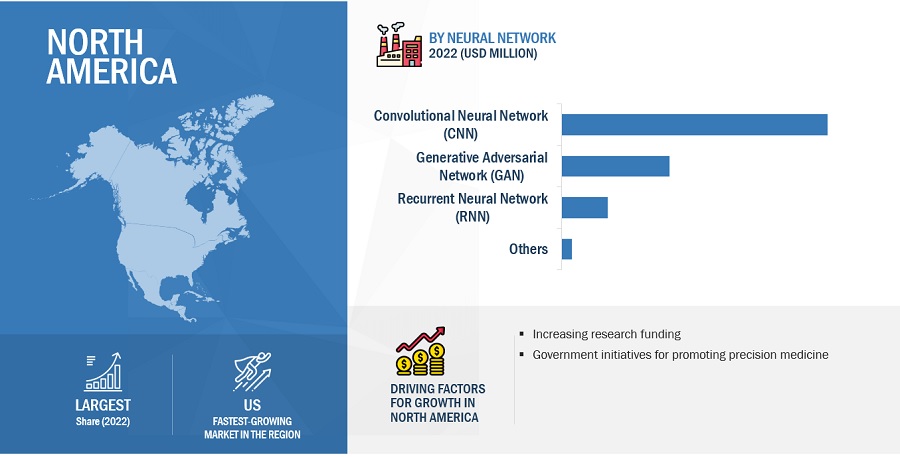
The AI in pathology market is categorized into different neural network types, including generative adversarial network (GAN), convolutional neural network (CNN), recurrent neural network (RNN), and others. In 2022, the convolutional neural network segment is projected to exhibit the highest growth rate. The remarkable growth rate of this segment can be attributed to its exceptional ability to analyze intricate visual data, such as pathology images, extract pertinent features, and provide precise diagnoses. Additionally, CNN facilitates the localization and segmentation of regions of interest within images, while also possessing the capability to continuously learn and enhance its performance over time by leveraging new data and incorporating feedback from pathologists.

North America region of the AI in pathology industry to witness the highest growth rate during the forecast period.

The North American AI in pathology market is projected to grow at the highest CAGR during the forecast period. Market growth in the North America region is mainly driven by factors such as the investments and reforms to modernize the pathology infrastructure in the region and the increasing adoption of digital pathology solutions. The other factors augmenting market growth in this region are the ongoing expansion of the healthcare infrastructure and the growing market availability of advanced AI technologies.
AI in Pathology Market by Region

To know about the assumptions considered for the study, download the pdf brochure

The products and software market are dominated by a few globally established players such as include Koninklijke Philips N.V. (Netherlands), F. Hoffmann-La Roche Ltd (Switzerland), Hologic, Inc. (US) among others.

Scope of the AI in Pathology Industry

Report Metric 

Details 

Market Revenue in 2023

$24 million

Projected Revenue by 2028

$49 million

Revenue Rate

Poised to Grow at a CAGR of 15.6%

Market Driver

Technology advancements in deep learning have enabled a synergy with artificial intelligence (AI) in pathology space

Market Opportunity

Shortage of skilled pathologists

The study categorizes AI in pathology market to forecast revenue and analyze trends in each of the following submarkets:

By Component

  • Introduction
  • Software
  • Scanners

By Neural Network

  • Introduction
  • Generative adversarial networks (GANs)
  • Convolutional neural networks (CNNs)
  • Recurrent neural networks (RNNs)
  • Others

By Application

  • Introduction
  • Drug Discovery
  • Disease Diagnosis & Prognosis
  • Clinical Workflow
  • Training & Education

By End User

  • Introduction
  • Pharmaceutical & Biotechnology Companies
  • Hospitals & Reference Laboratories
  • Academic & Research Institutes

By Region

  • North America
    • US
    • Canada
  • Europe
    • Germany
    • UK
    • France
    • Rest Of Europe
  • Asia Pacific
    • Japan
    • China
    • Rest of APAC
  • Latin America
  • Middle East & Africa

Recent Developments of AI in Pathology Industry

  • In April 2023, Indica Labs Inc. (US) signed an agreement with Lunit Inc. (South Korea). The agreement helped to provide a fully interoperable solution between Indica Labs' HALO AP image management software platform and Lunit's suite of AI pathology products.
  • In March 2022, Ibex Medical Analytics Ltd. (Isarel) had partnered with Dedalus Group (Italy). Through this partnership, the company aimed to bring the power of artificial intelligence to digital pathology.
  • In January 2022, Aiforia Technologies Plc (Finland) collaborated with Mayo Clinic (US). Under this collaboration, AI-powered pathology research support architecture was established at the Mayo Clinic to enable faster results and scalable studies in translational research.
  • In December 2021, F. Hoffmann-La Roche Ltd. (Switzerland) launched its artificial intelligence (AI)-based digital pathology algorithms to help pathologists evaluate breast cancer markers such as Ki-67, ER, and PR.

Frequently Asked Questions (FAQ):

To speak to our analyst for a discussion on the above findings, click Speak to Analyst

TABLE OF CONTENTS
 
1 INTRODUCTION (Page No. - 24)
    1.1 STUDY OBJECTIVES 
    1.2 MARKET DEFINITION 
           1.2.1 INCLUSIONS AND EXCLUSIONS
    1.3 MARKETS COVERED 
           1.3.1 AI IN PATHOLOGY MARKET SEGMENTATION, BY REGION
           1.3.2 YEARS CONSIDERED
    1.4 CURRENCY CONSIDERED 
    1.5 STAKEHOLDERS 
    1.6 RECESSION IMPACT 
 
2 RESEARCH METHODOLOGY (Page No. - 28)
    2.1 RESEARCH APPROACH 
          FIGURE 1 RESEARCH DESIGN
           2.1.1 SECONDARY RESEARCH
                    2.1.1.1 Key data from secondary sources
           2.1.2 PRIMARY DATA
                    FIGURE 2 PRIMARY SOURCES
                    2.1.2.1 Key data from primary sources
                    2.1.2.2 Insights from primary experts
                                FIGURE 3 BREAKDOWN OF PRIMARY INTERVIEWS: BY COMPANY TYPE, DESIGNATION, AND REGION
    2.2 MARKET SIZE ESTIMATION 
          FIGURE 4 SUPPLY-SIDE MARKET SIZE ESTIMATION: REVENUE SHARE ANALYSIS
          FIGURE 5 AI IN PATHOLOGY MARKET: CAGR PROJECTIONS
           2.2.1 TOP-DOWN APPROACH
    2.3 MARKET BREAKDOWN AND DATA TRIANGULATION 
          FIGURE 6 DATA TRIANGULATION METHODOLOGY
    2.4 MARKET RANKING ANALYSIS 
    2.5 STUDY ASSUMPTIONS 
    2.6 LIMITATIONS 
           2.6.1 METHODOLOGY-RELATED LIMITATIONS
           2.6.2 SCOPE-RELATED LIMITATIONS
    2.7 RISK ASSESSMENT 
          TABLE 1 AI IN PATHOLOGY MARKET: RISK ASSESSMENT
    2.8 RECESSION IMPACT ANALYSIS 
 
3 EXECUTIVE SUMMARY (Page No. - 39)
    FIGURE 7 AI IN PATHOLOGY MARKET, BY COMPONENT, 2023 VS. 2028 (USD MILLION)
    FIGURE 8 AI IN PATHOLOGY MARKET, BY NEURAL NETWORK, 2023 VS. 2028 (USD MILLION)
    FIGURE 9 AI IN PATHOLOGY MARKET, BY APPLICATION, 2023 VS. 2028 (USD MILLION)
    FIGURE 10 AI IN PATHOLOGY MARKET, BY END USER, 2023 VS. 2028 (USD MILLION)
    FIGURE 11 GEOGRAPHICAL SNAPSHOT OF AI IN PATHOLOGY MARKET
 
4 PREMIUM INSIGHTS (Page No. - 44)
    4.1 AI IN PATHOLOGY MARKET OVERVIEW 
          FIGURE 12 GROWING DIGITIZATION OF PATHOLOGY TO DRIVE MARKET GROWTH
    4.2 ASIA PACIFIC: AI IN PATHOLOGY MARKET, BY COMPONENT AND COUNTRY 
          FIGURE 13 SOFTWARE SEGMENT TO COMMAND LARGEST SHARE OF ASIA PACIFIC MARKET IN 2023
    4.3 GEOGRAPHIC SNAPSHOT OF AI IN PATHOLOGY MARKET 
          FIGURE 14 MARKET IN UK TO GROW AT HIGHEST CAGR
    4.4 REGIONAL MIX: AI IN PATHOLOGY MARKET 
          FIGURE 15 NORTH AMERICA TO WITNESS HIGHEST GROWTH DURING FORECAST PERIOD
    4.5 AI IN PATHOLOGY MARKET: DEVELOPED VS. DEVELOPING MARKETS 
          FIGURE 16 DEVELOPED MARKETS TO REGISTER HIGHER GROWTH RATES
 
5 MARKET OVERVIEW (Page No. - 48)
    5.1 INTRODUCTION 
    5.2 MARKET DYNAMICS 
          FIGURE 17 AI IN PATHOLOGY MARKET: DRIVERS, RESTRAINTS, OPPORTUNITIES, AND CHALLENGES
          TABLE 2 DRIVERS, RESTRAINTS, OPPORTUNITIES, AND CHALLENGES: IMPACT ANALYSIS
           5.2.1 DRIVERS
                    5.2.1.1 Increasing number of partnerships and collaborations among players to develop and launch advanced AI in pathology solutions
                    5.2.1.2 Growing digitalization of pathology
                    5.2.1.3 Growing cases of misdiagnoses
                    5.2.1.4 Augmenting telepathology with AI advancements
                    5.2.1.5 Technological advancements in deep learning
           5.2.2 RESTRAINTS
                    5.2.2.1 High cost of digital pathology systems
                    5.2.2.2 Shortage of skilled AI workforce and ambiguous regulatory guidelines for medical software
           5.2.3 OPPORTUNITIES
                    5.2.3.1 Growing demand for personalized medicine
                                TABLE 3 US: GROWTH IN NUMBER OF PERSONALIZED MEDICINES (2008–2020)
                                FIGURE 18 FDA-APPROVED PERSONALIZED MEDICINES, 2015–2021
                    5.2.3.2 Shortage of skilled pathologists
                                TABLE 4 NUMBER OF INHABITANTS PER PATHOLOGIST, BY COUNTRY, 2020
           5.2.4 CHALLENGES
                    5.2.4.1 Lack of sufficient data to train AI algorithms
                    5.2.4.2 Data privacy concerns
                                FIGURE 19 HEALTHCARE BREACHES REPORTED TO US DEPARTMENT OF HEALTH AND HUMAN SERVICES, 2021
                    5.2.4.3 Lack of transparency and interoperability
 
6 INDUSTRY INSIGHTS (Page No. - 57)
    6.1 INDUSTRY TRENDS 
           6.1.1 IMPROVED QUALITY CONTROL WITH ARTIFICIAL INTELLIGENCE
           6.1.2 TRANSFORMATION IN STAINING TECHNIQUES
    6.2 INCREASING INVESTMENTS FOR AI IN PATHOLOGY 
    6.3 TECHNOLOGY ANALYSIS 
           6.3.1 MACHINE LEARNING (ML) AND DEEP LEARNING (DL)
           6.3.2 IMAGE ANALYSIS AND COMPUTER VISION
           6.3.3 NATURAL LANGUAGE PROCESSING (NLP)
           6.3.4 DATA INTEGRATION AND FUSION
           6.3.5 AUGMENTED PATHOLOGY AND DECISION SUPPORT SYSTEMS
           6.3.6 PREDICTIVE ANALYTICS AND PROGNOSTIC MODELS
           6.3.7 CLOUD COMPUTING AND BIG DATA INFRASTRUCTURE
    6.4 PORTER’S FIVE FORCES ANALYSIS 
           FIGURE 20 AI IN PATHOLOGY MARKET MARKED BY MODERATE TO HIGH COMPETITIVE INTENSITY AMONG MARKET PLAYERS
           TABLE 5 AI IN PATHOLOGY MARKET: PORTER’S FIVE FORCES ANALYSIS
           6.4.1 THREAT OF NEW ENTRANTS
           6.4.2 THREAT OF SUBSTITUTES
           6.4.3 BARGAINING POWER OF SUPPLIERS
           6.4.4 BARGAINING POWER OF BUYERS
           6.4.5 INTENSITY OF COMPETITIVE RIVALRY
    6.5 REGULATORY ANALYSIS 
           6.5.1 REGULATORY BODIES, GOVERNMENT AGENCIES, AND OTHER ORGANIZATIONS
                    TABLE 6 REGULATORY BODIES, GOVERNMENT AGENCIES, AND OTHER ORGANIZATIONS
           6.5.2 REGULATORY ANALYSIS, BY REGION
                    6.5.2.1 North America
                               6.5.2.1.1 US
                                              TABLE 7 US FDA: MEDICAL DEVICE CLASSIFICATION
                                              TABLE 8 US: MEDICAL DEVICE REGULATORY APPROVAL PROCESS
                               6.5.2.1.2 Canada
                                              TABLE 9 CANADA: MEDICAL DEVICE REGULATORY APPROVAL PROCESS
                    6.5.2.2 Europe
                                TABLE 10 EUROPE: CLASSIFICATION OF IVD DEVICES
                                FIGURE 21 EUROPE: IVDR TIMELINE
                    6.5.2.3 Asia Pacific
                               6.5.2.3.1 Japan
                                              TABLE 11 JAPAN: MEDICAL DEVICE CLASSIFICATION UNDER PMDA
                               6.5.2.3.2 China
                                              TABLE 12 CHINA: CLASSIFICATION OF MEDICAL DEVICES
    6.6 VALUE-CHAIN ANALYSIS 
          FIGURE 22 VALUE-CHAIN ANALYSIS (2022)
    6.7 ECOSYSTEM 
          FIGURE 23 AI IN PATHOLOGY MARKET: ECOSYSTEM
    6.8 PATENT ANALYSIS 
           6.8.1 PATENT PUBLICATION TRENDS FOR AI IN PATHOLOGY SOLUTIONS
                    FIGURE 24 NUMBER OF PATENTS PUBLISHED, JANUARY 2013 TO MAY 2023
           6.8.2 JURISDICTION AND TOP APPLICANT ANALYSIS
                    FIGURE 25 TOP APPLICANTS AND OWNERS (COMPANIES/INSTITUTIONS) FOR AI IN PATHOLOGY PATENTS (JANUARY 2013 TO MAY 2023)
                    FIGURE 26 TOP APPLICANT COUNTRIES/REGIONS FOR AI IN PATHOLOGY PATENTS (JANUARY 2013 TO MAY 2023)
    6.9 KEY CONFERENCES AND EVENTS, 2023–2024 
          TABLE 13 AI IN PATHOLOGY MARKET: LIST OF CONFERENCES AND EVENTS
    6.10 CASE STUDY ANALYSIS 
           6.10.1 CASE STUDY 1: PATHAI USES PYTORCH TO IMPROVE PATIENT OUTCOMES WITH AI-POWERED PATHOLOGY
           6.10.2 CASE STUDY 2: COMBATING CERVICAL CANCER WITH AI
    6.11 PRICING ANALYSIS 
    6.12 KEY STAKEHOLDERS AND BUYING CRITERIA 
           6.12.1 KEY STAKEHOLDERS IN BUYING PROCESS
                     FIGURE 27 INFLUENCE OF STAKEHOLDERS ON BUYING PROCESS OF AI IN PATHOLOGY PRODUCTS
                     TABLE 14 INFLUENCE OF STAKEHOLDERS ON BUYING PROCESS OF AI IN PATHOLOGY PRODUCTS (%)
           6.12.2 BUYING CRITERIA
                     FIGURE 28 KEY BUYING CRITERIA FOR AI IN PATHOLOGY PRODUCTS
                     TABLE 15 KEY BUYING CRITERIA FOR AI IN PATHOLOGY PRODUCTS
 
7 AI IN PATHOLOGY MARKET, BY COMPONENT (Page No. - 77)
    7.1 INTRODUCTION 
          TABLE 16 AI IN PATHOLOGY MARKET, BY COMPONENT, 2021–2028 (USD MILLION)
    7.2 SOFTWARE 
           7.2.1 INTELLIGENT SOFTWARE HELPS REDUCE ERRORS CAUSED BY STANDARD PATHOLOGY APPROACHES
                    TABLE 17 AI IN PATHOLOGY SOFTWARE MARKET, BY COUNTRY, 2021–2028 (USD MILLION)
    7.3 SCANNERS 
           7.3.1 USE OF AI IN SCANNERS ENHANCES SCANNING PROCESS AND IMPROVES IMAGE QUALITY
                    TABLE 18 AI IN PATHOLOGY SCANNERS MARKET, BY COUNTRY, 2021–2028 (USD MILLION)
 
8 AI IN PATHOLOGY MARKET, BY NEURAL NETWORK (Page No. - 81)
    8.1 INTRODUCTION 
          TABLE 19 AI IN PATHOLOGY MARKET, BY NEURAL NETWORK, 2021–2028 (USD MILLION)
    8.2 CONVOLUTIONAL NEURAL NETWORKS 
           8.2.1 CONVOLUTIONAL NEURAL NETWORKS SEGMENT TO ACCOUNT FOR LARGEST MARKET SHARE DURING FORECAST PERIOD
                    TABLE 20 AI IN PATHOLOGY MARKET FOR CONVOLUTIONAL NEURAL NETWORKS, BY COUNTRY, 2021–2028 (USD MILLION)
    8.3 GENERATIVE ADVERSARIAL NETWORKS 
           8.3.1 GENERATED SYNTHETIC PATHOLOGY IMAGES CLOSELY RESEMBLE REAL PATHOLOGY
                    TABLE 21 AI IN PATHOLOGY MARKET FOR GENERATIVE ADVERSARIAL NETWORKS, BY COUNTRY, 2021–2028 (USD MILLION)
    8.4 RECURRENT NEURAL NETWORKS 
           8.4.1 ABILITY OF RECURRENT NEURAL NETWORKS TO ANALYZE TIME-DEPENDENT PATTERNS TO PROPEL GROWTH
                    TABLE 22 AI IN PATHOLOGY MARKET FOR RECURRENT NEURAL NETWORKS, BY COUNTRY, 2021–2028 (USD MILLION)
    8.5 OTHER NEURAL NETWORKS 
          TABLE 23 AI IN PATHOLOGY MARKET FOR OTHER NEURAL NETWORKS, BY COUNTRY, 2021–2028 (USD MILLION)
 
9 AI IN PATHOLOGY MARKET, BY APPLICATION (Page No. - 88)
    9.1 INTRODUCTION 
          TABLE 24 AI IN PATHOLOGY MARKET, BY APPLICATION, 2021–2028 (USD MILLION)
    9.2 DRUG DISCOVERY 
           9.2.1 DRUG DISCOVERY SEGMENT TO ACCOUNT FOR LARGEST MARKET SHARE DURING FORECAST PERIOD
                    TABLE 25 APPLICATIONS OF AI IN PATHOLOGY IN DRUG DISCOVERY
                    TABLE 26 AI IN PATHOLOGY MARKET FOR DRUG DISCOVERY, BY COUNTRY, 2021–2028 (USD MILLION)
    9.3 DISEASE DIAGNOSIS AND PROGNOSIS 
           9.3.1 GROWING USE OF AI AND ML FOR DIAGNOSTIC AND PROGNOSTIC PURPOSES TO PROPEL GROWTH
                    TABLE 27 AI IN PATHOLOGY MARKET FOR DISEASE DIAGNOSIS AND PROGNOSIS, BY COUNTRY, 2021–2028 (USD MILLION)
    9.4 CLINICAL WORKFLOW OPTIMIZATION 
           9.4.1 ADVANTAGES OF AI IN ENHANCING CLINICAL WORKFLOWS BY AUTOMATING REPETITIVE TASKS TO DRIVE GROWTH
                    TABLE 28 AI IN PATHOLOGY MARKET FOR CLINICAL WORKFLOW OPTIMIZATION, BY COUNTRY, 2021–2028 (USD MILLION)
    9.5 TRAINING AND EDUCATION 
           9.5.1 APPLICATIONS IN IMPROVING TRAINING AND EDUCATION PROVIDED TO PATHOLOGISTS IN ACADEMIC INSTITUTES TO DRIVE GROWTH
                    TABLE 29 AI IN PATHOLOGY MARKET FOR TRAINING AND EDUCATION, BY COUNTRY, 2021–2028 (USD MILLION)
 
10 AI IN PATHOLOGY MARKET, BY END USER (Page No. - 96)
     10.1 INTRODUCTION 
             TABLE 30 AI IN PATHOLOGY MARKET, BY END USER, 2021–2028 (USD MILLION)
     10.2 PHARMACEUTICAL AND BIOTECHNOLOGY COMPANIES 
             10.2.1 RISING USE OF AI-BASED DIGITAL PATHOLOGY SOLUTIONS IN DRUG DEVELOPMENT TO DRIVE GROWTH
                        TABLE 31 AI IN PATHOLOGY MARKET FOR PHARMACEUTICAL AND BIOTECHNOLOGY COMPANIES, BY COUNTRY, 2021–2028 (USD MILLION)
     10.3 HOSPITALS AND REFERENCE LABORATORIES 
             10.3.1 RISING NUMBER OF HOSPITALIZATIONS DUE TO INCREASING INCIDENCE OF INFECTIOUS DISEASES TO DRIVE GROWTH
                        TABLE 32 AI IN PATHOLOGY MARKET FOR HOSPITALS AND REFERENCE LABORATORIES, BY COUNTRY, 2021–2028 (USD MILLION)
     10.4 ACADEMIC AND RESEARCH INSTITUTES 
             10.4.1 INCREASING INVESTMENTS FOR RESEARCH IN DISEASE DIAGNOSIS TO SUPPORT GROWTH
                        TABLE 33 AI IN PATHOLOGY MARKET FOR ACADEMIC AND RESEARCH INSTITUTES, BY COUNTRY, 2021–2028 (USD MILLION)
 
11 AI IN PATHOLOGY MARKET, BY REGION (Page No. - 101)
     11.1 INTRODUCTION 
             TABLE 34 AI IN PATHOLOGY MARKET, BY REGION, 2021–2028 (USD MILLION)
     11.2 NORTH AMERICA 
             FIGURE 29 NORTH AMERICA: AI IN PATHOLOGY MARKET SNAPSHOT
             TABLE 35 NORTH AMERICA: AI IN PATHOLOGY MARKET, BY COUNTRY, 2021–2028 (USD MILLION)
             TABLE 36 NORTH AMERICA: AI IN PATHOLOGY MARKET, BY COMPONENT, 2021–2028 (USD MILLION)
             TABLE 37 NORTH AMERICA: AI IN PATHOLOGY MARKET, BY NEURAL NETWORK, 2021–2028 (USD MILLION)
             TABLE 38 NORTH AMERICA: AI IN PATHOLOGY MARKET, BY APPLICATION, 2021–2028 (USD MILLION)
             TABLE 39 NORTH AMERICA: AI IN PATHOLOGY MARKET, BY END USER, 2021–2028 (USD MILLION)
             11.2.1 NORTH AMERICA: RECESSION IMPACT
             11.2.2 US
                        11.2.2.1 US to dominate North American market during forecast period
                                      TABLE 40 US: AI IN PATHOLOGY MARKET, BY COMPONENT, 2021–2028 (USD MILLION)
                                      TABLE 41 US: AI IN PATHOLOGY MARKET, BY NEURAL NETWORK, 2021–2028 (USD MILLION)
                                      TABLE 42 US: AI IN PATHOLOGY MARKET, BY APPLICATION, 2021–2028 (USD MILLION)
                                      TABLE 43 US: AI IN PATHOLOGY MARKET, BY END USER, 2021–2028 (USD MILLION)
             11.2.3 CANADA
                        11.2.3.1 Increasing research in pathology to drive growth
                                      TABLE 44 CANADA: AI IN PATHOLOGY MARKET, BY COMPONENT, 2021–2028 (USD MILLION)
                                      TABLE 45 CANADA: AI IN PATHOLOGY MARKET, BY NEURAL NETWORK, 2021–2028 (USD MILLION)
                                      TABLE 46 CANADA: AI IN PATHOLOGY MARKET, BY APPLICATION, 2021–2028 (USD MILLION)
                                      TABLE 47 CANADA: AI IN PATHOLOGY MARKET, BY END USER, 2021–2028 (USD MILLION)
     11.3 EUROPE 
             TABLE 48 EUROPE: AI IN PATHOLOGY MARKET, BY COUNTRY, 2021–2028 (USD MILLION)
             TABLE 49 EUROPE: AI IN PATHOLOGY MARKET, BY COMPONENT, 2021–2028 (USD MILLION)
             TABLE 50 EUROPE: AI IN PATHOLOGY MARKET, BY NEURAL NETWORK, 2021–2028 (USD MILLION)
             TABLE 51 EUROPE: AI IN PATHOLOGY MARKET, BY APPLICATION, 2021–2028 (USD MILLION)
             TABLE 52 EUROPE: AI IN PATHOLOGY MARKET, BY END USER, 2021–2028 (USD MILLION)
             11.3.1 EUROPE: RECESSION IMPACT
             11.3.2 UK
                        11.3.2.1 Adoption of AI in pathology for drug discovery to fuel growth
                                      TABLE 53 UK: AI IN PATHOLOGY MARKET, BY COMPONENT, 2021–2028 (USD MILLION)
                                      TABLE 54 UK: AI IN PATHOLOGY MARKET, BY NEURAL NETWORK, 2021–2028 (USD MILLION)
                                      TABLE 55 UK: AI IN PATHOLOGY MARKET, BY APPLICATION, 2021–2028 (USD MILLION)
                                      TABLE 56 UK: AI IN PATHOLOGY MARKET, BY END USER, 2021–2028 (USD MILLION)
             11.3.3 GERMANY
                        11.3.3.1 Availability of funding for AI initiatives to boost growth
                                      TABLE 57 GERMANY: AI IN PATHOLOGY MARKET, BY COMPONENT, 2021–2028 (USD MILLION)
                                      TABLE 58 GERMANY: AI IN PATHOLOGY MARKET, BY NEURAL NETWORK, 2021–2028 (USD MILLION)
                                      TABLE 59 GERMANY: AI IN PATHOLOGY MARKET, BY APPLICATION, 2021–2028 (USD MILLION)
                                      TABLE 60 GERMANY: AI IN PATHOLOGY MARKET, BY END USER, 2021–2028 (USD MILLION)
             11.3.4 FRANCE
                        11.3.4.1 Increasing government funding and favorable insurance system to drive growth
                                      TABLE 61 FRANCE: AI IN PATHOLOGY MARKET, BY COMPONENT, 2021–2028 (USD MILLION)
                                      TABLE 62 FRANCE: AI IN PATHOLOGY MARKET, BY NEURAL NETWORK, 2021–2028 (USD MILLION)
                                      TABLE 63 FRANCE: AI IN PATHOLOGY MARKET, BY APPLICATION, 2021–2028 (USD MILLION)
                                      TABLE 64 FRANCE: AI IN PATHOLOGY MARKET, BY END USER, 2021–2028 (USD MILLION)
             11.3.5 REST OF EUROPE
                        TABLE 65 REST OF EUROPE: AI IN PATHOLOGY MARKET, BY COMPONENT, 2021–2028 (USD MILLION)
                        TABLE 66 REST OF EUROPE: AI IN PATHOLOGY MARKET, BY NEURAL NETWORK, 2021–2028 (USD MILLION)
                        TABLE 67 REST OF EUROPE: AI IN PATHOLOGY MARKET, BY APPLICATION, 2021–2028 (USD MILLION)
                        TABLE 68 REST OF EUROPE: AI IN PATHOLOGY MARKET, BY END USER, 2021–2028 (USD MILLION)
     11.4 ASIA PACIFIC 
             TABLE 69 ASIA PACIFIC: AI IN PATHOLOGY MARKET, BY COUNTRY, 2021–2028 (USD MILLION)
             TABLE 70 ASIA PACIFIC: AI IN PATHOLOGY MARKET, BY COMPONENT, 2021–2028 (USD MILLION)
             TABLE 71 ASIA PACIFIC: AI IN PATHOLOGY MARKET, BY NEURAL NETWORK, 2021–2028 (USD MILLION)
             TABLE 72 ASIA PACIFIC: AI IN PATHOLOGY MARKET, BY APPLICATION, 2021–2028 (USD MILLION)
             TABLE 73 ASIA PACIFIC: AI IN PATHOLOGY MARKET, BY END USER, 2021–2028 (USD MILLION)
             11.4.1 ASIA PACIFIC: RECESSION IMPACT
             11.4.2 CHINA
                        11.4.2.1 Rising geriatric population to drive demand for AI in pathology products
                                      TABLE 74 CHINA: CANCER INCIDENCE, BY CANCER TYPE, 2020 VS. 2040
                                      TABLE 75 CHINA: AI IN PATHOLOGY MARKET, BY COMPONENT, 2021–2028 (USD MILLION)
                                      TABLE 76 CHINA: AI IN PATHOLOGY MARKET, BY NEURAL NETWORK, 2021–2028 (USD MILLION)
                                      TABLE 77 CHINA: AI IN PATHOLOGY MARKET, BY APPLICATION, 2021–2028 (USD MILLION)
                                      TABLE 78 CHINA: AI IN PATHOLOGY MARKET, BY END USER, 2021–2028 (USD MILLION)
             11.4.3 JAPAN
                        11.4.3.1 Advanced healthcare infrastructure to support market growth
                                      TABLE 79 JAPAN: CANCER INCIDENCE, BY CANCER TYPE, 2020 VS. 2040
                                      TABLE 80 JAPAN: AI IN PATHOLOGY MARKET, BY COMPONENT, 2021–2028 (USD MILLION)
                                      TABLE 81 JAPAN: AI IN PATHOLOGY MARKET, BY NEURAL NETWORK, 2021–2028 (USD MILLION)
                                      TABLE 82 JAPAN: AI IN PATHOLOGY MARKET, BY APPLICATION, 2021–2028 (USD MILLION)
                                      TABLE 83 JAPAN: AI IN PATHOLOGY MARKET, BY END USER, 2021–2028 (USD MILLION)
             11.4.4 REST OF ASIA PACIFIC
                        TABLE 84 REST OF ASIA PACIFIC: AI IN PATHOLOGY MARKET, BY COMPONENT, 2021–2028 (USD MILLION)
                        TABLE 85 REST OF ASIA PACIFIC: AI IN PATHOLOGY MARKET, BY NEURAL NETWORK, 2021–2028 (USD MILLION)
                        TABLE 86 REST OF ASIA PACIFIC: AI IN PATHOLOGY MARKET, BY APPLICATION, 2021–2028 (USD MILLION)
                        TABLE 87 REST OF ASIA PACIFIC: AI IN PATHOLOGY MARKET, BY END USER, 2021–2028 (USD MILLION)
     11.5 LATIN AMERICA 
             TABLE 88 LATIN AMERICA: AI IN PATHOLOGY MARKET, BY COMPONENT, 2021–2028 (USD MILLION)
             TABLE 89 LATIN AMERICA: AI IN PATHOLOGY MARKET, BY NEURAL NETWORK, 2021–2028 (USD MILLION)
             TABLE 90 LATIN AMERICA: AI IN PATHOLOGY MARKET, BY APPLICATION, 2021–2028 (USD MILLION)
             TABLE 91 LATIN AMERICA: AI IN PATHOLOGY MARKET, BY END USER, 2021–2028 (USD MILLION)
             11.5.1 LATIN AMERICA: RECESSION IMPACT
     11.6 MIDDLE EAST & AFRICA 
             TABLE 92 MIDDLE EAST & AFRICA: AI IN PATHOLOGY MARKET, BY COMPONENT, 2021–2028 (USD MILLION)
             TABLE 93 MIDDLE EAST & AFRICA: AI IN PATHOLOGY MARKET, BY NEURAL NETWORK, 2021–2028 (USD MILLION)
             TABLE 94 MIDDLE EAST & AFRICA: AI IN PATHOLOGY MARKET, BY APPLICATION, 2021–2028 (USD MILLION)
             TABLE 95 MIDDLE EAST & AFRICA: AI IN PATHOLOGY MARKET, BY END USER, 2021–2028 (USD MILLION)
             11.6.1 MIDDLE EAST & AFRICA: RECESSION IMPACT
 
12 COMPETITIVE LANDSCAPE (Page No. - 140)
     12.1 INTRODUCTION 
     12.2 STRATEGIES OF KEY PLAYERS/RIGHT TO WIN 
             FIGURE 30 KEY DEVELOPMENTS UNDERTAKEN BY MAJOR PLAYERS BETWEEN JANUARY 2020 AND MAY 2023
     12.3 REVENUE ANALYSIS OF TOP MARKET PLAYERS, 2022 
             FIGURE 31 REVENUE ANALYSIS OF KEY PLAYERS
     12.4 MARKET RANKING ANALYSIS 
             FIGURE 32 AI IN PATHOLOGY MARKET RANKING ANALYSIS OF KEY PLAYERS (2022)
     12.5 COMPETITIVE BENCHMARKING 
             TABLE 96 FOOTPRINT ANALYSIS OF COMPANIES
             TABLE 97 PRODUCT FOOTPRINT ANALYSIS (25 COMPANIES)
             TABLE 98 APPLICATION FOOTPRINT ANALYSIS (25 COMPANIES)
             TABLE 99 REGIONAL FOOTPRINT ANALYSIS (25 COMPANIES)
     12.6 COMPANY EVALUATION MATRIX 
             12.6.1 STARS
             12.6.2 PERVASIVE PLAYERS
             12.6.3 EMERGING LEADERS
             12.6.4 PARTICIPANTS
                        FIGURE 33 AI IN PATHOLOGY MARKET: COMPANY EVALUATION MATRIX, 2022
     12.7 COMPANY EVALUATION MATRIX FOR START-UP/SME PLAYERS 
             12.7.1 PROGRESSIVE COMPANIES
             12.7.2 DYNAMIC COMPANIES
             12.7.3 STARTING BLOCKS
             12.7.4 RESPONSIVE COMPANIES
                        FIGURE 34 AI IN PATHOLOGY MARKET: COMPANY EVALUATION MATRIX FOR START-UP/SME PLAYERS, 2022
     12.8 COMPETITIVE SCENARIO AND TRENDS 
             12.8.1 PRODUCT LAUNCHES AND APPROVALS
                        TABLE 100 AI IN PATHOLOGY MARKET: PRODUCT LAUNCHES AND APPROVALS, 2020–2023
             12.8.2 DEALS
                        TABLE 101 AI IN PATHOLOGY MARKET: DEALS, 2020–2023
             12.8.3 OTHER DEVELOPMENTS
                        TABLE 102 AI IN PATHOLOGY MARKET: OTHER DEVELOPMENTS, 2020–2023
 
13 COMPANY PROFILES (Page No. - 154)
     13.1 KEY PLAYERS 
(Business Overview, Products/Services/Solutions Offered, MnM View, Key Strengths and Right to Win, Strategic Choices Made, Weaknesses and Competitive Threats, Recent Developments)*
             13.1.1 KONINKLIJKE PHILIPS N.V.
                        TABLE 103 KONINKLIJKE PHILIPS N.V.: BUSINESS OVERVIEW
                        FIGURE 35 KONINKLIJKE PHILIPS N.V.: COMPANY SNAPSHOT (2022)
             13.1.2 F. HOFFMANN-LA ROCHE LTD.
                        TABLE 104 F. HOFFMANN-LA ROCHE LTD.: BUSINESS OVERVIEW
                        FIGURE 36 F. HOFFMANN-LA ROCHE LTD.: COMPANY SNAPSHOT (2022)
             13.1.3 HOLOGIC, INC.
                        TABLE 105 HOLOGIC, INC.: BUSINESS OVERVIEW
                        FIGURE 37 HOLOGIC, INC.: COMPANY SNAPSHOT (2022)
             13.1.4 AKOYA BIOSCIENCES, INC.
                        TABLE 106 AKOYA BIOSCIENCES, INC.: BUSINESS OVERVIEW
                        FIGURE 38 AKOYA BIOSCIENCES, INC.: COMPANY SNAPSHOT (2022)
             13.1.5 AIFORIA TECHNOLOGIES PLC
                        TABLE 107 AIFORIA TECHNOLOGIES PLC: BUSINESS OVERVIEW
                        FIGURE 39 AIFORIA TECHNOLOGIES PLC: COMPANY SNAPSHOT (2022)
             13.1.6 INDICA LABS INC.
                        TABLE 108 INDICA LABS INC.: BUSINESS OVERVIEW
             13.1.7 OPTRASCAN, INC.
                        TABLE 109 OPTRASCAN, INC.: BUSINESS OVERVIEW
             13.1.8 IBEX MEDICAL ANALYTICS LTD.
                        TABLE 110 IBEX MEDICAL ANALYTICS LTD.: BUSINESS OVERVIEW
             13.1.9 MINDPEAK GMBH
                        TABLE 111 MINDPEAK GMBH: BUSINESS OVERVIEW
             13.1.10 TRIBUN HEALTH
                        TABLE 112 TRIBUN HEALTH: BUSINESS OVERVIEW
             13.1.11 TECHCYTE, INC.
                        TABLE 113 TECHCYTE, INC.: BUSINESS OVERVIEW
             13.1.12 DEEP BIO INC.
                        TABLE 114 DEEP BIO INC.: BUSINESS OVERVIEW
             13.1.13 LUMEA INC.
                        TABLE 115 LUMEA INC.: BUSINESS OVERVIEW
             13.1.14 VISIOPHARM
                        TABLE 116 VISIOPHARM: BUSINESS OVERVIEW
             13.1.15 AETHER AI
                        TABLE 117 AETHER AI: BUSINESS OVERVIEW
             13.1.16 AIOSYN
                        TABLE 118 AIOSYN: BUSINESS OVERVIEW
             13.1.17 PAIGE AI, INC.
                        TABLE 119 PAIGE AI, INC.: BUSINESS OVERVIEW
             13.1.18 PROSCIA, INC.
                        TABLE 120 PROSCIA, INC.: BUSINESS OVERVIEW
             13.1.19 PATHAI, INC.
                        TABLE 121 PATHAI, INC.: BUSINESS OVERVIEW
             13.1.20 TEMPUS LABS, INC.
                        TABLE 122 TEMPUS LABS, INC.: BUSINESS OVERVIEW
*Business Overview, Products/Services/Solutions Offered, MnM View, Key Strengths and Right to Win, Strategic Choices Made, Weaknesses and Competitive Threats, Recent Developments might not be captured in case of unlisted companies.
     13.2 OTHER PLAYERS 
             13.2.1 KONFOONG BIOINFORMATION TECH CO., LTD.
             13.2.2 DOMORE DIAGNOSTICS AS
             13.2.3 VERILY LIFE SCIENCES, LLC
             13.2.4 DEEPPATH
             13.2.5 4D PATH INC.
 
14 APPENDIX (Page No. - 196)
     14.1 DISCUSSION GUIDE 
     14.2 KNOWLEDGESTORE: MARKETSANDMARKETS’ SUBSCRIPTION PORTAL 
     14.3 CUSTOMIZATION OPTIONS 
     14.4 RELATED REPORTS 
     14.5 AUTHOR DETAILS 

This research study involved the extensive use of both primary and secondary sources. It involved the analysis of various factors affecting the industry to identify the segmentation types, industry trends, key players, the competitive landscape of market players, and key market dynamics such as drivers, opportunities, challenges, restraints, and key player strategies.

Secondary Research

This research study involved the wide use of secondary sources, directories, databases such as Dun & Bradstreet, Bloomberg Businessweek, and Factiva, white papers, annual reports, and companies’ house documents. Secondary research was undertaken to identify and collect information for this extensive, technical, market-oriented, and commercial study of the AI in pathology market. It was also used to obtain important information about the top players, market classification, and segmentation according to industry trends to the bottom-most level, geographic markets, and key developments related to the market. A database of the key industry leaders was also prepared using secondary research.

Primary Research

In the primary research process, various supply-side and demand-side sources were interviewed to obtain qualitative and quantitative information for this report. Primary sources from the supply side included industry experts such as CEOs, vice presidents, marketing and sales directors, technology & innovation directors, engineers, and related key executives from various companies and organizations operating in the AI in pathology market. Primary sources from the demand side included personnel from pharmaceutical & biotechnology companies, research institutes and hospitals (small, medium-sized, and large hospitals).

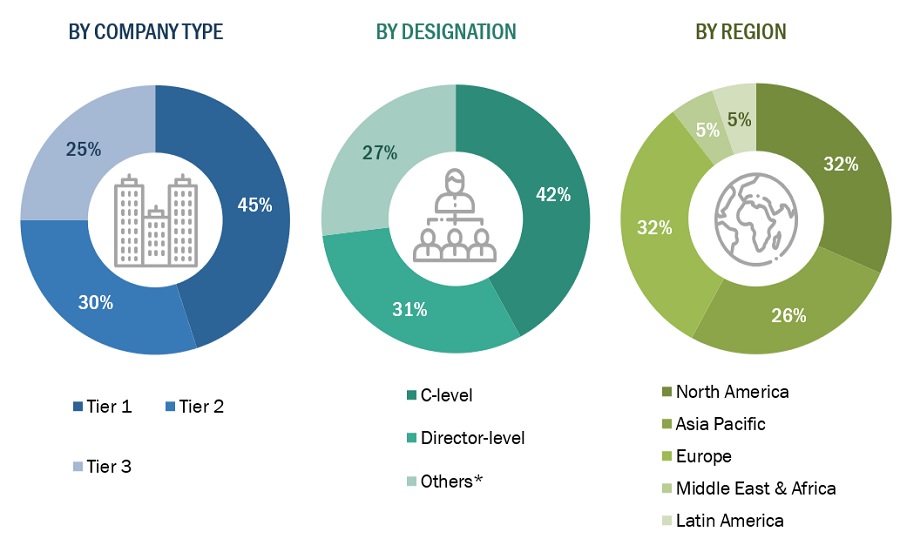
A breakdown of the primary respondents is provided below:
AI in Pathology Market Size, and Share

*Others include sales managers, marketing managers, and product managers.

Note: Tiers are defined based on a company’s total revenue, as of 2020: Tier 1 = >USD 1 billion, Tier 2 = USD 500 million to USD 1 billion, and Tier 3 = <USD 500 million.

To know about the assumptions considered for the study, download the pdf brochure

Market Size Estimation

The total size of the AI in pathology market was determined after data triangulation through the two approaches mentioned below. After the completion of each approach, the weighted average of these approaches was taken based on the level of assumptions used in each approach.

Data Triangulation

The size of the AI in pathology market was estimated through segmental extrapolation using the bottom-up approach. The methodology used is as given below:

  • Revenues for individual companies were gathered from public sources and databases.
  • Shares of leading players in the market were gathered from secondary sources to the extent available. In certain cases, shares of AI in pathology businesses have been ascertained after a detailed analysis of various parameters including product portfolios, market positioning, selling price, and geographic reach & strength. 
  • Individual shares or revenue estimates were validated through interviews with experts.
  • The total revenue in the market was determined by extrapolating the Market share data of major companies.

Market Definition

The AI in pathology market refers to the commercial space where companies develop, market, and provide products and services that incorporate artificial intelligence technologies specifically designed for pathology applications. This market focuses on leveraging AI algorithms, machine learning techniques, and advanced computational tools to enhance and automate various aspects of the pathology workflow.

This report provides a close look at AI in pathology industry. It offers applications in drug discovery, disease diagnosis & prognosis, clinical workflow, and training & education.

Key Stakeholders

  • Pathologists
  • Suppliers and Distributors of Digital Pathology Equipment
  • AI system providers
  • Medical research and biotechnology companies
  • Pharmaceutical companies and CROs
  • Hospitals and clinics
  • Laboratories
  • Regulatory Bodies
  • Medical Research Institutes
  • Artificial Intelligence (AI) in pathology solution providers
  • Universities and research organizations
  • Forums, alliances, and associations
  • Academic research institutes
  • Technology Providers
  • Healthcare Payers

Global AI in pathology market Size: Top-Down Approach

AI in Pathology Market Size, and Share

To know about the assumptions considered for the study, Request for Free Sample Report

Objectives of the Study

  • To define, describe, and forecast the market by component, neural network, application, end user, and region.
  • To provide detailed information about the major factors influencing the market growth (drivers, restraints, opportunities, and challenges)
  • To strategically analyze micromarkets1 with respect to individual growth trends, prospects, and contributions to the overall market
  • To analyze market opportunities for stakeholders and provide details of the competitive landscape for key players.
  • To forecast the size of the market segments in North America, Europe, the Asia Pacific, Latin America, and the Middle East & Africa
  • To profile key players and comprehensively analyze their market shares and core competencies in the market.
  • To benchmark players operating in the market using the Competitive Leadership Mapping framework, which analyzes key market players and start-ups on various parameters within the broad categories of market share/rank and product/service footprint.
  • To track and analyze competitive developments such as partnerships, agreements, and collaborations; mergers & acquisitions; product developments; and geographical expansions in the market.

Available Customizations

With the given market data, MarketsandMarkets offers customizations as per your company’s specific needs. The following customization options are available for the report:

Company Information

  • Detailed analysis and profiling of additional market players (up to 5)

Geographic Analysis

  • Further breakdown of the Rest of Asia Pacific AI in pathology market into India, Australia, Taiwan, New Zealand, Thailand, South Korea, Singapore, Malaysia, and other countries
  • Further breakdown of the Rest of Europe's AI in pathology market into Spain, Italy, Russia, Austria, Finland, Sweden, Turkey, Norway, Poland, Portugal, Romania, Denmark, and other countries
Custom Market Research Services

We will customize the research for you, in case the report listed above does not meet with your exact requirements. Our custom research will comprehensively cover the business information you require to help you arrive at strategic and profitable business decisions.

Request Customization
Report Code
HIT 8721
Published ON
Jul, 2023
Choose License Type
BUY NOW
  • SHARE
X
Request Customization
Speak to Analyst
Speak to Analyst
OR FACE-TO-FACE MEETING
PERSONALIZE THIS RESEARCH
  • Triangulate with your Own Data
  • Get Data as per your Format and Definition
  • Gain a Deeper Dive on a Specific Application, Geography, Customer or Competitor
  • Any level of Personalization
REQUEST A FREE CUSTOMIZATION
LET US HELP YOU!
  • What are the Known and Unknown Adjacencies Impacting the AI in Pathology Market
  • What will your New Revenue Sources be?
  • Who will be your Top Customer; what will make them switch?
  • Defend your Market Share or Win Competitors
  • Get a Scorecard for Target Partners
CUSTOMIZED WORKSHOP REQUEST
  • Call Us
  • +1-888-600-6441 (Corporate office hours)
  • +1-888-600-6441 (US/Can toll free)
  • +44-800-368-9399 (UK office hours)
CONNECT WITH US
ABOUT TRUST ONLINE
©2024 MarketsandMarkets Research Private Ltd. All rights reserved
DMCA.com Protection Status
Website Feedback