Animal Genetics Market by Products & Services (Live Animals (Poultry, Porcine, Bovine, Canine) Genetic Material (Semen (Bovine, Porcine), Embryo (Bovine, Equine)) Genetic Testing (DNA Testing, DNA Typing, Genetic Traits Testing)) - Global Forecasts to 2026
Updated on : February 23, 2023
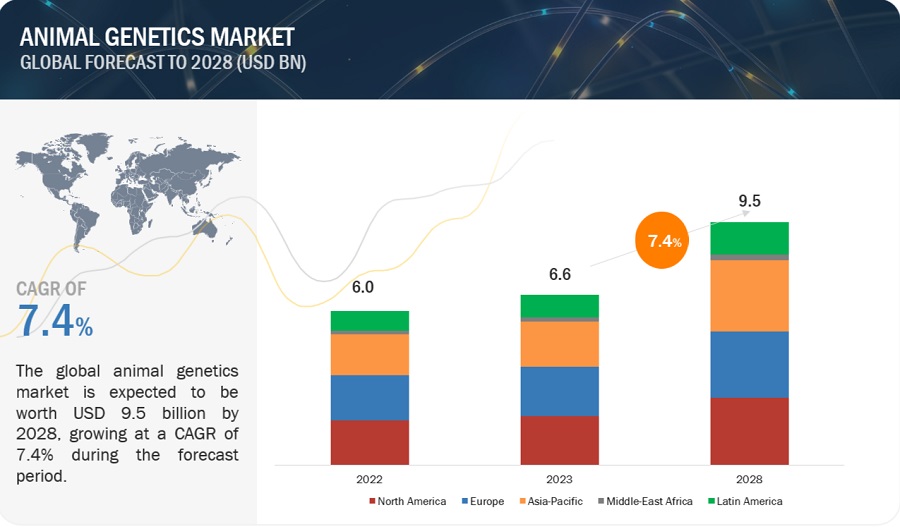
The global animal genetics market in terms of revenue was estimated to be worth $5.5 billion in 2021 and is poised to reach $7.7 billion by 2026, growing at a CAGR of 7.1% from 2021 to 2026. The growth in this market is mainly driven by the rising consumption of animal-derived protein and the increasing global population and rapid urbanization. Additionally, a growing focus on identifying superior breeds, increased adoption of genetic services to prevent genetic diseases and business loss, and increased adoption of advanced genetic technologies also contribute to the growth of the market.
To know about the assumptions considered for the study, Request for Free Sample Report
Animal Genetics Market Dynamics
Driver: increasing consumption of animal-derived protein and dairy products
Livestock and poultry are major sources of protein and calcium for humans. Animal food products such as beef, veal, dairy products, and eggs are some of the most consumed food products and are expected to see significant demand increases. The production of meat in developed countries is projected to increase significantly, mainly due to the high growth in Canada and the US. Over the next ten years, pork is set to account for a large share of the total increase in meat production, along with being the fastest-growing meat in terms of consumption. The global consumption of fresh dairy products is expected to rise significantly in the next decade due to rising populations and income growth in India and Pakistan. In some regions that are not self-sufficient in terms of dairy products—like Africa, Southeast Asia, and the Middle East—consumption is expected to surpass production, which will lead to increased dairy imports. This increase is expected to be met with milk powders, which are cheaper to export than liquid milk.
Opportunity: Untapped market potential in developing countries
Rapid growth in the overall population and growing urbanisation in developing countries, such as China, India, and Brazil, are major factors driving the demand for animal products. Besides housing the largest populations, the economies of these countries are highly reliant on agriculture and animal husbandry. To preserve the stock and conserve their productivity, the adoption of technologies like artificial insemination, genetic disease tests, and genotyping is crucial in these countries. Governments in developing countries, such as India and China, are providing funds for improving the productivity of the livestock farming industry.
Restraint: The emergence of alternatives such as lab-based meat
The increase in per capita meat consumption is partially offset by the shift towards a demand for quality products. This includes a move toward lab-based or cultured meat. Changing consumer preferences and attitudes towards meat consumption concerning its impact on health, the environment, animal welfare, and global greenhouse gas (GHG) emissions could drive demand away from animal-based protein. This may negatively impact the demand for animal-based protein in the long run, which in turn would thwart the adoption of animal genetics.
Challenge: need for specific breeding programmes for breeds with inferior economic performance
Currently, improving the productivity parameters of such animal species while maintaining their genetic superiority for secondary traits is one of the key challenges facing the animal genetics industry. Animals with inferior economic performance need special breeding programmes to improve their economic performance by producing high milk and meat yields. These animals are increasingly losing their significance in the livestock industry, as farmers have shown no interest in breeding them due to their poor economic performance. Due to this, there is currently a greater need to identify logical breeding objectives and strategies to achieve increased economic performance from such species.
The live animal segment accounted for the largest share of the animal genetics market.
The live animal segment accounted for the largest share of this market. This can be attributed to the large demand for poultry meat and eggs in developed countries and the simultaneously increasing demand for the same in developing countries due to the growing population and rapid urbanisation in these regions.
Under the live animal segment, poultry occupied the largest market share during the forecast period. The drivers of the poultry market are the strong demand for poultry and eggs in developed countries. Additionally, in developing countries, the growing population and rapid urbanisation are contributing to the rising global demand for poultry.
Under genetic material, semen held the largest share, mostly attributed to bovine semen, which held the largest share in animal semen during the forecast period. The increasing need to raise highly productive animals to meet the growing demand for meat and other animal-derived products drives the market forward.
In the genetic testing services segment, genetic disease testing contributed the largest share. The growth of this segment is driven by the growing need to increase the productivity of livestock animals and prevent the occurrence of genetic diseases. Moreover, genetic diseases impose a huge cost on the breeders in terms of loss of business. As a result, breeders are adopting genetic testing services to prevent the spread of such diseases.
To know about the assumptions considered for the study, download the pdf brochure
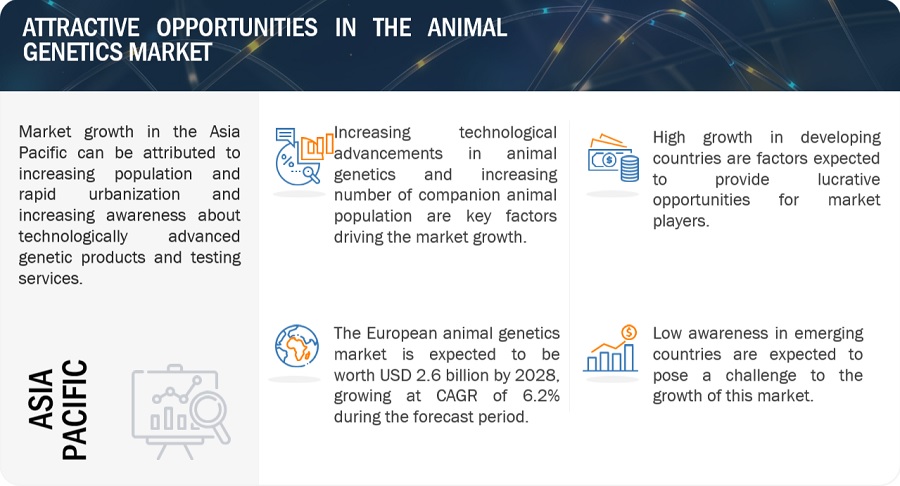
Asia-Pacific is the fastest-growing market for animal genetics during the forecast period.
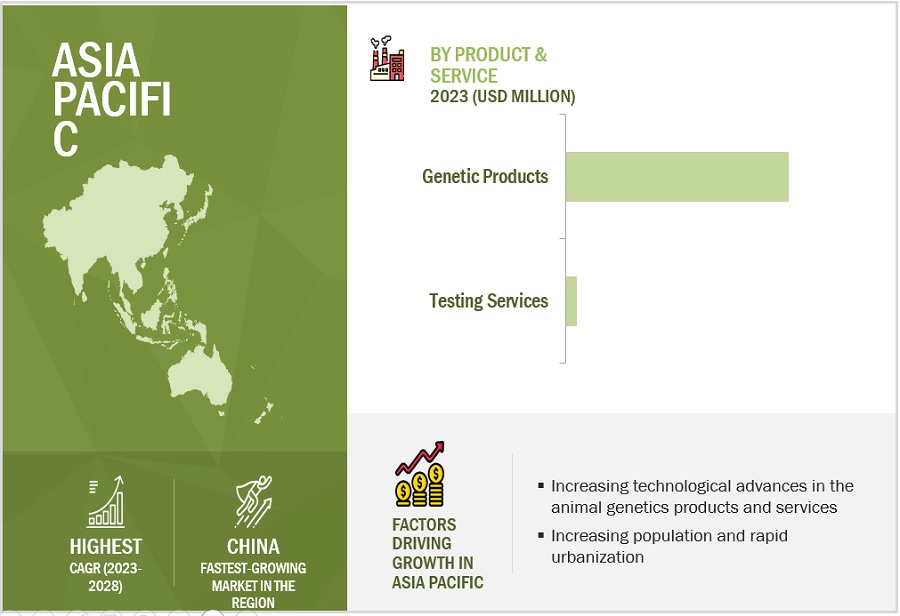
The Asia-Pacific market is projected to grow at the highest CAGR during the forecast period. The established livestock sector, growing porcine industry, increasing population and urbanization, rising per capita incomes and increasing per capita spending on animal care, and increasing awareness about technologically advanced animal genetic products and services in this region are contributing to the growth of the market in this region.
The major players in this market are Neogen Corporation (US), Genus (UK), URUS (US), EW Group (Germany), Groupe Grimaud (France), CRV Holding (Netherlands), Topigs Norsvin (Netherlands), Zoetis (US), Envigo (US), Hendix Genetics (Netherlands), and Animal Genetics (US), VetGen (US), DanBred (Denmark), Tropical Bovine Genetics (India), Trans Ova Genetics (US), Inguran LLC dba ST Genetics (US), Semex Alliance (Canada), Genetic Veterinary Sciences (US), Cobb-Vantress (US), Milk Source (US), Eurogene AI Services (Ireland).
Animal Genetics Market Report Scope:
Report Metrics |
Details |
Market Size value 2026 |
USD 7.7 billion |
Growth Rate |
7.1% Compound Annual Growth Rate (CAGR) |
Largest Market |
Asia-Pacific |
Market Dynamics |
Drivers, Opportunities, Restraints & Challenges |
Largest Share Segments |
|
Table of Content |
|
Market Segmentation |
Product Type, Services And Regional. |
Animal Genetics Market Growth Drivers |
Increasing consumption of animal-derived protein and dairy products |
Animal Genetics Market Growth Opportunities |
Untapped market potential in developing countries |
Report Highlights |
|
Geographies Covered |
North America, Europe, APAC, MEA, and Latin America |
The research report categorizes the global animal genetics market into the following segments and sub-segments:
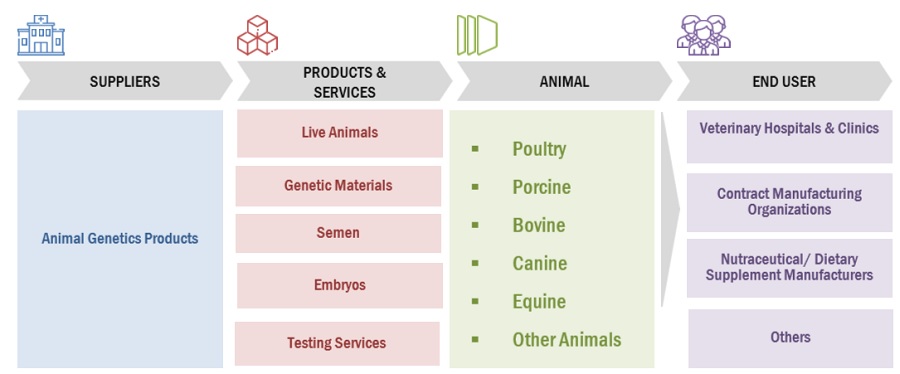
By Product
-
Animal Genetics Products
-
Live Animals
- Poultry
- Porcine
- Bovine
- Canine
- Other live animals
-
Genetic Materials
-
Semen
- Bovine semen
- Porcine semen
- Equine semen
- Canine semen
- Other animal semen
-
Embryos
- Bovine embryos
- Equine embryos
- Other animal embryos
-
Semen
-
Live Animals
-
Animal Genetic Testing Services
- Genetic Disease Tests
-
Genetic Trait Tests
- Bovine trait tests
- Other animal trait tests
- DNA Typing
- Other services
By Region
-
Europe
- France
- Germany
- UK
- Spain
- Italy
- Netherlands
- Rest of Europe
-
North America
- US
- Canada
-
Asia Pacific
- Japan
- China
- India
- Rest of Asia Pacific
-
Latin America
- Brazil
- Mexico
- Rest of Latin America
- Middle East and Africa
Frequently Asked Questions (FAQs):
What is the projected market value of the global animal genetics market?
The global market of animal genetics is projected to reach USD 7.7 billion.
What is the estimated growth rate (CAGR) of the global animal genetics market for the next five years?
The global animal genetics market is projected to grow at a Compound Annual Growth Rate (CAGR) of 7.1% from 2021 to 2026.
What are the major revenue pockets in the animal genetics market currently?
The global market is segmented into four major regions, namely, North America, Europe, Asia Pacific, Latin America and the Middle East and Africa. In 2022, North America accounted for the largest share in the global market. The growth in the North American market can be attributed to rising stem cell banking, tissue engineering, and drug discovery in the region; expansion of the healthcare sector; and the high adoption of stem cell therapy and cell immunotherapies for the treatment of cancer and chronic diseases.
To speak to our analyst for a discussion on the above findings, click Speak to Analyst
TABLE OF CONTENTS
1 INTRODUCTION (Page No. - 31)
1.1 OBJECTIVES OF THE STUDY
1.2 MARKET DEFINITION
1.2.1 INCLUSIONS AND EXCLUSIONS
1.3 MARKET SCOPE
FIGURE 1 ANIMAL GENETICS MARKET SEGMENTATION
1.3.1 YEARS CONSIDERED FOR THE STUDY
TABLE 1 EXCHANGE RATES UTILIZED FOR THE CONVERSION TO USD
1.4 STAKEHOLDERS
1.5 LIMITATIONS
1.6 SUMMARY OF CHANGES
2 RESEARCH METHODOLOGY (Page No. - 35)
2.1 RESEARCH DATA
FIGURE 2 RESEARCH DESIGN
2.1.1 SECONDARY DATA
2.1.1.1 Key data from secondary sources
2.1.2 PRIMARY DATA
FIGURE 3 PRIMARY SOURCES
2.1.2.1 Key data from primary sources
2.1.2.2 Key industry insights
FIGURE 4 BREAKDOWN OF PRIMARY INTERVIEWS: BY COMPANY TYPE, DESIGNATION, AND REGION
2.2 MARKET SIZE ESTIMATION
FIGURE 5 SUPPLY-SIDE MARKET SIZE ESTIMATION: REVENUE SHARE ANALYSIS
FIGURE 6 REVENUE SHARE ANALYSIS ILLUSTRATION
FIGURE 7 CAGR PROJECTIONS: SUPPLY-SIDE ANALYSIS
FIGURE 8 CAGR PROJECTIONS FROM THE ANALYSIS OF DRIVERS, RESTRAINTS, OPPORTUNITIES, AND CHALLENGES OF THE ANIMAL GENETICS MARKET (2021–2026)
2.3 MARKET BREAKDOWN & DATA TRIANGULATION
FIGURE 9 MARKET DATA TRIANGULATION METHODOLOGY
2.4 MARKET SHARE ANALYSIS
2.5 ASSUMPTIONS FOR THE STUDY
2.6 RISK ASSESSMENT/LIMITATIONS
2.7 COVID-19 HEALTH ASSESSMENT
2.8 ASSESSMENT OF THE IMPACT OF COVID-19 ON THE ECONOMIC SCENARIO
3 EXECUTIVE SUMMARY (Page No. - 50)
FIGURE 12 ANIMAL GENETICS MARKET, BY TYPE, 2021 VS. 2026 (USD MILLION)
FIGURE 13 LIVE ANIMALS MARKET, BY TYPE, 2021 VS. 2026 (USD MILLION)
FIGURE 14 ANIMAL GENETIC TESTING SERVICES MARKET, BY TYPE, 2021 VS. 2026 (USD MILLION)
FIGURE 15 GEOGRAPHIC SNAPSHOT OF THE MARKET, 2020
4 PREMIUM INSIGHTS (Page No. - 53)
4.1 GROWTH POTENTIAL OF THE ANIMAL GENETICS MARKET
FIGURE 16 RISING CONSUMPTION OF ANIMAL-DERIVED PROTEIN—A KEY FACTOR DRIVING MARKET GROWTH
4.2 ASIA PACIFIC MARKET
FIGURE 17 LIVE ANIMALS ACCOUNTED FOR THE LARGEST SHARE OF THE ASIA PACIFIC MARKET IN 2020
4.3 ANIMAL GENETICS MARKET: GEOGRAPHIC GROWTH OPPORTUNITIES
FIGURE 18 THE MARKET IN CHINA IS EXPECTED TO GROW AT THE HIGHEST CAGR DURING THE FORECAST PERIOD
4.4 REGIONAL MIX: MARKET (2019–2026)
FIGURE 19 EUROPE TO DOMINATE THE ANIMAL GENETICS MARKET DURING THE FORECAST PERIOD
5 ANIMAL GENETICS MARKET OVERVIEW (Page No. - 57)
5.1 INTRODUCTION
5.2 MARKET DYNAMICS
5.2.1 MARKET DRIVERS
5.2.1.1 Increasing consumption of animal-derived protein and dairy products
TABLE 2 MILK POWDER PRODUCTION: PAST AND PROJECTED TRENDS IN DEVELOPING AND DEVELOPED COUNTRIES
TABLE 3 PER CAPITA CONSUMPTION OF MEAT: PAST AND PROJECTED TRENDS IN DEVELOPING AND DEVELOPED COUNTRIES
5.2.1.2 Growing global population and rapid urbanization
TABLE 4 GLOBAL URBAN POPULATION GROWTH (2010–2050)
5.2.1.3 Increasing customer awareness
5.2.1.4 Increased demand for companion animals
5.2.1.5 Genetic services to prevent genetic diseases and business loss
5.2.1.6 Increased adoption of advanced genetic technologies
5.2.2 MARKET RESTRAINTS
5.2.2.1 The emergence of alternative such as lab-based meat
5.2.3 OPPORTUNITIES
5.2.3.1 Untapped market potential in developing countries
5.2.3.2 Innovations in phenotyping services
5.2.3.3 Significant investments in R&D and expansions by key players
5.2.4 CHALLENGES
5.2.4.1 Need for specific breeding programs for breeds with inferior economic performance
5.2.4.2 Economic sustainability in local breeds
5.2.4.3 African swine fever outbreak in China and further spread
5.2.4.4 Shortage of skilled professionals in veterinary research
6 INDUSTRY INSIGHTS (Page No. - 67)
6.1 INTRODUCTION
6.2 INDUSTRY TRENDS
6.2.1 INCREASING R&D INVESTMENTS AND GOVERNMENT FUNDING
6.2.2 RISING RESEARCH COLLABORATION AND PARTNERSHIPS
6.2.3 CHANGING DYNAMICS IN THE CHINESE PORCINE MARKET
6.2.4 USE OF ARTIFICIAL INTELLIGENCE IN ANIMAL BREEDING AND TESTING
6.2.5 INTRODUCTION OF GENETICALLY MODIFIED DISEASE-RESISTANT ANIMALS
6.3 STRATEGIC BENCHMARKING
6.3.1 INCREASING NUMBER OF AGREEMENTS, COLLABORATIONS, PARTNERSHIPS, AND ACQUISITIONS
6.4 SPECIES PRIORITIES AND BREEDING OBJECTIVES, BY REGION
TABLE 5 FOCUS OF BREEDING PROGRAMS FOR MAJOR LIVESTOCK SPECIES, BY REGION
TABLE 6 PRESENCE/IMPLEMENTATION OF BREEDING PROGRAMS FOR MAJOR LIVESTOCK SPECIES, BY REGION
6.5 UTILIZATION OF GENETIC TECHNOLOGIES, BY REGION
TABLE 7 INTENSITY OF UTILIZATION OF VARIOUS GENETIC TECHNOLOGIES, BY REGION
6.6 PRICING ANALYSIS
6.7 ANIMAL GENETICS MARKET VENDORS: MAJOR CUSTOMERS
6.8 IMPACT OF COVID-19 ON THE ANIMAL GENETICS MARKET
6.9 PORTER’S FIVE FORCES ANALYSIS
TABLE 8 PORTER’S FIVE FORCES ANALYSIS
6.9.1 THREAT OF NEW ENTRANTS
6.9.2 THREAT OF SUBSTITUTES
6.9.3 BARGAINING POWER OF SUPPLIERS
6.9.4 BARGAINING POWER OF BUYERS
6.9.5 INTENSITY OF COMPETITIVE RIVALRY
6.10 VALUE CHAIN ANALYSIS
6.11 ECOSYSTEM ANALYSIS
6.11.1 ECOSYSTEM ANALYSIS FOR THE ANIMAL GENETICS MARKET
6.12 PATENT ANALYSIS
6.12.1 PATENT PUBLICATION TRENDS FOR THE ANIMAL GENETICS MARKET
FIGURE 22 PATENT PUBLICATION TRENDS FOR ANIMAL GENETICS, 2015–2021
6.12.2 TOP APPLICANTS (COMPANIES/INSTITUTIONS) FOR ANIMAL GENETICS
FIGURE 23 TOP APPLICANTS (COMPANIES/INSTITUTIONS) FOR ANIMAL GENETICS PATENTS (2015–2021)
6.12.3 TOP INVENTORS FOR ANIMAL GENETICS
6.12.4 JURISDICTION ANALYSIS: TOP APPLICANTS (COUNTRIES) FOR ANIMAL GENETICS PATENTS
6.12.5 TRADE ANALYSIS
TABLE 9 IMPORT OF LIVE BOVINES, BY REGION, 2016–2020 (USD BILLION)
TABLE 10 IMPORT OF LIVE SWINE, BY REGION, 2016–2020 (USD MILLION)
TABLE 11 IMPORT OF LIVE SHEEP AND GOATS, BY REGION, 2016–2020 (USD MILLION)
TABLE 12 IMPORT OF LIVE POULTRY, BY REGION, 2016–2020 (USD MILLION)
TABLE 13 IMPORT OF LIVE HORSES, ASSES, MULES, AND HINNIES, BY REGION, 2016–2020 (USD MILLION)
TABLE 14 EXPORT OF LIVE BOVINES, BY REGION, 2016–2020 (USD MILLION)
TABLE 15 EXPORT OF LIVE SWINE, BY REGION, 2016–2020 (USD MILLION)
TABLE 16 EXPORT OF LIVE SHEEP AND GOATS, BY REGION, 2016–2020 (USD MILLION)
TABLE 17 EXPORT OF LIVE POULTRY, BY REGION, 2016–2020 (USD MILLION)
TABLE 18 EXPORT OF LIVE HORSES, ASSES, MULES, AND HINNIES, BY REGION, 2016–2020 (USD MILLION)
7 ANIMAL GENETICS MARKET, BY PRODUCT & SERVICE (Page No. - 84)
7.1 INTRODUCTION
TABLE 19 MARKET, BY PRODUCT & SERVICE, 2019–2026 (USD MILLION)
7.2 ANIMAL GENETIC PRODUCTS
TABLE 20 ANIMAL GENETIC PRODUCTS MARKET, BY TYPE, 2019–2026 (USD MILLION)
TABLE 21 ANIMAL GENETIC PRODUCTS MARKET, BY COUNTRY, 2019–2026 (USD MILLION)
7.2.1 LIVE ANIMALS
TABLE 22 LIVE ANIMALS MARKET, BY TYPE, 2019–2026 (USD MILLION)
TABLE 23 LIVE ANIMALS MARKET, BY COUNTRY, 2019–2026 (USD MILLION)
7.2.1.1 Poultry
7.2.1.1.1 Increasing consumption of poultry meat across the globe is driving the growth of this segment
TABLE 24 KEY PLAYERS IN THE LIVE POULTRY MARKET
TABLE 25 LIVE POULTRY MARKET, BY COUNTRY, 2019–2026 (USD MILLION)
7.2.1.2 Porcine
7.2.1.2.1 Growth in pork production and consumption to impact the global demand for live porcine
TABLE 26 KEY PLAYERS IN THE LIVE PORCINE MARKET
TABLE 27 LIVE PORCINE MARKET, BY COUNTRY, 2019–2026 (USD MILLION)
7.2.1.3 Bovine
7.2.1.3.1 Preference for poultry meat over red meat and the growing trend of veganism are hampering the market growth
TABLE 28 KEY PLAYERS IN THE LIVE BOVINE MARKET
TABLE 29 LIVE BOVINE MARKET, BY COUNTRY, 2019–2026 (USD MILLION)
7.2.1.4 Canine
7.2.1.4.1 The growing adoption of dogs in developing countries offers significant growth opportunities for players in this market
TABLE 30 LIVE CANINE MARKET, BY COUNTRY, 2019–2026 (USD MILLION)
7.2.1.5 Other live animals
TABLE 31 OTHER LIVE ANIMALS MARKET, BY COUNTRY, 2019–2026 (USD MILLION)
7.2.2 GENETIC MATERIALS
TABLE 32 GENETIC MATERIALS MARKET, BY TYPE, 2019–2026 (USD MILLION)
TABLE 33 GENETIC MATERIALS MARKET, BY COUNTRY, 2019–2026 (USD MILLION)
7.2.2.1 Semen
TABLE 34 SEMEN MARKET, BY TYPE, 2019–2026 (USD MILLION)
TABLE 35 SEMEN MARKET, BY COUNTRY, 2019–2026 (USD MILLION)
7.2.2.1.1 Bovine semen
7.2.2.1.1.1 Bovine semen to register the highest growth rate during the study period
TABLE 36 CONVENTIONAL SEMEN VS. SEXED SEMEN: EVALUATION CRITERIA
TABLE 37 KEY PLAYERS OFFERING BOVINE SEMEN
TABLE 38 BOVINE SEMEN MARKET, BY COUNTRY, 2019–2026 (USD MILLION)
7.2.2.1.2 Porcine semen
7.2.2.1.2.1 The use of artificial insemination in the global swine industry has grown significantly
TABLE 39 KEY PLAYERS OFFERING PORCINE SEMEN
TABLE 40 PORCINE SEMEN MARKET, BY COUNTRY, 2019–2026 (USD MILLION)
7.2.2.1.3 Equine semen
7.2.2.1.3.1 Stringent regulations for the control of diseases are posing a challenge for equine industry breeders
TABLE 41 EQUINE SEMEN MARKET, BY COUNTRY, 2019–2026 (USD MILLION)
7.2.2.1.4 Canine semen
7.2.2.1.4.1 The increasing adoption of dogs as companion animals is driving the growth of the canine semen market
TABLE 42 CANINE SEMEN MARKET, BY COUNTRY, 2019–2026 (USD MILLION)
7.2.2.1.5 Other animal semen
TABLE 43 OTHER ANIMAL SEMEN MARKET, BY COUNTRY, 2019–2026 (USD MILLION)
7.2.2.2 Embryos
TABLE 44 EMBRYOS MARKET, BY TYPE, 2019–2026 (USD MILLION)
TABLE 45 EMBRYOS MARKET, BY COUNTRY, 2019–2026 (USD MILLION)
7.2.2.2.1 Bovine embryos
7.2.2.2.1.1 Embryo transfer has gained considerable popularity among seed stock and beef producers
TABLE 46 BOVINE EMBRYOS MARKET, BY COUNTRY, 2019–2026 (USD MILLION)
7.2.2.2.2 Equine embryos
7.2.2.2.2.1 Argentina, Brazil, and the US are leaders in embryo transfer technology
TABLE 47 EQUINE EMBRYOS MARKET, BY COUNTRY, 2019–2026 (USD MILLION)
7.2.2.2.3 Other animal embryos
TABLE 48 OTHER ANIMAL EMBRYOS MARKET, BY COUNTRY, 2019–2026 (USD MILLION)
7.3 ANIMAL GENETIC TESTING SERVICES
TABLE 49 ANIMAL GENETIC TESTING SERVICES MARKET, BY TYPE, 2019–2026 (USD MILLION)
TABLE 50 ANIMAL GENETIC TESTING SERVICES MARKET, BY COUNTRY, 2019–2026 (USD MILLION)
7.3.1 GENETIC DISEASE TESTS
7.3.1.1 Genetic disease tests to witness the highest growth in the animal genetic testing services market
TABLE 51 KEY GENETIC DISEASE TESTING SERVICES OFFERED IN THE MARKET
TABLE 52 GENETIC DISEASE TESTS MARKET, BY COUNTRY, 2019–2026 (USD MILLION)
7.3.2 GENETIC TRAIT TESTS
TABLE 53 KEY GENETIC TRAIT TESTING SERVICES OFFERED IN THE MARKET
TABLE 54 GENETIC TRAIT TESTS MARKET, BY TYPE, 2019–2026 (USD MILLION)
TABLE 55 GENETIC TRAIT TESTS MARKET, BY COUNTRY, 2019–2026 (USD MILLION)
7.3.2.1 Bovine
7.3.2.1.1 Breeders are focusing on ensuring high-productivity traits in their herds
TABLE 56 BOVINE GENETIC TRAIT TESTS MARKET, BY COUNTRY, 2019–2026 (USD MILLION)
7.3.2.2 Other animal genetic trait tests
TABLE 57 OTHER ANIMAL GENETIC TRAIT TESTS MARKET, BY COUNTRY, 2019–2026 (USD MILLION)
7.3.3 DNA TYPING
7.3.3.1 DNA typing is used in parentage identification, animal registration, and gender-associated disease identification
TABLE 58 KEY DNA TYPING SERVICES OFFERED IN THE MARKET
TABLE 59 DNA TYPING MARKET, BY COUNTRY, 2019–2026 (USD MILLION)
7.3.4 OTHER SERVICES
TABLE 60 OTHER ANIMAL GENETIC TESTING SERVICES MARKET, BY COUNTRY, 2019–2026 (USD MILLION)
8 ANIMAL GENETICS MARKET, BY REGION (Page No. - 118)
8.1 INTRODUCTION
TABLE 61 MARKET, BY REGION, 2019–2026 (USD MILLION)
8.2 EUROPE
FIGURE 26 EUROPE: MARKET SNAPSHOT
TABLE 62 EUROPE: MARKET, BY COUNTRY, 2019–2026 (USD MILLION)
TABLE 63 EUROPE: MARKET, BY PRODUCT & SERVICE, 2019–2026 (USD MILLION)
TABLE 64 EUROPE: MARKET, BY TYPE, 2019–2026 (USD MILLION)
TABLE 65 EUROPE: LIVE ANIMALS MARKET, BY TYPE, 2019–2026 (USD MILLION)
TABLE 66 EUROPE: GENETIC MATERIALS MARKET, BY TYPE, 2019–2026 (USD MILLION)
TABLE 67 EUROPE: SEMEN MARKET, BY TYPE, 2019–2026 (USD MILLION)
TABLE 68 EUROPE: EMBRYOS MARKET, BY TYPE, 2019–2026 (USD MILLION)
TABLE 69 EUROPE: ANIMAL GENETIC TESTING SERVICES MARKET, BY TYPE, 2019–2026 (USD MILLION)
8.2.1 FRANCE
8.2.1.1 Growing domestic demand for livestock and poultry products to propel market growth
TABLE 70 COMPANION & FOOD-PRODUCING ANIMAL POPULATION IN FRANCE (MILLION)
TABLE 71 FRANCE: MACROECONOMIC INDICATORS
TABLE 72 FRANCE: MARKET, BY PRODUCT & SERVICE, 2019–2026 (USD MILLION)
TABLE 73 FRANCE: ANIMAL GENETIC PRODUCTS MARKET, BY TYPE, 2019–2026 (USD MILLION)
TABLE 74 FRANCE: LIVE ANIMALS MARKET, BY TYPE, 2019–2026 (USD MILLION)
TABLE 75 FRANCE: GENETIC MATERIALS MARKET, BY TYPE, 2019–2026 (USD MILLION)
TABLE 76 FRANCE: SEMEN MARKET, BY TYPE, 2019–2026 (USD MILLION)
TABLE 77 FRANCE: EMBRYOS MARKET, BY TYPE, 2019–2026 (USD MILLION)
TABLE 78 FRANCE: ANIMAL GENETIC TESTING SERVICES MARKET, BY TYPE, 2019–2026 (USD MILLION)
8.2.2 GERMANY
8.2.2.1 The growing demand for poultry genetics drives the animal genetics market in Germany
TABLE 79 COMPANION & FOOD-PRODUCING ANIMAL POPULATION IN GERMANY (MILLION)
TABLE 80 GERMANY: MACROECONOMIC INDICATORS
TABLE 81 GERMANY: MARKET, BY PRODUCT & SERVICE, 2019–2026 (USD MILLION)
TABLE 82 GERMANY: MARKET, BY TYPE, 2019–2026 (USD MILLION)
TABLE 83 GERMANY: LIVE ANIMALS MARKET, BY TYPE, 2019–2026 (USD MILLION)
TABLE 84 GERMANY: GENETIC MATERIALS MARKET, BY TYPE, 2019–2026 (USD MILLION)
TABLE 85 GERMANY: SEMEN MARKET, BY TYPE, 2019–2026 (USD MILLION)
TABLE 86 GERMANY: EMBRYOS MARKET, BY TYPE, 2019–2026 (USD MILLION)
TABLE 87 GERMANY: ANIMAL GENETIC TESTING SERVICES MARKET, BY TYPE, 2019–2026 (USD MILLION)
8.2.3 UK
8.2.3.1 Government initiatives to improve the economic importance of some animal breeds to drive the animal genetics market in the country
TABLE 88 COMPANION & FOOD-PRODUCING ANIMAL POPULATION IN THE UK (MILLION)
TABLE 89 UK: MACROECONOMIC INDICATORS
TABLE 90 UK: MARKET, BY PRODUCT & SERVICE, 2019–2026 (USD MILLION)
TABLE 91 UK: MARKET, BY TYPE, 2019–2026 (USD MILLION)
TABLE 92 UK: LIVE ANIMALS MARKET, BY TYPE, 2019–2026 (USD MILLION)
TABLE 93 UK: GENETIC MATERIALS MARKET, BY TYPE, 2019–2026 (USD MILLION)
TABLE 94 UK: SEMEN MARKET, BY TYPE, 2019–2026 (USD MILLION)
TABLE 95 UK: EMBRYOS MARKET, BY TYPE, 2019–2026 (USD MILLION)
TABLE 96 UK: ANIMAL GENETIC TESTING SERVICES MARKET, BY TYPE, 2019–2026 (USD MILLION)
8.2.4 SPAIN
8.2.4.1 Domestic consumption of pork and poultry products is significantly high in Spain
TABLE 97 COMPANION & FOOD-PRODUCING ANIMAL POPULATION IN SPAIN (MILLION)
TABLE 98 SPAIN: MACROECONOMIC INDICATORS
TABLE 99 SPAIN: MARKET, BY PRODUCT & SERVICE, 2019–2026 (USD MILLION)
TABLE 100 SPAIN: ANIMAL GENETIC PRODUCTS MARKET, BY TYPE, 2019–2026 (USD MILLION)
TABLE 101 SPAIN: LIVE ANIMALS MARKET, BY TYPE, 2019–2026 (USD MILLION)
TABLE 102 SPAIN: GENETIC MATERIALS MARKET, BY TYPE, 2019–2026 (USD MILLION)
TABLE 103 SPAIN: SEMEN MARKET, BY TYPE, 2019–2026 (USD MILLION)
TABLE 104 SPAIN: EMBRYOS MARKET, BY TYPE, 2019–2026 (USD MILLION)
TABLE 105 SPAIN: ANIMAL GENETIC TESTING SERVICES MARKET, BY TYPE, 2019–2026 (USD MILLION)
8.2.5 ITALY
8.2.5.1 Growth in the Italian animal genetics market is driven by the government focus on preserving local breeds
TABLE 106 COMPANION & FOOD-PRODUCING ANIMAL POPULATION IN ITALY (MILLION)
TABLE 107 ITALY: MACROECONOMIC INDICATORS
TABLE 108 ITALY: MARKET, BY PRODUCT & SERVICE, 2019–2026 (USD MILLION)
TABLE 109 ITALY: ANIMAL GENETIC PRODUCTS MARKET, BY TYPE, 2019–2026 (USD MILLION)
TABLE 110 ITALY: LIVE ANIMALS MARKET, BY TYPE, 2019–2026 (USD MILLION)
TABLE 111 ITALY: GENETIC MATERIALS MARKET, BY TYPE, 2019–2026 (USD MILLION)
TABLE 112 ITALY: SEMEN MARKET, BY TYPE, 2019–2026 (USD MILLION)
TABLE 113 ITALY: EMBRYOS MARKET, BY TYPE, 2019–2026 (USD MILLION)
TABLE 114 ITALY: ANIMAL GENETIC TESTING SERVICES MARKET, BY TYPE, 2019–2026 (USD MILLION)
8.2.6 NETHERLANDS
8.2.6.1 The presence of several key players to drive market growth
TABLE 115 COMPANION AND FOOD-PRODUCING ANIMAL POPULATION IN THE NETHERLANDS (MILLION)
TABLE 116 NETHERLANDS: MACROECONOMIC INDICATORS
TABLE 117 NETHERLANDS: MARKET, BY PRODUCT & SERVICE, 2019–2026 (USD MILLION)
TABLE 118 NETHERLANDS: MARKET, BY TYPE, 2019–2026 (USD MILLION)
TABLE 119 NETHERLANDS: LIVE ANIMALS MARKET, BY TYPE, 2019–2026 (USD MILLION)
TABLE 120 NETHERLANDS: GENETIC MATERIALS MARKET, BY TYPE, 2019–2026 (USD MILLION)
TABLE 121 NETHERLANDS: SEMEN MARKET, BY TYPE, 2019–2026 (USD MILLION)
TABLE 122 NETHERLANDS: EMBRYOS MARKET, BY TYPE, 2019–2026 (USD MILLION)
TABLE 123 NETHERLANDS: ANIMAL GENETIC TESTING SERVICES MARKET, BY TYPE, 2019–2026 (USD MILLION)
8.2.7 REST OF EUROPE
TABLE 124 ROE: MARKET, BY PRODUCT & SERVICE, 2019–2026 (USD MILLION)
TABLE 125 ROE: ANIMAL GENETIC PRODUCTS MARKET, BY TYPE, 2019–2026 (USD MILLION)
TABLE 126 ROE: LIVE ANIMALS MARKET, BY TYPE, 2019–2026 (USD MILLION)
TABLE 127 ROE: GENETIC MATERIALS MARKET, BY TYPE, 2019–2026 (USD MILLION)
TABLE 128 ROE: SEMEN MARKET, BY TYPE, 2019–2026 (USD MILLION)
TABLE 129 ROE: EMBRYOS MARKET, BY TYPE, 2019–2026 (USD MILLION)
TABLE 130 ROE: ANIMAL GENETIC TESTING SERVICES MARKET, BY TYPE, 2019–2026 (USD MILLION)
8.3 NORTH AMERICA
TABLE 131 NORTH AMERICA: MARKET, BY COUNTRY, 2019–2026 (USD MILLION)
TABLE 132 NORTH AMERICA: MARKET, BY PRODUCT & SERVICE, 2019–2026 (USD MILLION)
TABLE 133 NORTH AMERICA: ANIMAL GENETIC PRODUCTS MARKET, BY TYPE, 2019–2026 (USD MILLION)
TABLE 134 NORTH AMERICA: LIVE ANIMALS MARKET, BY TYPE, 2019–2026 (USD MILLION)
TABLE 135 NORTH AMERICA: GENETIC MATERIALS MARKET, BY TYPE, 2019–2026 (USD MILLION)
TABLE 136 NORTH AMERICA: SEMEN MARKET, BY TYPE, 2019–2026 (USD MILLION)
TABLE 137 NORTH AMERICA: EMBRYOS MARKET, BY TYPE, 2019–2026 (USD MILLION)
TABLE 138 NORTH AMERICA: ANIMAL GENETIC TESTING SERVICES MARKET, BY TYPE, 2019–2026 (USD MILLION)
8.3.1 US
8.3.1.1 The adoption of advanced genetic testing methods is a key factor driving market growth in the US
TABLE 139 COMPANION AND FOOD-PRODUCING ANIMAL POPULATION IN THE US (MILLION)
TABLE 140 US: MACROECONOMIC INDICATORS
TABLE 141 US: MARKET, BY PRODUCT & SERVICE, 2019–2026 (USD MILLION)
TABLE 142 US: ANIMAL GENETIC PRODUCTS MARKET, BY TYPE, 2019–2026 (USD MILLION)
TABLE 143 US: LIVE ANIMALS MARKET, BY TYPE, 2019–2026 (USD MILLION)
TABLE 144 US: GENETIC MATERIALS MARKET, BY TYPE, 2019–2026 (USD MILLION)
TABLE 145 US: SEMEN MARKET, BY TYPE, 2019–2026 (USD MILLION)
TABLE 146 US: EMBRYOS MARKET, BY TYPE, 2019–2026 (USD MILLION)
TABLE 147 US: ANIMAL GENETIC TESTING SERVICES MARKET, BY TYPE, 2019–2026 (USD MILLION)
8.3.2 CANADA
8.3.2.1 Growing demand for genetic material in Canada to boost the animal genetics market
TABLE 148 COMPANION AND FOOD-PRODUCING ANIMAL POPULATION IN CANADA (MILLION)
TABLE 149 CANADA: MACROECONOMIC INDICATORS
TABLE 150 CANADA: MARKET, BY PRODUCT & SERVICE, 2019–2026 (USD MILLION)
TABLE 151 CANADA: MARKET, BY TYPE, 2019–2026 (USD MILLION)
TABLE 152 CANADA: LIVE ANIMALS MARKET, BY TYPE, 2019–2026 (USD MILLION)
TABLE 153 CANADA: GENETIC MATERIALS MARKET, BY TYPE, 2019–2026 (USD MILLION)
TABLE 154 CANADA: SEMEN MARKET, BY TYPE, 2019–2026 (USD MILLION)
TABLE 155 CANADA: EMBRYOS MARKET, BY TYPE, 2019–2026 (USD MILLION)
TABLE 156 CANADA: ANIMAL GENETIC TESTING SERVICES MARKET, BY TYPE, 2019–2026 (USD MILLION)
8.4 ASIA PACIFIC
FIGURE 27 ASIA PACIFIC: MARKET SNAPSHOT
TABLE 157 APAC: MARKET, BY COUNTRY, 2019–2026 (USD MILLION)
TABLE 158 APAC: MARKET, BY PRODUCT & SERVICE, 2019–2026 (USD MILLION)
TABLE 159 APAC: ANIMAL GENETIC PRODUCTS MARKET, BY TYPE, 2019–2026 (USD MILLION)
TABLE 160 APAC: LIVE ANIMALS MARKET, BY TYPE, 2019–2026 (USD MILLION)
TABLE 161 APAC: GENETIC MATERIALS MARKET, BY TYPE, 2019–2026 (USD MILLION)
TABLE 162 APAC: SEMEN MARKET, BY TYPE, 2019–2026 (USD MILLION)
TABLE 163 APAC: EMBRYOS MARKET, BY TYPE, 2019–2026 (USD MILLION)
TABLE 164 APAC: ANIMAL GENETIC TESTING SERVICES MARKET, BY TYPE, 2019–2026 (USD MILLION)
8.4.1 CHINA
8.4.1.1 Exponential growth in population and demand for meat and dairy products to boost the Chinese animal genetics market
TABLE 165 COMPANION AND FOOD-PRODUCING ANIMAL POPULATION IN CHINA (MILLION)
TABLE 166 CHINA: MACROECONOMIC INDICATORS
TABLE 167 CHINA: MARKET, BY PRODUCT & SERVICE, 2019–2026 (USD MILLION)
TABLE 168 CHINA: ANIMAL GENETIC PRODUCTS MARKET, BY TYPE, 2019–2026 (USD MILLION)
TABLE 169 CHINA: LIVE ANIMALS MARKET, BY TYPE, 2019–2026 (USD MILLION)
TABLE 170 CHINA: GENETIC MATERIALS MARKET, BY TYPE, 2019–2026 (USD MILLION)
TABLE 171 CHINA: SEMEN MARKET, BY TYPE, 2019–2026 (USD MILLION)
TABLE 172 CHINA: EMBRYOS MARKET, BY TYPE, 2019–2026 (USD MILLION)
TABLE 173 CHINA: ANIMAL GENETIC TESTING SERVICES MARKET, BY TYPE, 2019–2026 (USD MILLION)
8.4.2 INDIA
8.4.2.1 Large-scale production of live bovines to drive the Indian animal genetics market
TABLE 174 COMPANION AND FOOD-PRODUCING ANIMAL POPULATION IN INDIA (MILLION)
TABLE 175 INDIA: MACROECONOMIC INDICATORS
TABLE 176 INDIA: MARKET, BY PRODUCT & SERVICE, 2019–2026 (USD MILLION)
TABLE 177 INDIA: MARKET, BY TYPE, 2019–2026 (USD MILLION)
TABLE 178 INDIA: LIVE ANIMALS MARKET, BY TYPE, 2019–2026 (USD MILLION)
TABLE 179 INDIA: GENETIC MATERIALS MARKET, BY TYPE, 2019–2026 (USD MILLION)
TABLE 180 INDIA: SEMEN MARKET, BY TYPE, 2019–2026 (USD MILLION)
TABLE 181 INDIA: EMBRYOS MARKET, BY TYPE, 2019–2026 (USD MILLION)
TABLE 182 INDIA: ANIMAL GENETIC TESTING SERVICES MARKET, BY TYPE, 2019–2026 (USD MILLION)
8.4.3 JAPAN
8.4.3.1 Increased production and consumption of livestock products is driving the growth of the animal genetics market in Japan
TABLE 183 COMPANION AND FOOD-PRODUCING ANIMAL POPULATION IN JAPAN (MILLION)
TABLE 184 JAPAN: MACROECONOMIC INDICATORS
TABLE 185 JAPAN: MARKET, BY PRODUCT & SERVICE, 2019–2026 (USD MILLION)
TABLE 186 JAPAN: ANIMAL GENETIC PRODUCTS MARKET, BY TYPE, 2019–2026 (USD MILLION)
TABLE 187 JAPAN: LIVE ANIMALS MARKET, BY TYPE, 2019–2026 (USD MILLION)
TABLE 188 JAPAN: GENETIC MATERIALS MARKET, BY TYPE, 2019–2026 (USD MILLION)
TABLE 189 JAPAN: SEMEN MARKET, BY TYPE, 2019–2026 (USD MILLION)
TABLE 190 JAPAN: EMBRYOS MARKET, BY TYPE, 2019–2026 (USD MILLION)
TABLE 191 JAPAN: ANIMAL GENETIC TESTING SERVICES MARKET, BY TYPE, 2019–2026 (USD MILLION)
8.4.4 REST OF ASIA PACIFIC
TABLE 192 ROAPAC: MARKET, BY PRODUCT & SERVICE, 2019–2026 (USD MILLION)
TABLE 193 ROAPAC: ANIMAL GENETIC PRODUCTS MARKET, BY TYPE, 2019–2026 (USD MILLION)
TABLE 194 ROAPAC: LIVE ANIMALS MARKET, BY TYPE, 2019–2026 (USD MILLION)
TABLE 195 ROAPAC: GENETIC MATERIALS MARKET, BY TYPE, 2019–2026 (USD MILLION)
TABLE 196 ROAPAC: SEMEN MARKET, BY TYPE, 2019–2026 (USD MILLION)
TABLE 197 ROAPAC: EMBRYOS MARKET, BY TYPE, 2019–2026 (USD MILLION)
TABLE 198 ROAPAC: ANIMAL GENETIC TESTING SERVICES MARKET, BY TYPE, 2019–2026 (USD MILLION)
8.5 LATIN AMERICA
TABLE 199 LATIN AMERICA: MARKET, BY COUNTRY, 2019–2026 (USD MILLION)
TABLE 200 LATIN AMERICA: MARKET, BY PRODUCT & SERVICE, 2019–2026 (USD MILLION)
TABLE 201 LATIN AMERICA: MARKET, BY TYPE, 2019–2026 (USD MILLION)
TABLE 202 LATIN AMERICA: LIVE ANIMALS MARKET, BY TYPE, 2019–2026 (USD MILLION)
TABLE 203 LATIN AMERICA: GENETIC MATERIALS MARKET, BY TYPE, 2019–2026 (USD MILLION)
TABLE 204 LATIN AMERICA: SEMEN MARKET, BY TYPE, 2019–2026 (USD MILLION)
TABLE 205 LATIN AMERICA: EMBRYOS MARKET, BY TYPE, 2019–2026 (USD MILLION)
TABLE 206 LATIN AMERICA: ANIMAL GENETIC TESTING SERVICES MARKET, BY TYPE, 2019–2026 (USD MILLION)
8.5.1 BRAZIL
8.5.1.1 Brazil dominates the Latin American animal genetics market owing to its well-developed livestock industry
TABLE 207 COMPANION AND FOOD-PRODUCING ANIMAL POPULATION IN BRAZIL (MILLION)
TABLE 208 BRAZIL: MACROECONOMIC INDICATORS
TABLE 209 BRAZIL: MARKET, BY PRODUCT & SERVICE, 2019–2026 (USD MILLION)
TABLE 210 BRAZIL: ANIMAL GENETIC PRODUCTS MARKET, BY TYPE, 2019–2026 (USD MILLION)
TABLE 211 BRAZIL: LIVE ANIMALS MARKET, BY TYPE, 2019–2026 (USD MILLION)
TABLE 212 BRAZIL: GENETIC MATERIALS MARKET, BY TYPE, 2019–2026 (USD MILLION)
TABLE 213 BRAZIL: SEMEN MARKET, BY TYPE, 2019–2026 (USD MILLION)
TABLE 214 BRAZIL: EMBRYOS MARKET, BY TYPE, 2019–2026 (USD MILLION)
TABLE 215 BRAZIL: ANIMAL GENETIC TESTING SERVICES MARKET, BY TYPE, 2019–2026 (USD MILLION)
8.5.2 MEXICO
8.5.2.1 High demand for animal meat will drive market growth in Mexico
TABLE 216 COMPANION AND FOOD-PRODUCING ANIMAL POPULATION IN MEXICO (MILLION)
TABLE 217 MEXICO: MACROECONOMIC INDICATORS
TABLE 218 MEXICO: MARKET, BY PRODUCT & SERVICE, 2019–2026 (USD MILLION)
TABLE 219 MEXICO: ANIMAL GENETIC PRODUCTS MARKET, BY TYPE, 2019–2026 (USD MILLION)
TABLE 220 MEXICO: LIVE ANIMALS MARKET, BY TYPE, 2019–2026 (USD MILLION)
TABLE 221 MEXICO: GENETIC MATERIALS MARKET, BY TYPE, 2019–2026 (USD MILLION)
TABLE 222 MEXICO: SEMEN MARKET, BY TYPE, 2019–2026 (USD MILLION)
TABLE 223 MEXICO: EMBRYOS MARKET, BY TYPE, 2019–2026 (USD MILLION)
TABLE 224 MEXICO: ANIMAL GENETIC TESTING SERVICES MARKET, BY TYPE, 2019–2026 (USD MILLION)
8.5.3 REST OF LATIN AMERICA
TABLE 225 ROLA: MARKET, BY PRODUCT & SERVICE, 2019–2026 (USD MILLION)
TABLE 226 ROLA: MARKET, BY TYPE, 2019–2026 (USD MILLION)
TABLE 227 ROLA: LIVE ANIMALS MARKET, BY TYPE, 2019–2026 (USD MILLION)
TABLE 228 ROLA: GENETIC MATERIALS MARKET, BY TYPE, 2019–2026 (USD MILLION)
TABLE 229 ROLA: SEMEN MARKET, BY TYPE, 2019–2026 (USD MILLION)
TABLE 230 ROLA: EMBRYOS MARKET, BY TYPE, 2019–2026 (USD MILLION)
TABLE 231 ROLA: ANIMAL GENETIC TESTING SERVICES MARKET, BY TYPE, 2019–2026 (USD MILLION)
8.6 MIDDLE EAST & AFRICA
8.6.1 GROWING URBANIZATION AND SHIFTING DIETARY HABITS ARE THE KEY TRENDS IN THE MIDDLE EAST AND AFRICA
TABLE 232 COMPANION AND FOOD-PRODUCING ANIMAL POPULATION IN AFRICA (MILLION)
TABLE 233 MIDDLE EAST & AFRICA: MARKET, BY PRODUCT & SERVICE, 2019–2026 (USD MILLION)
TABLE 234 MIDDLE EAST & AFRICA: ANIMAL GENETIC PRODUCTS MARKET, BY TYPE, 2019–2026 (USD MILLION)
TABLE 235 MIDDLE EAST & AFRICA: LIVE ANIMALS MARKET, BY TYPE, 2019–2026 (USD MILLION)
TABLE 236 MIDDLE EAST & AFRICA: GENETIC MATERIALS MARKET, BY TYPE, 2019–2026 (USD MILLION)
TABLE 237 MIDDLE EAST & AFRICA: SEMEN MARKET, BY TYPE, 2019–2026 (USD MILLION)
TABLE 238 MIDDLE EAST & AFRICA: EMBRYOS MARKET, BY TYPE, 2019–2026 (USD MILLION)
TABLE 239 MIDDLE EAST & AFRICA: ANIMAL GENETIC TESTING SERVICES MARKET, BY TYPE, 2019–2026 (USD MILLION)
9 COMPETITIVE LANDSCAPE (Page No. - 185)
9.1 INTRODUCTION
9.2 FOOTPRINT ANALYSIS OF THE TOP PLAYERS IN THE ANIMAL GENETICS MARKET
TABLE 240 MARKET: COMPANY FOOTPRINT ANALYSIS
TABLE 241 MARKET: COMPANY FOOTPRINT ANALYSIS, BY PRODUCT & SERVICE
TABLE 242 MARKET: COMPANY REGION FOOTPRINT ANALYSIS
9.3 PRODUCT & SERVICE PORTFOLIO MATRIX
9.4 MARKET SHARE ANALYSIS
9.4.1 ANIMAL GENETICS MARKET
9.4.2 ANIMAL GENETICS PRODUCTS MARKET, BY ANIMAL TYPE, 2020
9.4.2.1 Bovine genetics
FIGURE 28 BOVINE GENETICS MARKET SHARE ANALYSIS, BY KEY PLAYER, 2020
9.4.2.2 Porcine genetics
FIGURE 29 PORCINE GENETICS MARKET SHARE ANALYSIS, BY KEY PLAYER, 2020
9.4.2.3 Poultry
FIGURE 30 POULTRY GENETICS MARKET SHARE ANALYSIS, BY KEY PLAYER, 2020
9.4.2.4 Animal genetic testing services
FIGURE 31 ANIMAL GENETIC TESTING SERVICES MARKET SHARE ANALYSIS, BY KEY PLAYER, 2020
9.5 COMPANY EVALUATION QUADRANT
9.5.1 STARS
9.5.2 EMERGING LEADERS
9.5.3 PERVASIVE PLAYERS
9.5.4 PARTICIPANTS
FIGURE 32 MARKET: COMPANY EVALUATION QUADRANT, 2020
9.6 COMPANY EVALUATION QUADRANT FOR START-UPS/SMES
9.6.1 PROGRESSIVE COMPANIES
9.6.2 STARTING BLOCKS
9.6.3 RESPONSIVE COMPANIES
9.6.4 DYNAMIC COMPANIES
FIGURE 33 MARKET: COMPANY EVALUATION QUADRANT FOR START-UPS/SMES, 2020
9.7 COMPETITIVE SCENARIO
9.7.1 KEY DEVELOPMENTS IN THE MARKET
TABLE 243 DEALS (2018–2021)
TABLE 244 PRODUCT LAUNCHES (2018–2021)
10 COMPANY PROFILES (Page No. - 199)
10.1 KEY PLAYERS
(Business overview, Products & services offered, Recent Developments, Competitive analysis)*
10.1.1 NEOGEN CORPORATION
TABLE 245 NEOGEN CORPORATION: BUSINESS OVERVIEW
FIGURE 34 NEOGEN CORPORATION: COMPANY SNAPSHOT
10.1.2 GENUS
TABLE 246 GENUS: BUSINESS OVERVIEW
FIGURE 35 GENUS: COMPANY SNAPSHOT
10.1.3 URUS
TABLE 247 URUS GROUP: BUSINESS OVERVIEW
10.1.4 EW GROUP GMBH
TABLE 248 EW GROUP: BUSINESS OVERVIEW
10.1.5 GROUPE GRIMAUD
TABLE 249 GROUPE GRIMAUD: BUSINESS OVERVIEW
10.1.6 CRV HOLDING
TABLE 250 CRV HOLDING: BUSINESS OVERVIEW
FIGURE 36 CRV HOLDING: COMPANY SNAPSHOT
10.1.7 TOPIGS NORSVIN
TABLE 251 TOPIGS NORSVIN: BUSINESS OVERVIEW
10.1.8 ZOETIS
TABLE 252 ZOETIS: BUSINESS OVERVIEW
FIGURE 37 ZOETIS: COMPANY SNAPSHOT
10.1.9 ENVIGO
TABLE 253 ENVIGO: BUSINESS OVERVIEW
10.1.10 HENDRIX GENETICS
TABLE 254 HENDRIX GENETICS: BUSINESS OVERVIEW
10.1.11 ANIMAL GENETICS
TABLE 255 ANIMAL GENETICS: BUSINESS OVERVIEW
10.2 OTHER PLAYERS
10.2.1 VETGEN
TABLE 256 VETGEN: BUSINESS OVERVIEW
10.2.2 DANBRED
TABLE 257 DANBRED: BUSINESS OVERVIEW
10.2.3 TROPICAL BOVINE GENETICS
TABLE 258 TROPICAL BOVINE GENETICS: BUSINESS OVERVIEW
10.2.4 TRANS OVA GENETICS
TABLE 259 TRANS OVA GENETICS: BUSINESS OVERVIEW
10.2.5 INGURAN LLC DBA ST GENETICS
TABLE 260 INGURAN LLC DBA ST GENETICS: BUSINESS OVERVIEW
10.2.6 SEMEX ALLIANCE
TABLE 261 SEMEX ALLIANCE: BUSINESS OVERVIEW
10.2.7 GENETIC VETERINARY SCIENCES
TABLE 262 GENETIC VETERINARY SCIENCES: BUSINESS OVERVIEW
10.2.8 COBB-VANTRESS
TABLE 263 COBB-VANTRESS: BUSINESS OVERVIEW
10.2.9 MILK SOURCE
TABLE 264 MILK SOURCE: BUSINESS OVERVIEW
10.2.10 EUROGENE AI SERVICES
TABLE 265 EUROGENE AI SERVICES: BUSINESS OVERVIEW
10.2.11 AGRI-GENE
TABLE 266 AGRI-GENE: BUSINESS OVERVIEW
10.2.12 ACCELERATED GENETICS
TABLE 267 ACCELERATED GENETICS: BUSINESS OVERVIEW
10.2.13 VIKING GENETICS
TABLE 268 VIKING GENETICS: BUSINESS OVERVIEW
10.2.14 INDICAL BIOSCIENCE
TABLE 269 INDICAL BIOSCIENCE: BUSINESS OVERVIEW
*Details on Business overview, Products & services offered, Recent Developments, Competitive analysis might not be captured in case of unlisted companies.
11 APPENDIX (Page No. - 288)
11.1 DISCUSSION GUIDE
11.2 KNOWLEDGE STORE: MARKETSANDMARKETS’ SUBSCRIPTION PORTAL
11.3 AVAILABLE CUSTOMIZATIONS
11.4 RELATED REPORTS
11.5 AUTHOR DETAILS
This study involved the extensive use of both primary and secondary sources. The research process involved the study of various factors affecting the industry to identify segmentation types, key players, the competitive landscape, key market dynamics, and key player strategies.
Secondary Research
The secondary research process involved the widespread use of secondary sources, such as directories, databases (such as Bloomberg Businessweek, Factiva, and D&B Hoovers), white papers, annual reports, company house documents, investor presentations, and SEC filings of companies. Secondary research was used to identify and collect information useful for the extensive, technical, market-oriented, and commercial study of the animal genetics market. It was also used to gather vital information about the key players, as well as market classification and segmentation based on industry trends down to the most basic level, as well as key developments related to market and technology perspectives. A database of the key industry leaders was also prepared using secondary research.
Primary Research
In the primary research process, various sources from both the supply and demand sides were interviewed to obtain qualitative and quantitative information for this report. The primary sources from the supply side include industry experts such as CEOs, vice presidents, marketing and sales directors, technology and innovation directors, and related key executives from various key companies and organisations operating in the animal genetics market. The primary sources from the demand side included industry experts, purchase and sales managers, doctors, and personnel from research organizations. Primary research was conducted to validate the market segmentation, identify key players in the market, and gather insights on key industry trends and key market dynamics.
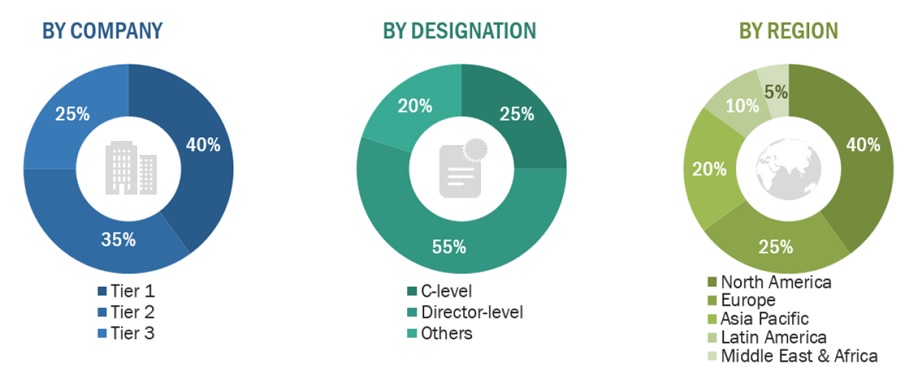
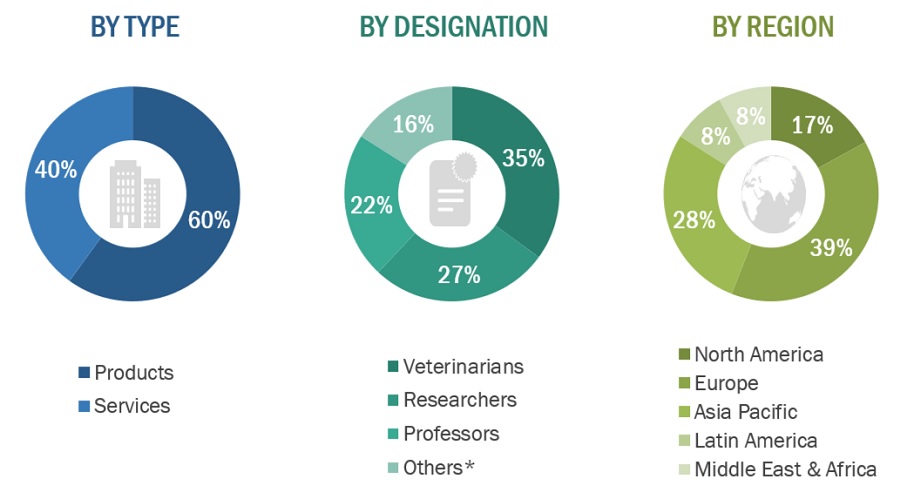
A breakdown of the primary respondents is provided below:
To know about the assumptions considered for the study, download the pdf brochure
Market Size Estimation
The total size of the animal genetics market was arrived at after data triangulation from two different approaches, as mentioned below.
An approach to calculating the revenue of different players in the animal genetics market
The size of the global animal genetics market was obtained from annual reports, SEC filings, online publications, and extensive primary interviews. A percentage split was applied to arrive at the size of market segments. Further splits were applied to arrive at the size for each sub-segment. These percentage splits were validated by primary participants. The country-level market sizes obtained from the annual reports, SEC filings, online publications, and extensive primary interviews were added up to reach the total market size for regions. By adding up the market sizes for all the regions, the global animal genetics market was derived.
An approach to derive the market size and estimate market growth
The market size and market growth were estimated through primary interviews on a regional and global level. All responses were collated, and a weighted average was taken to derive a probabilistic estimate of the market size and growth rate.
Data Triangulation
After arriving at the overall market size using the market size estimation processes explained above, the market was split into several segments and sub-segments. To complete the overall market engineering process and arrive at the exact statistics of each market segment and subsegment, data triangulation and market breakdown procedures were employed, wherever applicable. The data was triangulated by studying various factors and trends from both the demand and supply sides.
Objectives of the Study
- To define, describe, and forecast the global animal genetics market by products, services, and region
- To provide detailed information about the significant factors influencing market growth (such as drivers, restraints, opportunities, and challenges),
- to analyse micromarkets with respect to individual growth trends, prospects, and contributions to the overall animal genetics market.
- to analyse market opportunities for stakeholders and provide details of the competitive landscape for key players.
- To forecast the size of the animal genetics market in five major regions along with their respective key countries (Europe, North America, Asia-Pacific, Latin America, and the Middle East and Africa),
- To profile the key players in the global animal genetics market and comprehensively analyze their core competencies and market shares
- to track and analyse competitive developments such as product launches, expansions, and R&D activities of the leading players in the animal genetics market.
Available Customizations
With the given market data, MarketsandMarkets offers customizations as per the company's specific needs. The following customization options are available for the report:
Geographic Analysis
- Further breakdown of the Asia-Pacific Animal genetics market into South Korea, Australia, and other Southeast Asian countries
- Further breakdown of the European Animal genetics market into Russia and Switzerland.
Future Hypothetic Challenges of Veterinary Genetics in Genetics Testing Business in Future
- Ethical concerns: As genetic testing becomes more common in veterinary medicine, there may be increased ethical concerns about the use of genetic data and the potential implications for animal welfare and ownership. This could lead to regulatory scrutiny and public backlash, which could limit the growth of the veterinary genetics testing industry.
- Lack of standardized protocols: Unlike in human genetics testing, there are no standardized protocols for genetic testing in veterinary medicine, which could lead to inconsistent and unreliable results. This could make it difficult for veterinarians and animal owners to interpret the results of genetic tests and make informed decisions about animal health and breeding.
- Limited genetic diversity: Many animal breeds, particularly those with small populations, have limited genetic diversity, which could make it difficult to identify genetic markers and develop effective genetic tests. This could limit the market potential for veterinary genetics testing in certain animal populations.
- Intellectual property issues: The development and commercialization of genetic tests may be hindered by intellectual property issues, such as patent disputes or proprietary genetic data. This could limit competition in the veterinary genetics testing industry and reduce the availability of genetic testing options for veterinarians and animal owners.
- Data privacy and security: As with human genetic testing, there are concerns about data privacy and security in veterinary genetics testing. The misuse or unauthorized access of genetic data could lead to breaches of animal privacy or even animal theft. This could lead to increased scrutiny from regulatory agencies and animal welfare organizations, which could impact the growth of the veterinary genetics testing industry.
Growth Drivers for Veterinary Genetics Market in Future
- Increased demand for genetic testing: As pet owners become more interested in preventative care and personalized medicine for their animals, the demand for genetic testing may increase. This could be driven by the desire to identify potential health risks and develop customized treatment plans for individual animals.
- Advancements in technology: Advances in genetic sequencing technology and bioinformatics could lead to more efficient and accurate genetic testing methods, reducing the cost and time required for testing. This could make genetic testing more accessible to a wider range of pet owners and veterinarians.
- Growing interest in animal breeding: As the global population continues to grow, there may be increased demand for animal-derived products, such as meat, milk, and eggs. Genetic testing could be used to improve the health and productivity of livestock, leading to increased efficiency and profitability in the animal agriculture industry.
- Emergence of new markets: As the veterinary genetics industry continues to grow, new markets could emerge for genetic testing, such as wildlife conservation, zoos, and pet insurance companies. This could lead to increased demand for genetic testing and a wider range of applications for veterinary genetics.
- Increased focus on personalized medicine: As personalized medicine becomes more common in human healthcare, there may be a similar trend in veterinary medicine. Genetic testing could be used to develop personalized treatment plans for individual animals, leading to improved health outcomes and increased customer satisfaction.
Veterinary Genetics Market Future Industry Impact
- Animal healthcare: The veterinary genetics market has the potential to transform animal healthcare by providing personalized treatment plans and disease prevention strategies. As genetic testing becomes more advanced and accessible, it could become a standard part of routine veterinary care.
- Animal breeding: The use of genetic testing in animal breeding could have a significant impact on the livestock industry, as it could lead to the development of more productive and disease-resistant animals. Genetic testing could also be used in companion animal breeding to improve breed health and reduce the risk of inherited diseases.
- Biotechnology: The veterinary genetics market could be a valuable source of genetic data and biological samples for biotechnology companies. This could lead to the development of new therapies, vaccines, and other products for animal health and disease prevention.
- Conservation biology: Genetic testing could be used to monitor and conserve endangered animal populations. By analyzing genetic data, scientists could better understand the genetic diversity and health of these populations, and develop strategies to maintain their genetic integrity.
- Pet insurance: As the veterinary genetics market continues to grow, pet insurance companies may begin to offer policies that cover genetic testing and related treatments. This could lead to increased demand for genetic testing in the companion animal market.
To speak to our analyst for a discussion on the above findings, click Speak to Analyst
Growth opportunities and latent adjacency in Animal Genetics Market
What are the major challenges faced by key players of the global animal genetics market?
I am looking for the detailed geographical analysis of the global animal genetics market
In what way the COVID19 is impacting the global growth of animal genetics market