Genotyping Assay Market by Technology (PCR, Sequencing, Microarray, Electrophoresis, MALDI-TOF), Application (Pharmacogenomics, Diagnostic Research, Animal Genetics, Agricultural Biotechnology), and Product - Global Forecast to 2023
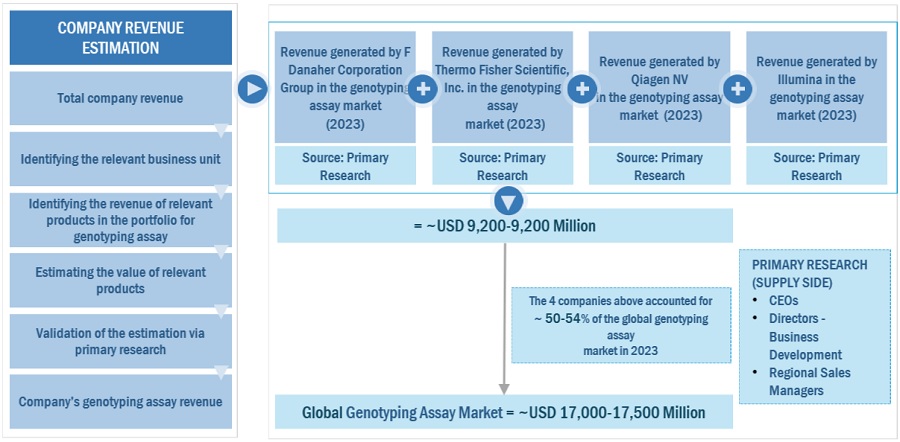
MarketsandMarkets forecasts the Genotyping Assay market to grow from USD 11.8 billion in 2018 to USD 31.9 billion by 2023, at a Compound Annual Growth Rate (CAGR) of 22.0% during the forecast period. The major factors that are expected to be driving the genotyping assay market are technological advancements and the decreasing prices of DNA sequencing. The increasing incidence of genetic diseases and rising awareness of personalized medicine, growing importance of genotyping in drug development, and the increasing demand for bioinformatics solutions in data analysis are also expected to promote market growth in the coming years. The objective of the report is to define, describe, and forecast the genotyping assay market size based on product & service, technology, application, end user, and region.
By product & service, the reagents and kits segment is expected to grow at the highest growth rate during the forecast period
Among the product & service, segment, the reagents and kits segment is expected to grow at the highest CAGR during the forecast period. The factors attributing to the high growth are, the accessibility of a wide range of reagents, the increasing demand for reagents owing to the increasing genotyping test volumes across the globe, and the relatively smaller capital investment required to adopt reagents and kits for genotyping in pharmaceuticals and diagnostic centers.
By technology, the sequencing segment to record the highest CAGR during the forecast period
The sequencing segment is expected to witness a faster growth rate in this market due to factors such as, the increasing application areas of DNA sequencing technologies, technological advancements, the availability of high-speed sequencing instruments, and the growing uptake of the hybrid approach of sequencing.
By application, the pharmacogenomics segment is expected to account for the largest share of the genotyping assay market
On the basis of application, the genotyping market is segmented into pharmacogenomics, diagnostics & personalized medicine, agricultural biotechnology, animal genetics, and other applications. The pharmacogenomics segment is expected to account for the largest share of the genotyping market during the forecast period. The large share of this segment can be attributed to the increasing use of genotyping to predict the efficiency of drugs during drug development and the growing need to understand the adverse effects of drugs.
By end user, the pharmaceutical and biopharmaceutical companies segment to record the highest CAGR during the forecast period
The pharmaceutical and biopharmaceutical companies segment is expected to witness the highest growth during the forecast period. The increasing demand for pharmacogenomics in the drug discovery and development process and recommendations from the FDA to include genotyping and pharmacogenomics studies in the course of drug discovery have contributed to the growth of this market segment.
North America to account for the largest market size during the forecast period.
North America is expected to hold the largest market size in the global genotyping market during the forecast period, followed by the European region. The increasing adoption of technologically advanced genotyping products, the high healthcare expenditure, presence of advanced healthcare infrastructure, highly developed healthcare systems in the US and Canada, large number of genotyping-based R&D projects, and the presence of a large number of leading genotyping manufacturers in the region, along with an increasing demand from pharmaceutical companies for genotyping products and rising investments by government bodies, are responsible for the large share of the North American genotyping market.
Market Dynamics
Driver: Technological Advancements and Decreasing Prices of DNA Sequencing
Technical advancements have allowed for miniaturization, automation, and reduced overall costs, as well as operational flexibility and the incorporation of multi-parameter testing. All of these have greatly helped increase the applications and convenience of DNA sequencing, allowing physicians to focus on high-level decision-making such as identifying and prioritizing drug targets through various genotyping studies. This has directly boosted the uptake of PCR, sequencing, capillary electrophoresis, and microarray technologies in fields such as drug discovery and clinical research. In addition to this, technological advances in DNA sequencing such as NGS have allowed for rapid, accurate sequencing, allowing for high productivity. This has also reduced the cost of DNA sequencing, reducing the overall cost of genomic and genotyping projects by USD 2,500 within a year (Source: National Human Genome Institute).
Restraint: High Cost of Equipment Used In Genotyping
Instruments required to carry out genotyping tests are very expensive, and high capital investment is required for their installation. For instance, qPCR systems cost ~USD 20,00030,000, while dPCR systems cost USD 65,000USD 70,000 for manual dPCR and crest at USD 100,000 for automated dPCR. NGS sequencers can cost between USD 19,900 to USD 1 million. Illuminas new sequencersNovaSeq 5000 and NovaSeq 6000are priced at about USD 850,000 and USD 985,000, respectively. Genotyping instruments are equipped with advanced features and functionalities, making them highly priced. Pharmaceutical companies and research laboratories require a number of such systems, creating the need for significant investments for procuring multiple, high-cost genotyping instruments. Maintenance costs and several other indirect expenses, such as sample and labor costs, also result in an overall increase in the total cost of ownership of these instruments. As a result, the installation/expansion of advanced research facilities such as NGS technology is hampered in academic and research institutes in developing nations across Asia, the Middle East, and Africa.
Opportunity: Increasing Application Areas of Genotyping
Genotyping platforms have several potential application areas such as pharmacogenomics, diagnostic research, personalized medicine, and forensics. Furthermore, this technology is also apt for a range of veterinary needs, food safety and quality, and environmental testing in remote areas and industrial settings. At present, human diagnostics and pharmacogenomics offer significant marker potential as these segments require rapid genotyping analysis on a large scale due to the need for better treatment options and high disease prevalence. Technologies such as NGS are being adapted to this purpose, with companies such as QIAGEN and Freenome (US) partnering to develop NGS-based tests for precision medicine.
Challenge: Data Management in Genotyping Research
Quantitative and qualitative genotyping studies generate massive volumes of data. Earlier, this data was stored manually; however, this presented a major challenge as up to gigabytes of data could be generated within a few hours. Technological advancements have enabled automation in the data storage process by creating databases for storing genotyping data. However, understanding the full potential of such datasets is another hurdle for technicians. Major genomic databases include the Conserved Domain Database (CDD), Database of Genomic Structural Variation (dbVar), Database of Genotypes and Phenotypes (dbGaP), Database of Short Genetic Variations (dbSNP), Genetic Testing Registry (GTR), and Genome Reference Consortium (GRC). These databases are still working on ways to streamline data importing and storage queried during multiple sequencing experiments using a common web interface.
Get online access to the report on the World's First Market Intelligence Cloud
- Easy to Download Historical Data & Forecast Numbers
- Company Analysis Dashboard for high growth potential opportunities
- Research Analyst Access for customization & queries
- Competitor Analysis with Interactive dashboard
- Latest News, Updates & Trend analysis
Request Sample Scope of the Report
Get online access to the report on the World's First Market Intelligence Cloud
- Easy to Download Historical Data & Forecast Numbers
- Company Analysis Dashboard for high growth potential opportunities
- Research Analyst Access for customization & queries
- Competitor Analysis with Interactive dashboard
- Latest News, Updates & Trend analysis
Report Metric |
Details |
Market size available for years |
20162023 |
Base year considered |
2017 |
Forecast period |
20182023 |
Forecast units |
Million (USD) |
Segments covered |
Product & Service, Technology, Application, End User, and Region |
Geographies covered |
North America, Europe, APAC, MEA, and Latin America |
Companies covered |
Thermo Fisher Scientific (US), Illumina (US), QIAGEN (Netherlands), Agilent Technologies (US), Danaher Corporation (US), Roche Diagnostics (Switzerland), GE Healthcare (US), Fluidigm Corporation (US), PerkinElmer (US), Eurofins Scientific (Luxembourg), Bio-Rad Laboratories (US), Pacific Biosciences of California (US), GENEWIZ (US), and Integrated DNA Technologies (US). |
The research report categorizes the genotyping assay to forecast the revenues and analyze the trends in each of the following sub-segments:
Genotyping Market, By Product & Service
- Reagents & Kits
- Genotyping Services
- Instruments
- Sequencers & Amplifiers
- Analyzers
- Bioinformatics
- Software
- Services
Genotyping Market, By Technology
- PCR
- Real-time PCR
- Digital PCR
- Microarrays
- Sequencing
- NGS
- Pyrosequencing
- Sanger Sequencing
- Capillary Electrophoresis
- Amplified Fragment Length Polymorphism
- Restricted Fragment Length Polymorphism
- Single-stranded Conformation Polymorphism
- MALDI-TOF
- Other Technologies (Allele-specific Oligonucleotide (ASO) Probes and Fluorescence In Situ Hybridization (FISH))
Genotyping Market, By Application
- Pharmacogenomics
- Diagnostic & Personalized Medicine
- Agricultural Biotechnology
- Animal Genetics
- Other Applications (Prenatal Testing, Human Forensics, Microbial Genomic Studies, and Aquaculture Breeding Studies)
Genotyping Market, By End User
- Pharmaceutical and Biopharmaceutical Companies
- Diagnostic and Research Laboratories
- Academic Institutes
- Other End Users (Animal and Aqua Genetics Companies, Greenhouses, and Farms)
Genotyping Market, by Region
- North America
- US
- Canada
- Europe
- Germany
- UK
- France
- Italy
- Spain
- Rest of Europe
- Asia Pacific
- China
- Japan
- India
- Rest of Asia Pacific
- Latin America
- Middle East and Africa
Key Market Players
Illumina (US), Thermo Fisher Scientific (US), QIAGEN (Netherlands), Agilent Technologies (US), Danaher Corporation (US), Roche Diagnostics (Switzerland), GE Healthcare (US), Fluidigm Corporation (US), PerkinElmer (US), Eurofins Scientific (Luxembourg), Bio-Rad Laboratories (US), Pacific Biosciences of California (US), GENEWIZ (US), and Integrated DNA Technologies (US).
Illumina is the leading player in the genotyping market. The company led the sequencing market with its flagship NGS platformsiSeq 100 system (launched in January 2018), NovaSeq 6000, HiSeq Series, MiSeq Series, NextSeq 500, and HiSeq X Ten & HiSeq X Five. Illumina also provides reagents such as TruSeq sample preparation kits, TruSeq SBS sequencing kits, and other sequencing reagents, along with sequencing services such as whole-genome sequencing, human whole-exome sequencing, de novo sequencing, custom-targeted resequencing, gene expression using random-primed RNA sampling, and other related services.
Recent Developments
- In May 2018, Agilent technologies opened a new logistics center in Texas to increase its capacity for house inventory and to fulfill the growing demand for NGS products from its genomics group.
- In March 2018, Danaher Corporation acquired Integrated DNA Technologies Inc. (US). This acquisition strengthened Danahers Life Sciences platform. IDT will operate as a standalone operating company and brand within Danaher Corporation.
- In January 2018, Thermo Fisher Scientific signed a partnership with Illumina (US) that enabled Illumina to sell the Ion AmpliSeq technology to researchers who conduct scientific studies using Illuminas next-generation sequencing (NGS) platforms.
- In January 2018, Illumina launched the iSeq 100 Sequencing System.
- In January 2018, Thermo Fisher Scientific launched the Ion GeneStudio S5 Series Instrument.
Critical questions the report answers:
- Where will all these developments take the industry in the long term?
- What are the upcoming trends for the genotyping market?
- Which segment provides the most opportunity for growth?
- Who are the leading players operating in this market?
- What are the opportunities for new market entrants?
To speak to our analyst for a discussion on the above findings, click Speak to Analyst
Table of Contents
1 Introduction
1.1 Objectives Of The Study
1.2 Market Definition
1.3 Market Scope
1.3.1 Markets Covered
1.3.2 Market Segmentation, By Region
1.3.3 Years Considered for The Study
1.4 Currency
1.5 Limitations
1.6 Stakeholders
2 Research Methodology
2.1 Research Data
2.1.1 Secondary Data
2.1.1.1 Key Data From Secondary Sources
2.1.2 Primary Data
2.1.2.1 Key Data From Primary Sources
2.1.2.2 Key Industry Insights
2.2 Market Size Estimation
2.2.1 Bottom-Up Approach
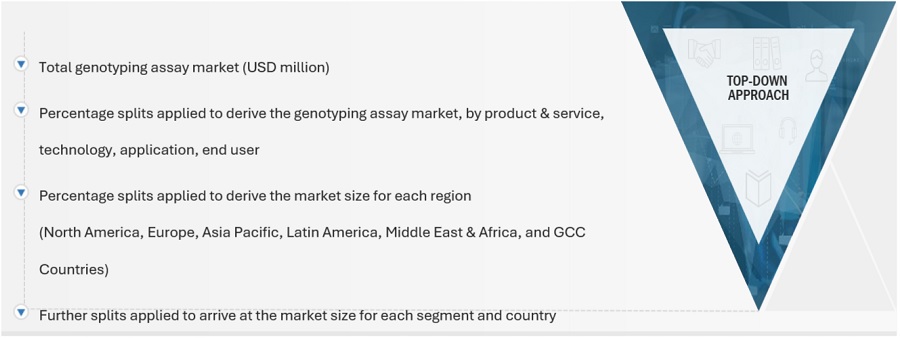
2.2.2 Top-Down Approach
2.3 Market Breakdown and Data Triangulation
2.4 Assumptions for The Study
3 Executive Summary
4 Premium Insights
4.1 Genotyping Market Overview
4.2 Asia Pacific: Genotyping Market, By Product & Service, By Country,2017
4.3 Geographic Snapshot of The Genotyping Market
4.4 Geographic Mix: Genotyping Market
4.5 Genotyping Market: Developing Vs. Developed Markets
5 Market Overview
5.1 Introduction
5.2 Market Dynamics: Impact Analysis
5.3 Market Drivers
5.3.1 Technological Advancements and Decreasing Prices of DNA Sequencing
5.3.2 Increasing Incidence of Genetic Diseases and Rising Awareness on Personalized Medicine
5.3.3 Growing Importance of Genotyping in Drug Development
5.3.4 Increasing Demand for Bioinformatics Solutions in Data Analysis
5.4 Market Restraints
5.4.1 High Cost of Equipment Used in Genotyping
5.5 Market Opportunities
5.5.1 Growing Importance of Sequencing Projects
5.5.2 Increasing Application Areas of Genotyping
5.5.3 Increasing Demand for Genome Analysis in Plant and Animal Livestock
5.6 Market Challenges
5.6.1 Data Management in Genotyping Research
5.6.2 Dearth of Trained Resources
6 Industry Insights
6.1 Industry Trends
6.1.1 Increasing Demand for Genotyping & Sequencing Services
6.1.2 Increasing Collaborations
6.1.3 Increasing Awareness
6.2 Regulatory Analysis
6.2.1 Us
6.2.2 Europe
6.2.3 Japan
6.2.4 China
6.2.5 India
6.3 Strategic Benchmarking
6.3.1 Genotyping Market: Product Portfolio Analysis (Instruments & Kits)
6.3.2 Genotyping Market: Product Portfolio Analysis (Bioinformatics)
7 Genotyping Market, By Product & Service
7.1 Introduction
7.2 Reagents & Kits
7.2.1 Reagents & Kits Accounted for The Largest Share of The Genotyping Market in 2017
7.3 Genotyping Services
7.3.1 High Demand for Genotyping Services in End-Use Markets to Drive Growth of This Segment
7.4 Instruments
7.4.1 Sequencers & Amplifiers
7.4.1.1 Sequencers & Amplifiers Segment to Register The Highest Growth Rate During The Forecast Period
7.4.2 Analyzers
7.4.2.1 Growing Advancements in Analyzers Will Drive Further Market Growth
7.5 Bioinformatics
7.5.1 Software
7.5.1.1 Software Segment Accounted for The Largest Share of The Genotyping Bioinformatics Market in 2017
7.5.2 Services
7.5.2.1 Growing Applications of Bioinformatics in Various Industries Will Boost The Growth of This Segment
8 Genotyping Market, By Technology
8.1 Introduction
8.2 Polymerase Chain Reaction
8.2.1 Real-Time PCR
8.2.1.1 Growing Adoption of Real-Time PCR Accounted for Larger Market Share of The Segment in 2017
8.2.2 Digital PCR
8.2.2.1 The High Cost of DPCR Instruments to Restrain The Growth of This Market
8.3 Microarrays
8.3.1 Increasing Demand for Personalized Medicine to Drive Market Growth
8.4 Sequencing
8.4.1 Next-Generation Sequencing
8.4.1.1 NGS to Witness The Highest Growth Rate in The Sequencing Market During The Forecast Period
8.4.2 Pyro sequencing
8.4.2.1 Growing Demand in End Use Markets to Drive The Adoption of This Technology Segment
8.4.3 Sanger Sequencing
8.4.3.1 Increasing Use of This Technology in Small-Scale Experiments is The Major Factor Driving Market Growth
8.5 Capillary Electrophoresis
8.5.1 Amplified Fragment Length Polymorphism
8.5.1.1 AFLP Technique to Witness The Highest Growth Rate in The Capillary Electrophoresis Market During The Forecast Period
8.5.2 Restriction Fragment Length Polymorphism
8.5.2.1 Increasing Demand for RFLP From Forensics, And Pharmaceutical Companies Will Drive Market Growth
8.5.3 Single-Strand Conformation Polymorphism
8.5.3.1 Increasing Applications of SSCP in Virology are Expected to Boost Growth of The Sscp Market
8.6 Matrix-Assisted Laser Desorption/Ionization-Time of Flight (Maldi-TOF) Mass Spectrometry
8.6.1 Increasing Applications of This Technique in Clinical Diagnostics and Pharmacogenomics to Drive Market Growth
8.7 Other Technologies
9 Genotyping Market, By Application
9.1 Introduction
9.2 Pharmacogenomics
9.2.1 Pharmacogenomics Segment Accounted for The Largest Share of The Genotyping Market in 2017
9.3 Diagnostics & Personalized Medicine
9.3.1 Increasing Potential Rapid Genotyping Techniques in Diagnostic Tests Will Offer Further Growth of This Application Segment
9.4 Animal Genetics
9.4.1 Lower Adoption of Genotyping Technologies in Developing Countries to Restrain The Growth of This Segment
9.5 Agricultural Biotechnology
9.5.1 Increasing Number of Research Laboratories and Greenhouses Using Plant Genotyping are Expected to Drive This Segment
9.6 Other Applications
10 Genotyping Market, By End User
10.1 Introduction
10.2 Pharmaceutical & Biopharmaceutical Companies
10.2.1 Pharmaceutical & Biopharmaceutical Companies to Register The Highest Growth During The Forecast Period
10.3 Diagnostic & Research Laboratories
10.3.1 Increasing Research Focused on Personalized Diagnosis is One of The Key Factors Driving Market Growth
10.4 Academic Institutes
10.4.1 Rising Industry-Academia Collaborations for Drug Development Will Offer Market Growth
10.5 Other End Users
11 Genotyping Market, By Region
11.1 Introduction
11.2 North America
11.2.1 Us
11.2.1.1 Us Dominated The North American Genotyping Market in 2018; This Trend to Continue During The Forecast Period
11.2.2 Canada
11.2.2.1 Increasing Incidence of Genetic Diseases & The Availability of A Wide Range of Genotyping Products to Drive Market Growth in Canada
11.3 Europe
11.3.1 Germany
11.3.1.1 Germany Accounted for The Largest Share of The European Genotyping Market in 2017
11.3.2 France
11.3.2.1 Growing Public-Private Investments Will Drive The Growth of The Genotyping Market in France
11.3.3 UK
11.3.3.1 UK to Witness The Highest Growth in The European Genotyping Market During The Forecast Period
11.3.4 Italy
11.3.4.1 Presence of A Well-Developed Healthcare System to Offer Growth Opportunities in Italy
11.3.5 Spain
11.3.5.1 The Lingering Effect of Economic Downturns Will Continue to Affect Healthcare in Spain
11.3.6 Rest of Europe
11.4 Asia Pacific
11.4.1 China
11.4.1.1 Infrastructural Improvements in Chinas Healthcare System Have Boosted Treatment Rates and Care Delivery
11.4.2 Japan
11.4.2.1 Strong Base of Pharmaceutical Activity Will Contribute to The Use of Genotyping
11.4.3 India
11.4.3.1 Growth of The Pharmaceutical Industry has Highlighted The Need for Better Infrastructure in India
11.4.4 Rest of APAC
11.5 Latin America
11.6 Middle East and Africa
12 Competitive Landscape
12.1 Overview
12.2 Product Portfolio Matrix
12.3 Market Share Analysis
12.4 Competitive Situations and Trends
12.4.1 Agreements, Collaborations and Partnerships
12.4.2 Acquisitions
12.4.3 Expansions
13 Company Profiles(Introduction, Products & Services, Strategy,& Analyst Insights, Developments, MNM View)*
13.1 Illumina, INC.
13.1.1 Business Overview
13.1.2 Products & Services Offered
13.1.3 Recent Developments
13.1.4 MnM View
13.2 Thermo Fisher Scientific, INC.
13.2.1 Business Overview
13.2.2 Products & Services Offered
13.2.3 Recent Developments
13.2.4 SWOT Analysis
13.2.5 MnM View
13.3 Roche Diagnostics Limited
13.3.1 Business Overview
13.3.2 Products & Services Offered
13.3.3 Recent Developments
13.3.4 SWOT Analysis
13.3.5 MnM View
13.4 Qiagen N.V.
13.4.1 Business Overview
13.4.2 Products & Services Offered
13.4.3 Recent Developments
13.4.4 Swot Analysis
13.4.5 Mnm View
13.5 Danaher Corporation
13.5.1 Business Overview
13.5.2 Products & Services Offered
13.5.3 Recent Developments
13.5.4 Mnm View
13.6 Agilent Technologies, INC.
13.7 Fluidigm Corporation
13.8 GE Healthcare
13.9 Genewiz, INC.
13.1 Integrated Dna Technologies, INC. (A Subsidiary of Danaher Corporation)
13.11 Perkinelmer, INC.
13.12 Bio-Rad Laboratories, INC.
13.13 Eurofins Scientific
13.14 Pacific Biosciences of California, INC.
14 Appendix
14.1 Insights of Industry Experts
14.2 Discussion Guide
14.3 Knowledge Store: Marketsandmarkets Subscription Portal
14.4 Available Customizations
14.5 Related Report
14.6 Author Details
List of Tables (219 Table)
Table 1 Standard Currency Conversion Rates
Table 2 Genotyping Market Snapshot,2018 Vs. 2023
Table 3 Comparative Data: Older Vs Latest Platforms,By Company
Table 4 Recent Developments in The Genotyping Market
Table 5 China: Time,Cost,And Complexity of Registration Process
Table 6 Genotyping Market,By Product & Service,20162023 (USD Million)
Table 7 Genotyping Reagents & Kits Market,By Country,20162023 (USD Million)
Table 8 Genotyping Services Market,By Country,20162023 (USD Million)
Table 9 Genotyping Instruments Market,By Type,2016-2023 (USD Million)
Table 10 Genotyping Instruments Market,By Country,20162023 (USD Million)
Table 11 Genotyping Sequencers & Amplifiers Market,By Country,20162023 (USD Million)
Table 12 Genotyping Analyzers Market,By Country,20162023 ( USD Million)
Table 13 Genotyping Bioinformatics Market,By Type,2016-2023,(USD Million)
Table 14 Genotyping Bioinformatics Market,By Country,20162023 (USD Million)
Table 15 Genotyping Bioinformatics Software Market,By Country,20162023 (USD Million)
Table 16 Genotyping Bioinformatics Services Market,By Country,20162023 (USD Million)
Table 17 Genotyping Market,By Technology,20162023 (USD Million)
Table 18 Comparative Study: Real-Time Pcr Vs Digital Pcr
Table 19 Polymerase Chain Reaction Market,By Type,20162023 (USD Million)
Table 20 Polymerase Chain Reaction Market,By Country,20162023 (USD Million)
Table 21 Major Real-Time Pcr Products Available in The Market
Table 22 Real-Time Pcr Market,By Country,20162023 (USD Million)
Table 23 Major Digital Pcr Products Available in The Market
Table 24 Digital Pcr Market,By Country,20162023 (USD Million)
Table 25 Major Microarray Products Available in The Market
Table 26 Microarrays Market,By Country,20162023 (USD Million)
Table 27 Sequencing Market,By Type,20162023 (USD Million)
Table 28 Sequencing Market,By Country,20162023 (USD Million)
Table 29 Major Next-Generation Sequencing Products Available in The Market
Table 30 Next-Generation Sequencing Market,By Country,20162023 (USD Million)
Table 31 Major Pyrosequencing Products Available in The Market
Table 32 Pyrosequencing Market,By Country,20162023 (USD Million)
Table 33 Major Sanger Sequencing Products Available in The Market
Table 34 Sanger Sequencing Market,By Country,20162023 (USD Million)
Table 35 Capillary Electrophoresis Market,By Type,20162023 (USD Million)
Table 36 Capillary Electrophoresis Market,By Country,20162023 (USD Million)
Table 37 Major Aflp Products Available in The Market
Table 38 Amplified Fragment Length Polymorphism Market,By Country,20162023 (USD Million)
Table 39 Major Rflp Products Available in The Market
Table 40 Restriction Fragment Length Polymorphism Market,By Country,20162023 (USD Million)
Table 41 Major Sscp Products Available in The Market
Table 42 Single-Strand Conformation Polymorphism Market,By Country,20162023 (USD Million)
Table 43 Major Maldi-Tof Products Available in The Market
Table 44 Maldi-Tof Mass Spectrometry Market,By Country,20162023 (USD Million)
Table 45 Major Products Available in The Market
Table 46 Genotyping Market for Other Technologies,By Country,20162023 (USD Million)
Table 47 Genotyping Market,By Application,20162023 (USD Million)
Table 48 Genotyping Market for Pharmacogenomics,By Country,20162023 (USD Million)
Table 49 Genotyping Market for Diagnostics & Personalized Medicine,By Country,20162023 (USD Million)
Table 50 Genotyping Market for Animal Genetics,By Country,20162023 (USD Million)
Table 51 Genotyping Market for Agricultural Biotechnology,By Country,20162023 (USD Million)
Table 52 Genotyping Market for Other Applications,By Country,20162023 (USD Million)
Table 53 Genotyping Market,By End User,20162023 (USD Million)
Table 54 Genotyping Market for Pharmaceutical & Biopharmaceutical Companies,By Country,20162023 (USD Million)
Table 55 Genotyping Market for Diagnostic and Research Laboratories,By Country,20162023 (USD Million)
Table 56 Genotyping Market for Academic Institutes,By Country,20162023 (USD Million)
Table 57 Genotyping Market for Other End Users,By Country,20162023 (USD Million)
Table 58 Genotyping Market,By Region,20162023 (USD Million)
Table 59 North America: Genotyping Market,By Country,20162023 (USD Million)
Table 60 North America: Genotyping Market,By Product & Service,20162023 (USD Million)
Table 61 North America: Genotyping Instruments Market,By Type,20162023 (USD Million)
Table 62 North America: Genotyping Bioinformatics Market,By Type,20162023 (USD Million)
Table 63 North America: Genotyping Market,By Technology,20162023 (USD Million)
Table 64 North America: Polymerase Chain Reaction Market,By Type,20162023 (USD Million)
Table 65 North America: Sequencing Market,By Type,20162023 (USD Million)
Table 66 North America: Capillary Electrophoresis Market,By Type,20162023 (USD Million)
Table 67 North America: Genotyping Market,By Application,20162023 (USD Million)
Table 68 North America: Genotyping Market,By End User,20162023 (USD Million)
Table 69 US: Genotyping Market,By Product & Service,20162023 (USD Million)
Table 70 US: Genotyping Instruments Market,By Type,20162023 (USD Million)
Table 71 US: Genotyping Bioinformatics Market,By Type,20162023 (USD Million)
Table 72 US: Genotyping Market,By Technology,20162023 (USD Million)
Table 73 US: Polymerase Chain Reaction Market,By Type,20162023 (USD Million)
Table 74 US: Sequencing Market,By Type,20162023 (USD Million)
Table 75 US: Capillary Electrophoresis Market,By Type,20162023 (USD Million)
Table 76 US: Genotyping Market,By Application,20162023 (USD Million)
Table 77 US: Genotyping Market,By End User,20162023 (USD Million)
Table 78 Canada: Genotyping Market,By Product & Service,20162023 (USD Million)
Table 79 Canada: Genotyping Instruments Market,By Type,20162023 (USD Million)
Table 80 Canada: Genotyping Bioinformatics Market,By Type,20162023 (USD Million)
Table 81 Canada: Genotyping Market,By Technology,20162023 (USD Million)
Table 82 Canada: Polymerase Chain Reaction Market,By Type,20162023 (USD Million)
Table 83 Canada: Sequencing Market,By Type,20162023 (USD Million)
Table 84 Canada: Capillary Electrophoresis Market,By Type,20162023 (USD Million)
Table 85 Canada: Genotyping Market,By Application,20162023 (USD Million)
Table 86 Canada: Genotyping Market,By End User,20162023 (USD Million)
Table 87 Europe: Genotyping Market,By Country,20162023 (USD Million)
Table 88 Europe: Genotyping Market,By Product & Service,20162023 (USD Million)
Table 89 Europe: Genotyping Instruments Market,By Type,20162023 (USD Million)
Table 90 Europe: Genotyping Bioinformatics Market,By Type,20162023 (USD Million)
Table 91 Europe: Genotyping Market,By Technology,20162023 (USD Million)
Table 92 Europe: Polymerase Chain Reaction Market,By Type,20162023 (USD Million)
Table 93 Europe: Sequencing Market,By Type,20162023 (USD Million)
Table 94 Europe: Capillary Electrophoresis Market,By Type,20162023 (USD Million)
Table 95 Europe: Genotyping Market,By Application,20162023 (USD Million)
Table 96 Europe: Genotyping Market,By End User,20162023 (USD Million)
Table 97 Germany: Genotyping Market,By Product & Service,20162023 (USD Million)
Table 98 Germany: Genotyping Instruments Market,By Type,20162023 (USD Million)
Table 99 Germany: Genotyping Bioinformatics Market,By Type,20162023 (USD Million)
Table 100 Germany: Genotyping Market,By Technology,20162023 (USD Million)
Table 101 Germany: Polymerase Chain Reaction Market,By Type,20162023 (USD Million)
Table 102 Germany: Sequencing Market,By Type,20162023 (USD Million)
Table 103 Germany: Capillary Electrophoresis Market,By Type,20162023 (USD Million)
Table 104 Germany: Genotyping Market,By Application,20162023 (USD Million)
Table 105 Germany: Genotyping Market,By End User,20162023 (USD Million)
Table 106 France: Genotyping Market,By Product & Service,20162023 (USD Million)
Table 107 France: Genotyping Instruments Market,By Type,20162023 (USD Million)
Table 108 France: Genotyping Bioinformatics Market,By Type,20162023 (USD Million)
Table 109 France: Genotyping Market,By Technology,20162023 (USD Million)
Table 110 France: Polymerase Chain Reaction Market,By Type,20162023 (USD Million)
Table 111 France: Sequencing Market,By Type,20162023 (USD Million)
Table 112 France: Capillary Electrophoresis Market,By Type,20162023 (USD Million)
Table 113 France: Genotyping Market,By Application,20162023 (USD Million)
Table 114 France: Genotyping Market,By End User,20162023 (USD Million)
Table 115 UK: Genotyping Market,By Product & Service,20162023 (USD Million)
Table 116 UK: Genotyping Instruments Market,By Type,20162023 (USD Million)
Table 117 UK: Genotyping Bioinformatics Market,By Type,20162023 (USD Million)
Table 118 UK: Genotyping Market,By Technology,20162023 (USD Million)
Table 119 UK: Polymerase Chain Reaction Market,By Type,20162023 (USD Million)
Table 120 UK: Sequencing Market,By Type,20162023 (USD Million)
Table 121 UK: Capillary Electrophoresis Market,By Type,20162023 (USD Million)
Table 122 UK: Genotyping Market,By Application,20162023 (USD Million)
Table 123 UK: Genotyping Market,By End User,20162023 (USD Million)
Table 124 Italy: Genotyping Market,By Product & Service,20162023 (USD Million)
Table 125 Italy: Genotyping Instruments Market,By Type,20162023 (USD Million)
Table 126 Italy: Genotyping Bioinformatics Market,By Type,20162023 (USD Million)
Table 127 Italy: Genotyping Market,By Technology,20162023 (USD Million)
Table 128 Italy: Polymerase Chain Reaction Market,By Type,20162023 (USD Million)
Table 129 Italy: Sequencing Market,By Type,20162023 (USD Million)
Table 130 Italy: Capillary Electrophoresis Market,By Type,20162023 (USD Million)
Table 131 Italy: Genotyping Market,By Application,20162023 (USD Million)
Table 132 Italy: Genotyping Market,By End User,20162023 (USD Million)
Table 133 Spain: Genotyping Market,By Product & Service,20162023 (USD Million)
Table 134 Spain: Genotyping Instruments Market,By Type,20162023 (USD Million)
Table 135 Spain: Genotyping Bioinformatics Market,By Type,20162023 (USD Million)
Table 136 Spain: Genotyping Market,By Technology,20162023 (USD Million)
Table 137 Spain: Polymerase Chain Reaction Market,By Type,20162023 (USD Million)
Table 138 Spain: Sequencing Market,By Type,20162023 (USD Million)
Table 139 Spain: Capillary Electrophoresis Market,By Type,20162023 (USD Million)
Table 140 Spain: Genotyping Market,By Application,20162023 (USD Million)
Table 141 Spain: Genotyping Market,By End User,20162023 (USD Million)
Table 142 RoE: Genotyping Market,By Product & Service,20162023 (USD Million)
Table 143 RoE: Genotyping Instruments Market,By Type,20162023 (USD Million)
Table 144 RoE: Genotyping Bioinformatics Market,By Type,20162023 (USD Million)
Table 145 RoE: Genotyping Market,By Technology,20162023 (USD Million)
Table 146 RoE: Polymerase Chain Reaction Market,By Type,20162023 (USD Million)
Table 147 RoE: Sequencing Market,By Type,20162023 (USD Million)
Table 148 RoE: Capillary Electrophoresis Market,By Type,20162023 (USD Million)
Table 149 RoE: Genotyping Market,By Application,20162023 (USD Million)
Table 150 RoE: Genotyping Market,By End User,20162023 (USD Million)
Table 151 Apac: Genotyping Market,By Country,20162023 (USD Million)
Table 152 Apac: Genotyping Market,By Product & Service,20162023 (USD Million)
Table 153 Apac: Genotyping Instruments Market,By Type,20162023 (USD Million)
Table 154 Apac: Genotyping Bioinformatics Market,By Type,20162023 (USD Million)
Table 155 Apac: Genotyping Market,By Technology,20162023 (USD Million)
Table 156 Apac: Polymerase Chain Reaction Market,By Type,20162023 (USD Million)
Table 157 Apac: Sequencing Market,By Type,20162023 (USD Million)
Table 158 Apac: Capillary Electrophoresis Market,By Type,20162023 (USD Million)
Table 159 Apac: Genotyping Market,By Application,20162023 (USD Million)
Table 160 Apac: Genotyping Market,By End User,20162023 (USD Million)
Table 161 China: Genotyping Market,By Product & Service,20162023 (USD Million)
Table 162 China: Genotyping Instruments Market,By Type,20162023 (USD Million)
Table 163 China: Genotyping Bioinformatics Market,By Type,20162023 (USD Million)
Table 164 China: Genotyping Market,By Technology,20162023 (USD Million)
Table 165 China: Polymerase Chain Reaction Market,By Type,20162023 (USD Million)
Table 166 China: Sequencing Market,By Type,20162023 (USD Million)
Table 167 China: Capillary Electrophoresis Market,By Type,20162023 (USD Million)
Table 168 China: Genotyping Market,By Application,20162023 (USD Million)
Table 169 China: Genotyping Market,By End User,20162023 (USD Million)
Table 170 Japan: Genotyping Market,By Product & Service,20162023 (USD Million)
Table 171 Japan: Genotyping Instruments Market,By Type,20162023 (USD Million)
Table 172 Japan: Genotyping Bioinformatics Market,By Type,20162023 (USD Million)
Table 173 Japan: Genotyping Market,By Technology,20162023 (USD Million)
Table 174 Japan: Polymerase Chain Reaction Market,By Type,20162023 (USD Million)
Table 175 Japan: Sequencing Market,By Type,20162023 (USD Million)
Table 176 Japan: Capillary Electrophoresis Market,By Type,20162023 (USD Million)
Table 177 Japan: Genotyping Market,By Application,20162023 (USD Million)
Table 178 Japan: Genotyping Market,By End User,20162023 (USD Million)
Table 179 India: Genotyping Market,By Product & Service,20162023 (USD Million)
Table 180 India: Genotyping Instruments Market,By Type,20162023 (USD Million)
Table 181 India: Genotyping Bioinformatics Market,By Type,20162023 (USD Million)
Table 182 India: Genotyping Market,By Technology,20162023 (USD Million)
Table 183 India: Polymerase Chain Reaction Market,By Type,20162023 (USD Million)
Table 184 India: Sequencing Market,By Type,20162023 (USD Million)
Table 185 India: Capillary Electrophoresis Market,By Type,20162023 (USD Million)
Table 186 India: Genotyping Market,By Application,20162023 (USD Million)
Table 187 India: Genotyping Market,By End User,20162023 (USD Million)
Table 188 RoAPAC: Genotyping Market,By Product & Service,20162023 (USD Million)
Table 189 RoAPAC: Genotyping Instruments Market,By Type,20162023 (USD Million)
Table 190 RoAPAC: Genotyping Bioinformatics Market,By Type,20162023 (USD Million)
Table 191 RoAPAC: Genotyping Market,By Technology,20162023 (USD Million)
Table 192 RoAPAC: Polymerase Chain Reaction Market,By Type,20162023 (USD Million)
Table 193 RoAPAC: Sequencing Market,By Type,20162023 (USD Million)
Table 194 RoAPAC: Capillary Electrophoresis Market,By Type,20162023 (USD Million)
Table 195 RoAPAC: Genotyping Market,By Application,20162023 (USD Million)
Table 196 RoAPAC: Genotyping Market,By End User,20162023 (USD Million)
Table 197 Latin America: Genotyping Market,By Product & Service,20162023 (USD Million)
Table 198 Latin America: Genotyping Instruments Market,By Type,20162023 (USD Million)
Table 199 Latin America: Genotyping Bioinformatics Market,By Type,20162023 (USD Million)
Table 200 Latin America: Genotyping Market,By Technology,20162023 (USD Million)
Table 201 Latin America: Polymerase Chain Reaction Market,By Type,20162023 (USD Million)
Table 202 Latin America: Sequencing Market,By Type,20162023 (USD Million)
Table 203 Latin America: Capillary Electrophoresis Market,By Type,20162023 (USD Million)
Table 204 Latin America: Genotyping Market,By Application,20162023 (USD Million)
Table 205 Latin America: Genotyping Market,By End User,20162023 (USD Million)
Table 206 MeA: Genotyping Market,By Product & Service,20162023 (USD Million)
Table 207 MeA: Genotyping Instruments Market,By Type,20162023 (USD Million)
Table 208 MeA: Genotyping Bioinformatics Market,By Type,20162023 (USD Million)
Table 209 MeA: Genotyping Market,By Technology,20162023 (USD Million)
Table 210 MeA: Polymerase Chain Reaction Market,By Type,20162023 (USD Million)
Table 211 MeA: Sequencing Market,By Type,20162023 (USD Million)
Table 212 MeA: Capillary Electrophoresis Market,By Type,20162023 (USD Million)
Table 213 MeA: Genotyping Market,By Application,20162023 (USD Million)
Table 214 MeA: Genotyping Market,By End User,20162023 (USD Million)
Table 215 Growth Strategy Matrix (20152018)
Table 216 Product Launches,Approvals,And Enhancements,20152018
Table 217 Collaborations,Partnerships,And Agreements,20152018
Table 218 Acquisitions,20152018
Table 219 Expansions,20152018
List of Figures (53 Figures)
Figure 1 Research Design
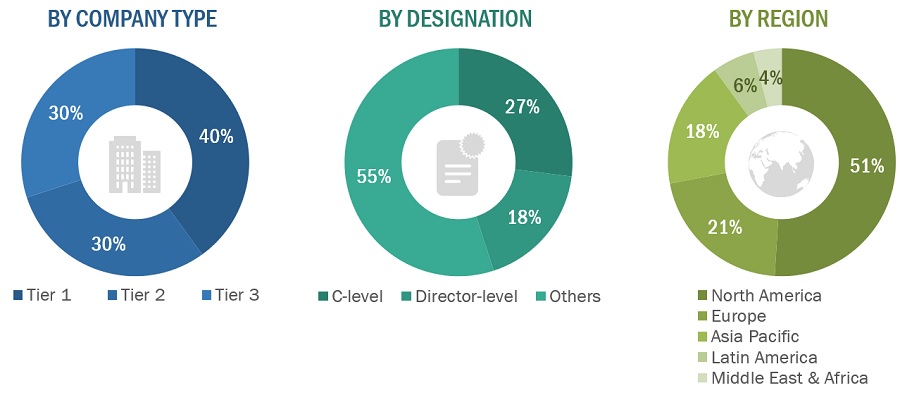
Figure 2 Primary Sources
Figure 3 Breakdown of Primary Interviews (Supply Side):
By Company Type,Designation,And Region 31
Figure 4 Breakdown of Primary Interviews (Demand Side):
By End User and Region 32
Figure 5 Data Triangulation Methodology
Figure 6 Genotyping Market,By Product & Service,2018 Vs. 2023 (USD Million)
Figure 7 Genotyping Instruments Market,By Type,2018 Vs. 2023 (USD Million)
Figure 8 Bioinformatics Market,By Type,2018 Vs. 2023 (USD Million)
Figure 9 Genotyping Market,By Technology,2018 Vs. 2023 (USD Million)
Figure 10 Pcr Market,By Type,2018 Vs. 2023 (USD Million)
Figure 11 Sequencing Market,By Type,2018 Vs. 2023 (USD Million)
Figure 12 Capillary Electrophoresis Market,By Type,2018 Vs. 2023 (USD Million)
Figure 13 Genotyping Market,By Application,2018 Vs. 2023 (USD Million)
Figure 14 Genotyping Market,By End User,2018 Vs. 2023 (USD Million)
Figure 15 Genotyping Market: Geographical Snapshot
Figure 16 Technological Advancements and Decreasing Prices of Dna Sequencing are Driving Market Growth
Figure 17 Reagents & Kits Commanded The Largest Share of The Market in 2017
Figure 18 The Us Accounted for The Largest Share of The Genotyping Market in 2017 46
Figure 19 Asia Pacific to Grow At The Highest Cagr in The Forecast Period
Figure 20 Developing Markets to Register Higher Growth During The Forecast Period
Figure 21 Comparative Analysis of Human Whole-Genome Sequencing Cost and Amount of Data Produced Per Genome (20012017) 50
Figure 22 Fda 510(K) Approval Process
Figure 23 Europe: Classification of Genotyping Products
Figure 24 Regulatory Process for Genotyping Products in Japan
Figure 25 India: Regulatory Process for Genotyping Products
Figure 26 Reagents & Kits Segment to Witness The Highest Growth During The Forecast Period (20182023)
Figure 27 Sequencers & Amplifiers Segment to Register The Highest Growth
In The Genotyping Instruments Market During The Forecast Period 67
Figure 28 Software Segment to Register The Highest Growth Rate in The Genotyping Bioinformatics Market During The Forecast Period
Figure 29 Sequencing Segment to Witness The Highest Growth During The Forecast Period (20182023)
Figure 30 Real-Time Pcr Segment Will Continue to Dominate The Market in 2023
Figure 31 Ngs Segment to Witness The Highest Growth During The Forecast Period
Figure 32 Aflp Segment to Witness The Highest Growth During The Forecast Period
Figure 33 Pharmacogenomics Segment to Witness The Highest Growth During The Forecast Period
Figure 34 Pharmaceutical & Biopharmaceutical Companies to Witness The Highest Growth Rate in The Genotyping Market During The Forecast Period
Figure 35 Geographical Snapshot: Markets in Asia Pacific are Emerging Hotspots
Figure 36 North America: Genotyping Market Snapshot
Figure 37 Europe: Genotyping Market Snapshot
Figure 38 Apac: Genotyping Market Snapshot
Figure 39 Key Developments of Major Players Between
January 2015 and March 2018 195
Figure 40 Genotyping Market Share Analysis,By Key Player,2017
Figure 41 Product Launches,Approvals,& Enhancements Was The Key Growth Strategy Adopted By Major Players Between 2015 & 2018
Figure 42 Illumina,Inc.: Company Snapshot (2017)
Figure 43 Thermo Fisher Scientific,Inc.: Company Snapshot (2017)
Figure 44 F. Hoffmann-La Roche Ltd.: Company Snapshot (2017)
Figure 45 Qiagen N.V.: Company Snapshot (2017)
Figure 46 Danaher Corporation: Company Snapshot (2017)
Figure 47 Agilent Technologies: Company Snapshot (2017)
Figure 48 Fluidigm Corporation: Company Snapshot (2017)
Figure 49 Ge Healthcare: Company Snapshot (2017)
Figure 50 Perkinelmer,Inc.: Company Snapshot (2017)
Figure 51 Bio-Rad Laboratories: Company Snapshot (2017)
Figure 52 Eurofins Scientific: Company Snapshot (2017)
Figure 53 Pacific Biosciences of California,Inc.: Company Snapshot (2017)
Growth opportunities and latent adjacency in Genotyping Assay Market