Antimicrobial Resistance Surveillance Market by Solution (Kits, System, Surveillance Software, Service), Application (Clinical Diagnostics, Public Health Surveillance), End User (Hospitals, Clinics, Academic, Research Institutes) & Region - Global Forecast to 2028
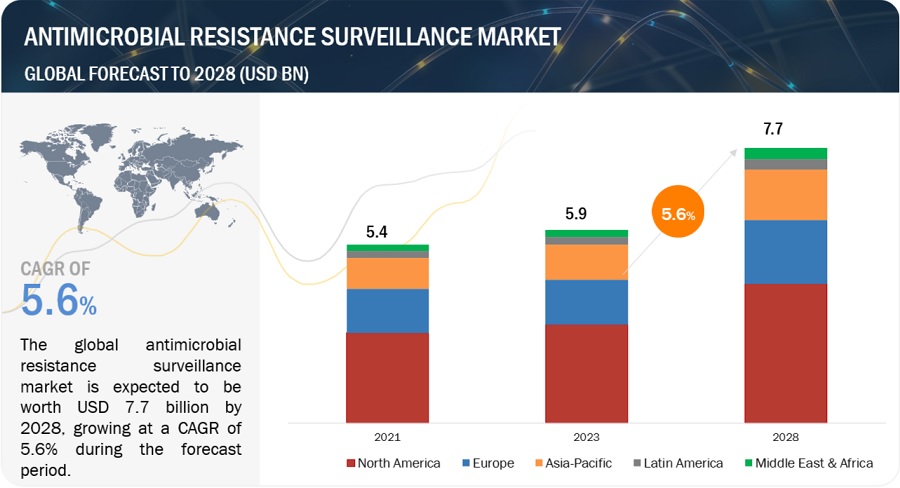
The global antimicrobial resistance (AMR) surveillance market, valued at US$5.4 billion in 2021, stood at US$5.9 billion in 2023 and is projected to advance at a resilient CAGR of 5.6% from 2023 to 2028, culminating in a forecasted valuation of US$7.7 billion by the end of the period. Key drivers include the rising prevalence of infections caused by drug-resistant pathogens such as MRSA, VRE, MDR-TB, and CRE. Innovations in diagnostics and government efforts to combat AMR further fuel market growth. Despite these drivers, high costs of diagnostic systems and complex regulatory frameworks present challenges. Emerging economies, especially in Asia-Pacific and Latin America, offer significant growth opportunities. The market includes solutions like diagnostic kits, systems, software, and services, with hospitals and clinics being the primary users. Key players include Luminex, Thermo Fisher Scientific, Cepheid, and Roche Diagnostics. North America dominates the market due to advanced healthcare infrastructure and high AMR prevalence.
Global Antimicrobial Resistance Surveillance Market Trends
To know about the assumptions considered for the study, Request for Free Sample Report
Antimicrobial Resistance Surveillance Market Dynamics
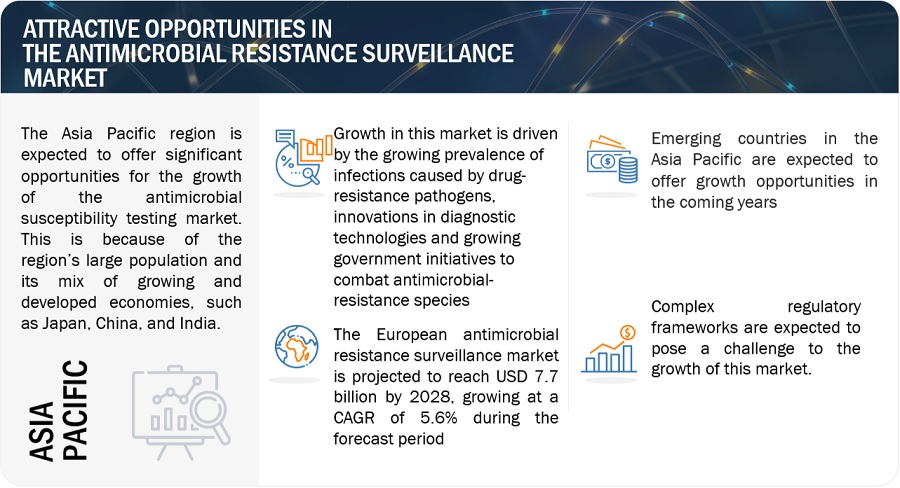
Driver: Growing prevalence of infections caused by drug-resistance pathogens
According to a published article by NCBI, within India, the incidence of VRE infections is on the rise, fluctuating between 1% and 8.7%. Our own investigation further demonstrates an escalating VRE infection rate in the bloodstream, climbing from 6.12% in 2018 to 19.2% in 2020. The growing number of epidemic outbreaks caused by drug-resistance pathogens, such as methicillin-resistant Staphylococcus aureus (MRSA), vancomycin-resistant Enterococcus (VRE), multi-drug-resistant Mycobacterium tuberculosis (MDR-TB), and carbapenem-resistant Enterobacteriaceae (CRE) gut bacteria is also propelling the demand for antimicrobial resistance surveillance solutions.
Restraint: High cost of antimicrobial resistance diagnostic systems/ kits
Antimicrobial resistance (AMR) exerts a substantial toll on economies. Beyond its human toll of mortality and disability, the protracted illnesses it causes lead to extended hospitalizations, heightened reliance on costlier pharmaceuticals, and financial hardships for affected individuals. Moreover, the pricing of AMR kits and instruments is positioned at a premium level. According to the NorthShore University Health System, the cost of reagents (at a volume of 29,200 tests per year) using automated systems is USD 165,856 per year as opposed to USD 43,508 per year using the disk diffusion method. Furthermore, the use of automated systems results in additional spending of USD 90,668 per year than that required for the semi-automated disk diffusion method.
Academic research laboratories generally cannot afford such systems as they have limited budgets. In addition, the maintenance costs and several other indirect expenses result in an overall increase in the total cost of ownership of these instruments. These factors hinder the mass adoption of antimicrobial resistance surveillance systems.
Opportunity: Growth opportunities in emerging economies
Emerging economies are expected to become a focal point for the growth of the ARS market. The Asia Pacific, Middle Eastern, and Latin American regions are relatively untapped markets for companies as compared to Europe and North America. Russia, India, China, Brazil, and South Africa are significant contributors to antibiotic adoption, accounting for 76% of the increase in antibiotic usage. The changes in antibiotic usage over the last decade have been exceptional, and this is mostly due to the advent of new illnesses. ~USD 3.3 million through the Russian Federation-funded FAO initiative was provided in 2019-20 for assisting national authorities in Armenia, Belarus, Kazakhstan, Kyrgyzstan, and Tajikistan in addressing the dangers presented by antibiotic-resistant microbes in agriculture and food systems.
Challenge: Complex Regulatory Frameworks
Among the major challenges faced by the antimicrobial resistance surveillance market is the time lag between establishing clinical breakpoints, approval of new antimicrobial agents, and the inclusion of these agents in antimicrobial susceptibility testing. Clinical breakpoints are defined as the concentration of an antibiotic that enables the interpretation of AST to define isolates as susceptible, intermediate, or resistant, thereby predicting the efficacy of an antimicrobial drug in treating a clinical disease. The FDA establishes these breakpoints when drug manufacturers submit individual new drug applications or when device manufacturers submit requests to revise the breakpoints.
Antimicrobial Resistance Surveillance Market Ecosystem Map
In 2023, the diagnostic kits segment is projected to account for the largest share of the antimicrobial resistance surveillance industry
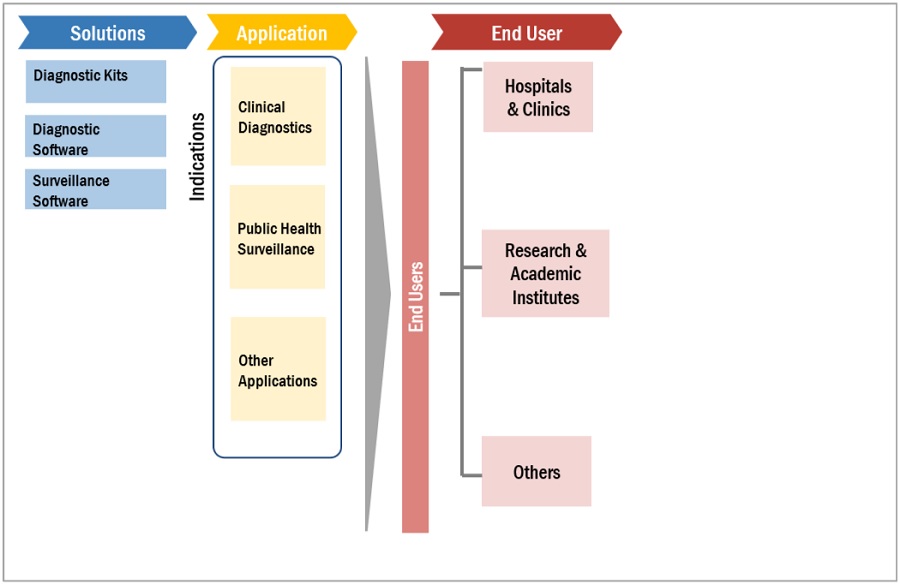
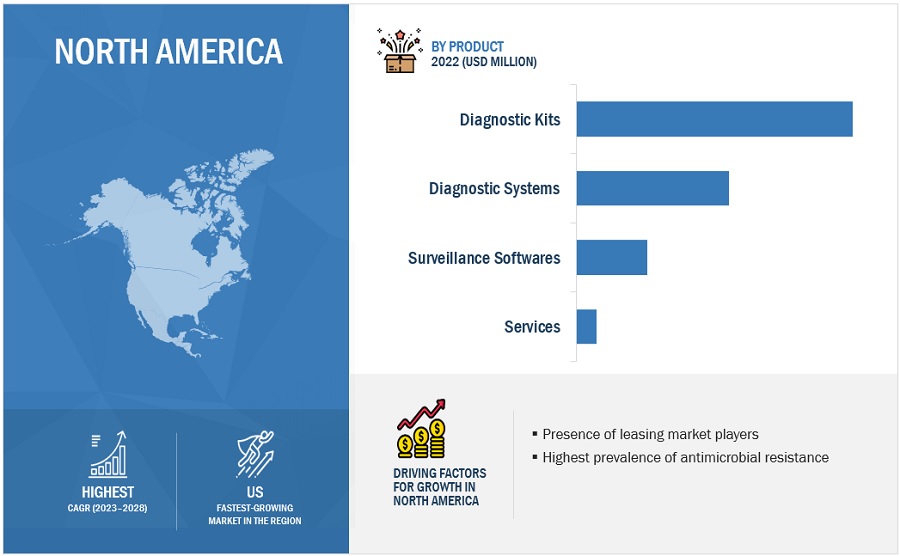
By solutions, the global antimicrobial resistance surveillance market has been segmented into diagnostic kits, diagnostic systems, surveillance software, and services. In 2023, the diagnostic kits segment is estimated to command the largest share of the global antimicrobial resistance surveillance market. The large share of this segment can primarily be attributed to the increasing demand for rapid and accurate diagnostics for antimicrobial resistance. Diagnostic kits are used to detect the presence of antimicrobial-resistant bacteria in clinical samples, such as blood, urine, and respiratory secretions.
Clinical Diagnostics is projected to account for the largest share of the antimicrobial resistance surveillance industry in 2023
By application, the global antimicrobial resistance surveillance market has been segmented into clinical diagnostics, public health surveillance, and other applications . In 2023, the clinical diagnostics segment is expected to command the largest share of the global antimicrobial resistance surveillance market. The growth in this segment can be attributed to factors such as increasing prevalence of antimicrobial resistance, need to improve patient outcomes, used to determine the susceptibility of bacteria to different antimicrobial agents and this information is essential for healthcare providers to make informed decisions about the treatment of patients with antimicrobial-resistant infections.
By end user, hospitals and clinics accounted for the largest share of the antimicrobial resistance surveillance industry
By end users, the global antimicrobial resistance surveillance market has been segmented into hospitals & clinics, research and academic institutes, and others. In 2023, the hospitals & clinics segment is expected to command the largest share of the global antimicrobial resistance surveillance market.The large share of this segment can be attributed to the fact that because they are the primary settings where antimicrobial-resistant infections occur and they are required to conduct antimicrobial resistance surveillance.
By region, North America is projected to account for the largest share of the antimicrobial resistance surveillance industry
By region the global antimicrobial resistance surveillance segmented into—North America, Europe, Asia Pacific, Latin America, and Middle East Africa. In 2023, North American antimicrobial resistance surveillance market is expected to account for the largest share of the global antimicrobial resistance surveillance market. This can be attributed to the presence of leading market players, highest prevalence of antimicrobial resistance, and strong regulatory environment.
To know about the assumptions considered for the study, download the pdf brochure
The prominent players in this market are Luminex Corporation (US), Thermo Fisher Scientific (US), BioSpace (US), Cepheid (US), Accelerate Diagnostics, Inc. (US), Liofilchem S.r.l. (Italy), Becton, Dickinson and Company (US), Biomerieux (France), Bruker (US), Danaher (US), Merck KgaA (Germany), Bio-Rad (US), Qiagen (Germany), Abbott Laboratories (US), Roche Diagnostics (Switzerland), OpGen, Inc. (US), Wolters Kluwer N.V. (US), Lumed (US), Alifax S.r.l. (Italy), and Bioanalyse (Turkey).
Scope of the Antimicrobial Resistance Surveillance Industry:
|
Report Metric |
Details |
|
Market Revenue in 2023 |
$5.9 billion |
|
Estimated Value by 2028 |
$7.7 billion |
|
Revenue Rate |
Poised to grow at a CAGR of 5.6% |
|
Market Driver |
Growing prevalence of infections caused by drug-resistance pathogens |
|
Market Opportunity |
Growth opportunities in emerging economies |
The study categories the antimicrobial resistance surveillance Market to forecast revenue and analyze trends in each of the following submarkets:
By Solution
- Diagnostic kits
- Diagnostic systems
- Surveillance software
- Services
By Application
- Clinical Diagnostics
- Public Health Surveillance
- Other Applications
By End User
- Hospitals & Clinics
- Research & Academic Institutes
- Others
By Region
-
North America
- US
- Canada
-
Europe
- France
- Spain
- UK
- Italy
- Germany
- Rest of Europe
-
Asia Pacific
- China
- India
- Japan
- Rest of APAC
-
Latin America
- Brazil
- Mexico
- Rest of Latin America
- Middle East & Africa
Frequently Asked Questions (FAQ):
What is the projected market revenue value of the global antimicrobial resistance surveillance market?
The global antimicrobial resistance surveillance market boasts a total revenue value of $7.7 billion by 2028.
What is the estimated growth rate (CAGR) of the global antimicrobial resistance surveillance market?
The global antimicrobial resistance surveillance market has an estimated compound annual growth rate (CAGR) of 5.6% and a revenue size in the region of $5.9 billion in 2023.
To speak to our analyst for a discussion on the above findings, click Speak to Analyst


-
5.1 INTRODUCTIONDRIVERS- Growing prevalence of infections caused by drug-resistant pathogens- Innovations in diagnostic technologies- Growing government initiatives to combat antimicrobial-resistant species- Emergence of multi-drug resistance due to drug abuseRESTRAINTS- High cost of antimicrobial resistance diagnostic systems/kitsOPPORTUNITIES- Growth opportunities in emerging economies- Awareness initiatives for antimicrobial resistance and controlCHALLENGES- Complex regulatory frameworks
-
5.2 TECHNOLOGY ANALYSISREAL-TIME SURVEILLANCE PLATFORMSCRISPR-CAS SYSTEMSAI-POWERED MOBILE APPLICATIONS
-
5.3 PRICING ANALYSISAVERAGE SELLING PRICE TREND OF PRODUCTS OFFERED BY KEY PLAYERSAVERAGE SELLING PRICE TREND, BY REGION
- 5.4 VALUE CHAIN ANALYSIS
- 5.5 SUPPLY CHAIN ANALYSIS
-
5.6 ECOSYSTEM ANALYSIS
-
5.7 PORTER’S FIVE FORCES ANALYSISTHREAT OF NEW ENTRANTSTHREAT OF SUBSTITUTESBARGAINING POWER OF BUYERSBARGAINING POWER OF SUPPLIERSINTENSITY OF COMPETITIVE RIVALRY
-
5.8 TARIFF AND REGULATORY ANALYSISTARIFF FOR ANTIMICROBIAL RESISTANCE SURVEILLANCE DIAGNOSTIC SYSTEMSREGULATORY ANALYSIS- North America- Europe- Asia Pacific
-
5.9 PATENT ANALYSISPATENT PUBLICATION TRENDS FOR ANTIMICROBIAL RESISTANCE SURVEILLANCE PRODUCTSINSIGHTS: JURISDICTION AND TOP APPLICANT ANALYSIS
- 5.10 KEY CONFERENCES & EVENTS IN 2023–2024
-
5.11 TRADE ANALYSISTRADE ANALYSIS FOR ANTIMICROBIAL RESISTANCE SURVEILLANCE DIAGNOSTIC SYSTEMS
-
5.12 KEY STAKEHOLDERS & BUYING CRITERIAKEY STAKEHOLDERS IN BUYING PROCESSBUYING CRITERIA
- 6.1 INTRODUCTION
-
6.2 DIAGNOSTIC KITSRISING AWARENESS OF AMR TO DRIVE MARKET GROWTH
-
6.3 DIAGNOSTIC SYSTEMSGROWING THREAT OF ANTIBIOTIC RESISTANCE TO ACCELERATE MARKET GROWTH
-
6.4 SURVEILLANCE & ANALYTICS SOFTWARETECHNOLOGICAL ADVANCEMENTS TO SUPPORT MARKET GROWTH
- 6.5 OTHER SOLUTIONS
- 7.1 INTRODUCTION
-
7.2 CLINICAL DIAGNOSTICSTECHNOLOGICAL ADVANCEMENTS TO DRIVE MARKET GROWTH
-
7.3 PUBLIC HEALTH SURVEILLANCEGOVERNMENT INITIATIVES TO ACCELERATE MARKET GROWTH
- 7.4 OTHER APPLICATIONS
- 8.1 INTRODUCTION
-
8.2 HOSPITALS & CLINICSHIGH PREVALENCE OF INFECTIOUS DISEASES TO DRIVE MARKET GROWTH
-
8.3 RESEARCH & ACADEMIC INSTITUTESGROWING RESEARCH GRANTS AND FUNDING TO ACCELERATE MARKET GROWTH
- 8.4 OTHER END USERS
- 9.1 INTRODUCTION
-
9.2 NORTH AMERICAUS- US to dominate North American market during forecast periodCANADA- Favorable government initiatives to drive growth during forecast periodNORTH AMERICA: RECESSION IMPACT
-
9.3 EUROPEGERMANY- Germany to dominate European market during forecast periodUK- Significant prevalence of infectious diseases coupled with increasing awareness to drive market growthFRANCE- Supportive government policies and easy accessibility to healthcare services to fuel growthITALY- Increasing R&D investments by pharmaceutical companies to propel demandSPAIN- Rising geriatric population to drive market growthREST OF EUROPEEUROPE: RECESSION IMPACT
-
9.4 ASIA PACIFICJAPAN- Growing geriatric population to drive marketCHINA- Favorable government regulations and heavy burden of infectious diseases to drive market growthINDIA- Growing initiatives for clinical diagnosis by government and major players to drive market growthREST OF ASIA PACIFICASIA PACIFIC: RECESSION IMPACT
-
9.5 LATIN AMERICAGROWING ECONOMIC DEVELOPMENT TO DRIVE MARKET GROWTHLATIN AMERICA: RECESSION IMPACT
-
9.6 MIDDLE EAST & AFRICAGROWING INCIDENCE OF INFECTIOUS DISEASES AND LARGE PATIENT POOL TO DRIVE MARKET GROWTHMIDDLE EAST & AFRICA: RECESSION IMPACT

- 10.1 INTRODUCTION
- 10.2 STRATEGIES ADOPTED BY KEY PLAYERS
- 10.3 REVENUE SHARE ANALYSIS
- 10.4 MARKET SHARE ANALYSIS
-
10.5 COMPANY EVALUATION MATRIX FOR MAJOR PLAYERS (2022)STARSEMERGING LEADERSPERVASIVE PLAYERSPARTICIPANTSCOMPANY FOOTPRINT
-
10.6 COMPANY EVALUATION MATRIX FOR START-UPS/SMES (2022)PROGRESSIVE COMPANIESRESPONSIVE COMPANIESDYNAMIC COMPANIESSTARTING BLOCKSCOMPETITIVE BENCHMARKING
-
10.7 COMPETITIVE SCENARIOPRODUCT LAUNCHESDEALS
-
11.1 KEY PLAYERSBIOMÉRIEUX SA- Business overview- Products offered- Recent developments- MnM viewTHERMO FISHER SCIENTIFIC INC.- Business overview- Products offered- Recent developments- MnM viewBECTON, DICKINSON AND COMPANY- Business overview- Products offered- Recent developments- MnM viewDANAHER CORPORATION- Business overview- Products offered- Recent developments- MnM viewBIO-RAD LABORATORIES, INC.- Business overview- Products offered- Recent developments- MnM viewLUMINEX CORPORATION- Business overview- Products offered- Recent developmentsBRUKER CORPORATION- Business overview- Products offered- Recent developmentsROCHE DIAGNOSTICS (A DIVISION OF F-HOFFMAN-LA ROCHE LTD.)- Business overview- Products offered- Recent developmentsT2 BIOSYSTEMS, INC.- Business overview- Products offered- Recent developmentsMERCK KGAA- Business overview- Products offered- Recent developmentsACCELERATE DIAGNOSTICS, INC.- Business overview- Products offered- Recent developmentsBIOANALYSE- Business overview- Products offeredHIMEDIA LABORATORIES- Business overview- Products offered- Recent developmentsLIOFILCHEM S.R.L.- Business overview- Products offered- Recent developmentsALIFAX S.R.L.- Business overview- Products offered- Recent developmentsWOLTERS KLUWER N.V.- Business overview- Products offeredOPGEN, INC.- Business overview- Products offered- Recent developmentsCREATIVE DIAGNOSTICS- Business overview- Products offeredSYNBIOSIS- Business overview- Products offered
-
11.2 OTHER PLAYERSZHUHAI DL BIOTECH CO., LTD.ELITECHGROUPMAST GROUP LTD.CONDALABGENEFLUIDICS, INC.MP BIOMEDICALS
- 12.1 DISCUSSION GUIDE
- 12.2 KNOWLEDGESTORE: MARKETSANDMARKETS’ SUBSCRIPTION PORTAL
- 12.3 CUSTOMIZATION OPTIONS
- 12.4 RELATED REPORTS
- 12.5 AUTHOR DETAILS
- TABLE 1 STANDARD CURRENCY CONVERSION RATES
- TABLE 2 RISK ASSESSMENT: ANTIMICROBIAL RESISTANCE SURVEILLANCE MARKET
- TABLE 3 AVERAGE SELLING PRICE TREND OF PRODUCTS OFFERED BY KEY PLAYERS
- TABLE 4 AVERAGE SELLING PRICE OF ANTIMICROBIAL RESISTANCE SURVEILLANCE SOLUTIONS, BY REGION
- TABLE 5 ANTIMICROBIAL RESISTANCE SURVEILLANCE MARKET: PORTER’S FIVE FORCES ANALYSIS
- TABLE 6 REGULATORY BODIES, GOVERNMENT AGENCIES, AND OTHER ORGANIZATIONS
- TABLE 7 US FDA: MEDICAL DEVICE CLASSIFICATION
- TABLE 8 US: TIME, COST, AND COMPLEXITY OF REGISTRATION
- TABLE 9 CANADA: MEDICAL DEVICE CLASSIFICATION
- TABLE 10 CANADA: TIME, COST, AND COMPLEXITY OF REGISTRATION
- TABLE 11 CHINA: MEDICAL DEVICE CLASSIFICATION
- TABLE 12 ANTIMICROBIAL RESISTANCE SURVEILLANCE MARKET: LIST OF PATENTS (2020–2023)
- TABLE 13 ANTIMICROBIAL RESISTANCE SURVEILLANCE MARKET: DETAILED LIST OF CONFERENCES & EVENTS IN 2023–2024
- TABLE 14 INFLUENCE OF STAKEHOLDERS ON BUYING PROCESS OF ANTIMICROBIAL RESISTANCE SURVEILLANCE END USERS (%)
- TABLE 15 KEY BUYING CRITERIA FOR ANTIMICROBIAL RESISTANCE SURVEILLANCE END USERS
- TABLE 16 ANTIMICROBIAL RESISTANCE SURVEILLANCE MARKET, BY SOLUTION, 2021–2028 (USD MILLION)
- TABLE 17 DIAGNOSTIC KITS OFFERED BY KEY PLAYERS
- TABLE 18 ANTIMICROBIAL RESISTANCE SURVEILLANCE MARKET FOR DIAGNOSTIC KITS, BY COUNTRY, 2021–2028 (USD MILLION)
- TABLE 19 DIAGNOSTIC SYSTEMS OFFERED BY KEY PLAYERS
- TABLE 20 ANTIMICROBIAL RESISTANCE SURVEILLANCE MARKET FOR DIAGNOSTIC SYSTEMS, BY COUNTRY, 2021–2028 (USD MILLION)
- TABLE 21 SURVEILLANCE & ANALYTICS SOFTWARE OFFERED BY KEY PLAYERS
- TABLE 22 ANTIMICROBIAL RESISTANCE SURVEILLANCE MARKET FOR SURVEILLANCE & ANALYTICS SOFTWARE, BY COUNTRY, 2021–2028 (USD MILLION)
- TABLE 23 ANTIMICROBIAL RESISTANCE SURVEILLANCE MARKET FOR OTHER SOLUTIONS, BY COUNTRY, 2021–2028 (USD MILLION)
- TABLE 24 ANTIMICROBIAL RESISTANCE SURVEILLANCE MARKET, BY APPLICATION, 2021–2028 (USD MILLION)
- TABLE 25 ANTIMICROBIAL RESISTANCE SURVEILLANCE MARKET FOR CLINICAL DIAGNOSTICS, BY COUNTRY, 2021–2028 (USD MILLION)
- TABLE 26 ANTIMICROBIAL RESISTANCE SURVEILLANCE MARKET FOR PUBLIC HEALTH SURVEILLANCE, BY COUNTRY, 2021–2028 (USD MILLION)
- TABLE 27 ANTIMICROBIAL RESISTANCE SURVEILLANCE MARKET FOR OTHER APPLICATIONS, BY COUNTRY, 2021–2028 (USD MILLION)
- TABLE 28 ANTIMICROBIAL RESISTANCE SURVEILLANCE MARKET, BY END USER, 2021–2028 (USD MILLION)
- TABLE 29 ANTIMICROBIAL RESISTANCE SURVEILLANCE MARKET FOR HOSPITALS & CLINICS, BY COUNTRY, 2021–2028 (USD MILLION)
- TABLE 30 FUNDING BY DEPARTMENT OF HEALTH AND SOCIAL CARE (UK) FOR ANTIMICROBIAL RESISTANCE STUDIES, 2020
- TABLE 31 ANTIMICROBIAL RESISTANCE SURVEILLANCE MARKET FOR RESEARCH & ACADEMIC INSTITUTES, BY COUNTRY, 2021–2028 (USD MILLION)
- TABLE 32 ANTIMICROBIAL RESISTANCE SURVEILLANCE MARKET FOR OTHER END USERS, BY COUNTRY, 2021–2028 (USD MILLION)
- TABLE 33 ANTIMICROBIAL RESISTANCE SURVEILLANCE MARKET, BY REGION, 2021–2028 (USD MILLION)
- TABLE 34 NORTH AMERICA: ANTIMICROBIAL RESISTANCE SURVEILLANCE MARKET, BY COUNTRY, 2021–2028 (USD MILLION)
- TABLE 35 NORTH AMERICA: ANTIMICROBIAL RESISTANCE SURVEILLANCE MARKET, BY SOLUTION, 2021–2028 (USD MILLION)
- TABLE 36 NORTH AMERICA: ANTIMICROBIAL RESISTANCE SURVEILLANCE MARKET, BY APPLICATION, 2021–2028 (USD MILLION)
- TABLE 37 NORTH AMERICA: ANTIMICROBIAL RESISTANCE SURVEILLANCE MARKET, BY END USER, 2021–2028 (USD MILLION)
- TABLE 38 US: ANTIMICROBIAL RESISTANCE SURVEILLANCE MARKET, BY SOLUTION, 2021–2028 (USD MILLION)
- TABLE 39 US: ANTIMICROBIAL RESISTANCE SURVEILLANCE MARKET, BY APPLICATION, 2021–2028 (USD MILLION)
- TABLE 40 US: ANTIMICROBIAL RESISTANCE SURVEILLANCE MARKET, BY END USER, 2021–2028 (USD MILLION)
- TABLE 41 CANADA: ANTIMICROBIAL RESISTANCE SURVEILLANCE MARKET, BY SOLUTION, 2021–2028 (USD MILLION)
- TABLE 42 CANADA: ANTIMICROBIAL RESISTANCE SURVEILLANCE MARKET, BY APPLICATION, 2021–2028 (USD MILLION)
- TABLE 43 CANADA: ANTIMICROBIAL RESISTANCE SURVEILLANCE MARKET, BY END USER, 2021–2028 (USD MILLION)
- TABLE 44 EUROPE: ANTIMICROBIAL RESISTANCE SURVEILLANCE MARKET, BY COUNTRY, 2021–2028 (USD MILLION)
- TABLE 45 EUROPE: ANTIMICROBIAL RESISTANCE SURVEILLANCE MARKET, BY SOLUTION, 2021–2028 (USD MILLION)
- TABLE 46 EUROPE: ANTIMICROBIAL RESISTANCE SURVEILLANCE MARKET, BY APPLICATION, 2021–2028 (USD MILLION)
- TABLE 47 EUROPE: ANTIMICROBIAL RESISTANCE SURVEILLANCE MARKET, BY END USER, 2021–2028 (USD MILLION)
- TABLE 48 GERMANY: ANTIMICROBIAL RESISTANCE SURVEILLANCE MARKET, BY SOLUTION, 2021–2028 (USD MILLION)
- TABLE 49 GERMANY: ANTIMICROBIAL RESISTANCE SURVEILLANCE MARKET, BY APPLICATION, 2021–2028 (USD MILLION)
- TABLE 50 GERMANY: ANTIMICROBIAL RESISTANCE SURVEILLANCE MARKET, BY END USER, 2021–2028 (USD MILLION)
- TABLE 51 UK: ANTIMICROBIAL RESISTANCE SURVEILLANCE MARKET, BY SOLUTION, 2021–2028 (USD MILLION)
- TABLE 52 UK: ANTIMICROBIAL RESISTANCE SURVEILLANCE MARKET, BY APPLICATION, 2021–2028 (USD MILLION)
- TABLE 53 UK: ANTIMICROBIAL RESISTANCE SURVEILLANCE MARKET, BY END USER, 2021–2028 (USD MILLION)
- TABLE 54 FRANCE: ANTIMICROBIAL RESISTANCE SURVEILLANCE MARKET, BY SOLUTION, 2021–2028 (USD MILLION)
- TABLE 55 FRANCE: ANTIMICROBIAL RESISTANCE SURVEILLANCE MARKET, BY APPLICATION, 2021–2028 (USD MILLION)
- TABLE 56 FRANCE: ANTIMICROBIAL RESISTANCE SURVEILLANCE MARKET, BY END USER, 2021–2028 (USD MILLION)
- TABLE 57 ITALY: ANTIMICROBIAL RESISTANCE SURVEILLANCE MARKET, BY SOLUTION, 2021–2028 (USD MILLION)
- TABLE 58 ITALY: ANTIMICROBIAL RESISTANCE SURVEILLANCE MARKET, BY APPLICATION, 2021–2028 (USD MILLION)
- TABLE 59 ITALY: ANTIMICROBIAL RESISTANCE SURVEILLANCE MARKET, BY END USER, 2021–2028 (USD MILLION)
- TABLE 60 SPAIN: ANTIMICROBIAL RESISTANCE SURVEILLANCE MARKET, BY SOLUTION, 2021–2028 (USD MILLION)
- TABLE 61 SPAIN: ANTIMICROBIAL RESISTANCE SURVEILLANCE MARKET, BY APPLICATION, 2021–2028 (USD MILLION)
- TABLE 62 SPAIN: ANTIMICROBIAL RESISTANCE SURVEILLANCE MARKET, BY END USER, 2021–2028 (USD MILLION)
- TABLE 63 REST OF EUROPE: ANTIMICROBIAL RESISTANCE SURVEILLANCE MARKET, BY SOLUTION, 2021–2028 (USD MILLION)
- TABLE 64 REST OF EUROPE: ANTIMICROBIAL RESISTANCE SURVEILLANCE MARKET, BY APPLICATION, 2021–2028 (USD MILLION)
- TABLE 65 REST OF EUROPE: ANTIMICROBIAL RESISTANCE SURVEILLANCE MARKET, BY END USER, 2021–2028 (USD MILLION)
- TABLE 66 ASIA PACIFIC: ANTIMICROBIAL RESISTANCE SURVEILLANCE MARKET, BY COUNTRY, 2021–2028 (USD MILLION)
- TABLE 67 ASIA PACIFIC: ANTIMICROBIAL RESISTANCE SURVEILLANCE MARKET, BY SOLUTION, 2021–2028 (USD MILLION)
- TABLE 68 ASIA PACIFIC: ANTIMICROBIAL RESISTANCE SURVEILLANCE MARKET, BY APPLICATION, 2021–2028 (USD MILLION)
- TABLE 69 ASIA PACIFIC: ANTIMICROBIAL RESISTANCE SURVEILLANCE MARKET, BY END USER, 2021–2028 (USD MILLION)
- TABLE 70 JAPAN: ANTIMICROBIAL RESISTANCE SURVEILLANCE MARKET, BY SOLUTION, 2021–2028 (USD MILLION)
- TABLE 71 JAPAN: ANTIMICROBIAL RESISTANCE SURVEILLANCE MARKET, BY APPLICATION, 2021–2028 (USD MILLION)
- TABLE 72 JAPAN: ANTIMICROBIAL RESISTANCE SURVEILLANCE MARKET, BY END USER, 2021–2028 (USD MILLION)
- TABLE 73 INCIDENCE OF INFECTIOUS DISEASES IN CHINA, 2020
- TABLE 74 CHINA: ANTIMICROBIAL RESISTANCE SURVEILLANCE MARKET, BY SOLUTION, 2021–2028 (USD MILLION)
- TABLE 75 CHINA: ANTIMICROBIAL RESISTANCE SURVEILLANCE MARKET, BY APPLICATION, 2021–2028 (USD MILLION)
- TABLE 76 CHINA: ANTIMICROBIAL RESISTANCE SURVEILLANCE MARKET, BY END USER, 2021–2028 (USD MILLION)
- TABLE 77 INDIA: ANTIMICROBIAL RESISTANCE SURVEILLANCE MARKET, BY SOLUTION, 2021–2028 (USD MILLION)
- TABLE 78 INDIA: ANTIMICROBIAL RESISTANCE SURVEILLANCE MARKET, BY APPLICATION, 2021–2028 (USD MILLION)
- TABLE 79 INDIA: ANTIMICROBIAL RESISTANCE SURVEILLANCE MARKET, BY END USER, 2021–2028 (USD MILLION)
- TABLE 80 REST OF ASIA PACIFIC: ANTIMICROBIAL RESISTANCE SURVEILLANCE MARKET, BY SOLUTION, 2021–2028 (USD MILLION)
- TABLE 81 REST OF ASIA PACIFIC: ANTIMICROBIAL RESISTANCE SURVEILLANCE MARKET, BY APPLICATION, 2021–2028 (USD MILLION)
- TABLE 82 REST OF ASIA PACIFIC: ANTIMICROBIAL RESISTANCE SURVEILLANCE MARKET, BY END USER, 2021–2028 (USD MILLION)
- TABLE 83 LATIN AMERICA: ANTIMICROBIAL RESISTANCE SURVEILLANCE MARKET, BY SOLUTION, 2021–2028 (USD MILLION)
- TABLE 84 LATIN AMERICA: ANTIMICROBIAL RESISTANCE SURVEILLANCE MARKET, BY APPLICATION, 2021–2028 (USD MILLION)
- TABLE 85 LATIN AMERICA: ANTIMICROBIAL RESISTANCE SURVEILLANCE MARKET, BY END USER, 2021–2028 (USD MILLION)
- TABLE 86 MIDDLE EAST & AFRICA: ANTIMICROBIAL RESISTANCE SURVEILLANCE MARKET, BY SOLUTION, 2021–2028 (USD MILLION)
- TABLE 87 MIDDLE EAST & AFRICA: ANTIMICROBIAL RESISTANCE SURVEILLANCE MARKET, BY APPLICATION, 2021–2028 (USD MILLION)
- TABLE 88 MIDDLE EAST & AFRICA: ANTIMICROBIAL RESISTANCE SURVEILLANCE MARKET, BY END USER, 2021–2028 (USD MILLION)
- TABLE 89 OVERVIEW OF STRATEGIES ADOPTED BY KEY PLAYERS IN ANTIMICROBIAL RESISTANCE SURVEILLANCE MARKET
- TABLE 90 COMPANY FOOTPRINT ANALYSIS, BY SOLUTION
- TABLE 91 COMPANY FOOTPRINT ANALYSIS, BY APPLICATION
- TABLE 92 COMPANY FOOTPRINT ANALYSIS, BY END USER
- TABLE 93 COMPANY FOOTPRINT ANALYSIS, BY REGION
- TABLE 94 ANTIMICROBIAL RESISTANCE SURVEILLANCE MARKET: COMPANY FOOTPRINT OF KEY PLAYERS
- TABLE 95 ANTIMICROBIAL RESISTANCE SURVEILLANCE MARKET: PRODUCT LAUNCHES & APPROVALS, JANUARY 2020–SEPTEMBER 2023
- TABLE 96 ANTIMICROBIAL RESISTANCE SURVEILLANCE MARKET: DEALS, JANUARY 2020–SEPTEMBER 2023
- TABLE 97 BIOMÉRIEUX SA: BUSINESS OVERVIEW
- TABLE 98 THERMO FISHER SCIENTIFIC INC.: BUSINESS OVERVIEW
- TABLE 99 BECTON, DICKINSON AND COMPANY: BUSINESS OVERVIEW
- TABLE 100 DANAHER CORPORATION: BUSINESS OVERVIEW
- TABLE 101 BIO-RAD LABORATORIES, INC.: BUSINESS OVERVIEW
- TABLE 102 LUMINEX CORPORATION: BUSINESS OVERVIEW
- TABLE 103 BRUKER CORPORATION: BUSINESS OVERVIEW
- TABLE 104 ROCHE DIAGNOSTICS: BUSINESS OVERVIEW
- TABLE 105 T2 BIOSYSTEMS, INC.: BUSINESS OVERVIEW
- TABLE 106 MERCK KGAA: BUSINESS OVERVIEW
- TABLE 107 ACCELERATE DIAGNOSTICS, INC.: BUSINESS OVERVIEW
- TABLE 108 BIOANALYSE: BUSINESS OVERVIEW
- TABLE 109 HIMEDIA LABORATORIES: BUSINESS OVERVIEW
- TABLE 110 LIOFILCHEM S.R.L.: BUSINESS OVERVIEW
- TABLE 111 ALIFAX S.R.L.: BUSINESS OVERVIEW
- TABLE 112 WOLTERS KLUWER N.V.: BUSINESS OVERVIEW
- TABLE 113 OPGEN, INC.: BUSINESS OVERVIEW
- TABLE 114 CREATIVE DIAGNOSTICS: BUSINESS OVERVIEW
- TABLE 115 SYNBIOSIS: BUSINESS OVERVIEW
- FIGURE 1 RESEARCH DESIGN
- FIGURE 2 PRIMARY SOURCES
- FIGURE 3 BREAKDOWN OF PRIMARY INTERVIEWS: BY COMPANY TYPE, DESIGNATION, AND REGION
- FIGURE 4 MARKET SIZE ESTIMATION: REVENUE SHARE ANALYSIS
- FIGURE 5 BOTTOM-UP APPROACH
- FIGURE 6 CAGR PROJECTIONS FROM ANALYSIS OF DRIVERS, RESTRAINTS, OPPORTUNITIES, AND CHALLENGES IN ANTIMICROBIAL RESISTANCE SURVEILLANCE MARKET (2023–2028)
- FIGURE 7 CAGR PROJECTIONS: SUPPLY-SIDE ANALYSIS
- FIGURE 8 MARKET DATA TRIANGULATION METHODOLOGY
- FIGURE 9 ANTIMICROBIAL RESISTANCE SURVEILLANCE MARKET, BY SOLUTION, 2023 VS. 2028 (USD MILLION)
- FIGURE 10 ANTIMICROBIAL RESISTANCE SURVEILLANCE MARKET, BY APPLICATION, 2023 VS. 2028 (USD MILLION)
- FIGURE 11 ANTIMICROBIAL RESISTANCE SURVEILLANCE MARKET, BY END USER, 2023 VS. 2028 (USD MILLION)
- FIGURE 12 GEOGRAPHICAL SNAPSHOT OF ANTIMICROBIAL RESISTANCE SURVEILLANCE MARKET
- FIGURE 13 GROWING PREVALENCE OF INFECTIONS CAUSED BY DRUG-RESISTANT PATHOGENS TO DRIVE MARKET GROWTH
- FIGURE 14 ASIA PACIFIC TO REGISTER HIGHEST GROWTH RATE DURING FORECAST PERIOD (2023–2028)
- FIGURE 15 CLINICAL DIAGNOSTICS SEGMENT ACCOUNTED FOR LARGEST SHARE OF ASIA PACIFIC ANTIMICROBIAL RESISTANCE SURVEILLANCE MARKET IN 2022
- FIGURE 16 CHINA TO REGISTER HIGHEST CAGR DURING FORECAST PERIOD
- FIGURE 17 EMERGING ECONOMIES TO REGISTER HIGHER GROWTH RATES DURING FORECAST PERIOD
- FIGURE 18 ANTIMICROBIAL RESISTANCE SURVEILLANCE MARKET: DRIVERS, RESTRAINTS, OPPORTUNITIES, AND CHALLENGES
- FIGURE 19 AVERAGE SELLING PRICE TREND OF PRODUCTS OFFERED BY KEY PLAYERS
- FIGURE 20 ANTIMICROBIAL RESISTANCE SURVEILLANCE MARKET: VALUE CHAIN ANALYSIS
- FIGURE 21 ANTIMICROBIAL RESISTANCE SURVEILLANCE MARKET: SUPPLY CHAIN ANALYSIS
- FIGURE 22 ANTIMICROBIAL RESISTANCE SURVEILLANCE MARKET: ECOSYSTEM MARKET MAP
- FIGURE 23 PATENT PUBLICATION TRENDS (JANUARY 2011–AUGUST 2023)
- FIGURE 24 TOP APPLICANTS (COMPANIES/INSTITUTIONS) FOR ANTIMICROBIAL RESISTANCE SURVEILLANCE PATENTS (JANUARY 2011–AUGUST 2023)
- FIGURE 25 TOP APPLICANTS FOR ANTIMICROBIAL RESISTANCE SURVEILLANCE PATENTS (COUNTRY/REGION) (JANUARY 2011–AUGUST 2023)
- FIGURE 26 IMPORTS OF PRODUCTS UNDER HSN CODE: 90278090, BY COUNTRY, 2022 (USD THOUSAND)
- FIGURE 27 EXPORTS OF PRODUCTS UNDER HSN CODE: 90278090, BY COUNTRY, 2022 (USD THOUSAND)
- FIGURE 28 INFLUENCE OF STAKEHOLDERS ON BUYING PROCESS OF ANTIMICROBIAL RESISTANCE SURVEILLANCE END USERS
- FIGURE 29 KEY BUYING CRITERIA FOR ANTIMICROBIAL RESISTANCE SURVEILLANCE END USERS
- FIGURE 30 NORTH AMERICA: ANTIMICROBIAL RESISTANCE SURVEILLANCE MARKET SNAPSHOT
- FIGURE 31 ASIA PACIFIC: ANTIMICROBIAL RESISTANCE SURVEILLANCE MARKET SNAPSHOT
- FIGURE 32 REVENUE ANALYSIS OF TOP PLAYERS IN ANTIMICROBIAL RESISTANCE SURVEILLANCE MARKET (2018–2022)
- FIGURE 33 MARKET SHARE ANALYSIS OF TOP PLAYERS IN ANTIMICROBIAL RESISTANCE SURVEILLANCE MARKET (2022)
- FIGURE 34 ANTIMICROBIAL RESISTANCE SURVEILLANCE MARKET: COMPANY EVALUATION MATRIX FOR KEY PLAYERS, 2022
- FIGURE 35 ANTIMICROBIAL RESISTANCE SURVEILLANCE MARKET: COMPANY EVALUATION MATRIX FOR SMES/START-UPS, 2022
- FIGURE 36 BIOMÉRIEUX SA: COMPANY SNAPSHOT (2022)
- FIGURE 37 THERMO FISHER SCIENTIFIC INC.: COMPANY SNAPSHOT (2022)
- FIGURE 38 BECTON, DICKINSON AND COMPANY: COMPANY SNAPSHOT (2022)
- FIGURE 39 DANAHER CORPORATION: COMPANY SNAPSHOT (2022)
- FIGURE 40 BIO-RAD LABORATORIES, INC.: COMPANY SNAPSHOT (2022)
- FIGURE 41 LUMINEX CORPORATION: COMPANY SNAPSHOT (2022)
- FIGURE 42 BRUKER CORPORATION: COMPANY SNAPSHOT (2022)
- FIGURE 43 ROCHE DIAGNOSTICS: COMPANY SNAPSHOT (2022)
- FIGURE 44 T2 BIOSYSTEMS, INC.: COMPANY SNAPSHOT (2022)
- FIGURE 45 MERCK KGAA: COMPANY SNAPSHOT (2022)
- FIGURE 46 ACCELERATE DIAGNOSTICS, INC.: COMPANY SNAPSHOT (2022)
- FIGURE 47 WOLTERS KLUWER N.V.: COMPANY SNAPSHOT (2022)
- FIGURE 48 OPGEN, INC.: COMPANY SNAPSHOT (2022)
This study involved the extensive use of both primary and secondary sources. The research process involved the study of various factors affecting the industry to identify the segmentation types, industry trends, key players, competitive landscape, key market dynamics, and key player strategies.
Secondary Research
This research study involved the use of comprehensive secondary sources; directories and databases such as D&B, Bloomberg Business, and Factiva; and white papers, annual reports, and companies’ house documents. Secondary research was used to identify and collect information for this extensive, technical, market-oriented, and commercial study of the antimicrobial resistance surveillance market. It was also used to obtain important information about the top players, market classification, and segmentation according to industry trends to the bottom-most level, geographic markets, technology perspectives, and key developments related to the market. A database of the key industry leaders was also prepared using secondary research.
Primary Research
In the primary research process, various sources from both the supply and demand sides were interviewed to obtain qualitative and quantitative information for this report. Primary sources from the supply side and demand side are detailed below. Industry experts such as CEOs, presidents, vice presidents, directors, marketing directors, marketing managers, and related executives from various key companies and organizations in the antimicrobial resistance surveillance industry were interviewed to obtain and verify both the qualitative and quantitative aspects of this research study. A robust primary research methodology has been adopted to validate the contents of the report and fill in the gaps.
A breakdown of the primary respondents is provided below:
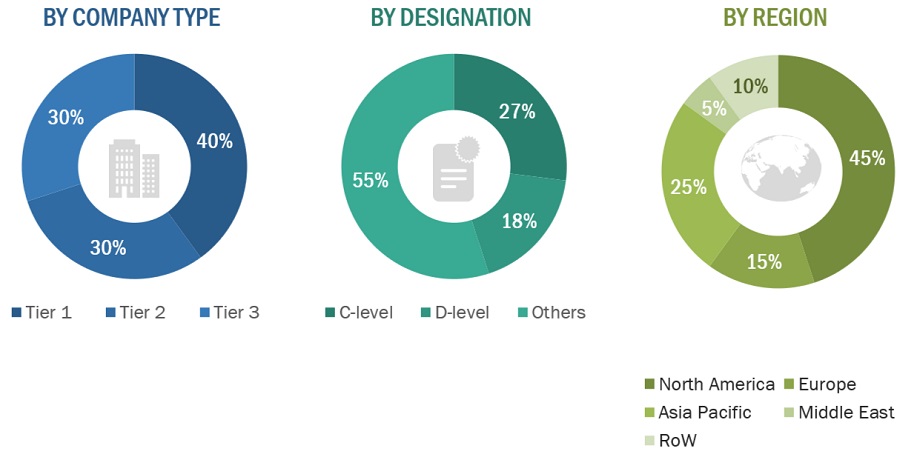
*Others include sales managers, marketing managers, and product managers.
Note: Tiers are defined based on a company’s total revenue, as of 2022: Tier 1 = >USD 5 billion, Tier 2 = USD 1 billion to USD 5 billion, and Tier 3 = <USD 1 billion.
To know about the assumptions considered for the study, download the pdf brochure
|
COMPANY NAME |
DESIGNATION |
|
Danaher |
Assistant Manager Sales |
|
Luminex Corporation |
Assistant Project Manager |
|
Qiagen |
Business Development Manager |
Market Size Estimation
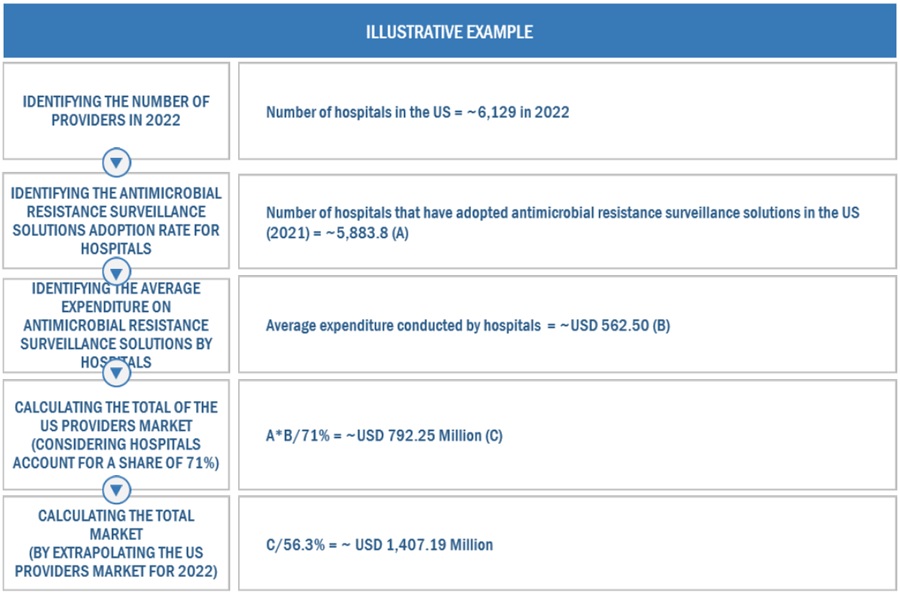
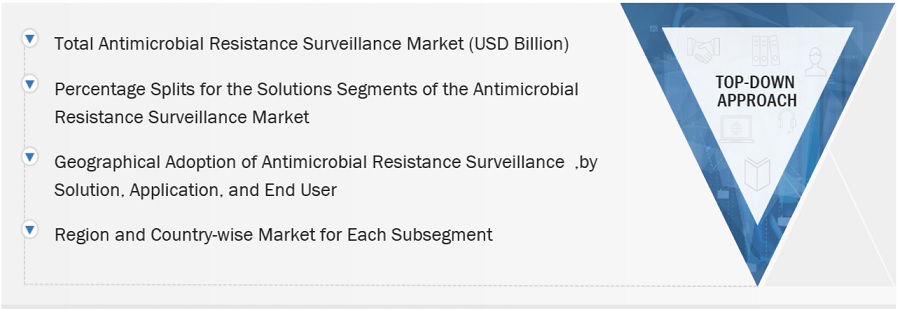
The market size estimates and forecasts provided in this study are derived through a mix of the bottom-up approach (revenue share analysis) primary interviews, and top-down approach (assessment of Individual shares of each solution, application, and end-user segment).
Antimicrobial Resistance Surveillance Market Size: Revenue Share Analysis
Antimicrobial Market Size: Bottom up Approach
- For estimating the size of the global Antimicrobial resistance surveillance market, the country-level market revenues were obtained from secondary sources and through extensive primary interviews.
- Country-level markets for the US and Canada were added to arrive at the market size for North America. Similarly, country-level markets for Germany, France, the UK, Spain, Italy, and the Rest of Europe were added to arrive at the market size for Europe, and the market sizes of Japan, China, India, and the Rest of Asia Pacific were added to arrive at the market size of the Asia Pacific.
- The markets for North America, Europe, the Asia Pacific, Latin America, and the Middle East & Africa were added to arrive at the global market.
- The total market derived through the bottom-up approach was again validated through secondary sources and primary interviews.
Data Triangulation
After arriving at the market size, the total market was divided into several segments and subsegments. To complete the overall market engineering process and arrive at the exact statistics for all segments & subsegments, data triangulation, and market breakdown procedures were employed, wherever applicable.
To know about the assumptions considered for the study, Request for Free Sample Report
Market Definition
Antimicrobial resistance (AMR) surveillance is a systematic process of monitoring and tracking the ability of microorganisms (such as bacteria, viruses, fungi) to resist the effects of antimicrobial drugs, including antibiotics, antivirals, and antifungal medications.
Key Stakeholders
- Distributors, Suppliers, and Commercial Service Providers
- Healthcare Service Providers
- Manufacturers of Pharmaceutical Products
- Clinical Research Organizations (CROs)
- Clinical Testing Laboratories
- Blood Culture Media Manufacturers
- Food & Beverage Manufacturing Companies
- Environmental Monitoring Committees
- Manufacturers of Environmental Monitoring Products
- National & Regional Pollution Control Boards and Organizations
- Research Laboratories and Academic Institutes
- Market Research and Consulting Firms
Objectives of the Study
- To define, describe, segment, and forecast the antimicrobial resistance surveillance market by solution, application, end user, and region
- To provide detailed information about the factors influencing the market growth (such as drivers, restraints, opportunities, and challenges)
- To analyze micromarkets1 with respect to individual growth trends, prospects, and contributions to the overall antimicrobial resistance surveillance market
- To analyze market opportunities for stakeholders and provide details of the competitive landscape for key players
- To estimate and forecast the size of the antimicrobial resistance surveillance market in five main regions (along with their respective key countries), namely, North America, Europe, the Asia Pacific, Latin America, and Middle East Africa.
- To profile the key players and analyze their market shares and core competencies3
- To track and analyze competitive developments such as product launches, agreements, partnership, and acquisitions in the global antimicrobial resistance surveillance market
- To benchmark players within the antimicrobial resistance surveillance market using the competitive leadership mapping framework, which analyzes market players on various parameters within the broad categories of business strategy, market share, and product offering.
Available Customizations
With the given market data, MarketsandMarkets offers customizations as per your company’s specific needs. The following customization options are available for the report:
Product Analysis
- Product matrix, which gives a detailed comparison of the product portfolio of each company
Company Information
- Detailed analysis and profiling of additional market players (up to five)


Growth opportunities and latent adjacency in Antimicrobial Resistance Surveillance Market