Barrier Systems Market by Material (Concrete, Wood, Metal, Plastics), Application (Roadways, Railways, Commercial, Residential), Type (Bollards, Fences, Crash Barriers Systems, Crash Barrier Devices, Drop Arms), Function, & Region - Global Forecast to 2028
Updated on : November 11, 2025
Barrier Systems Market
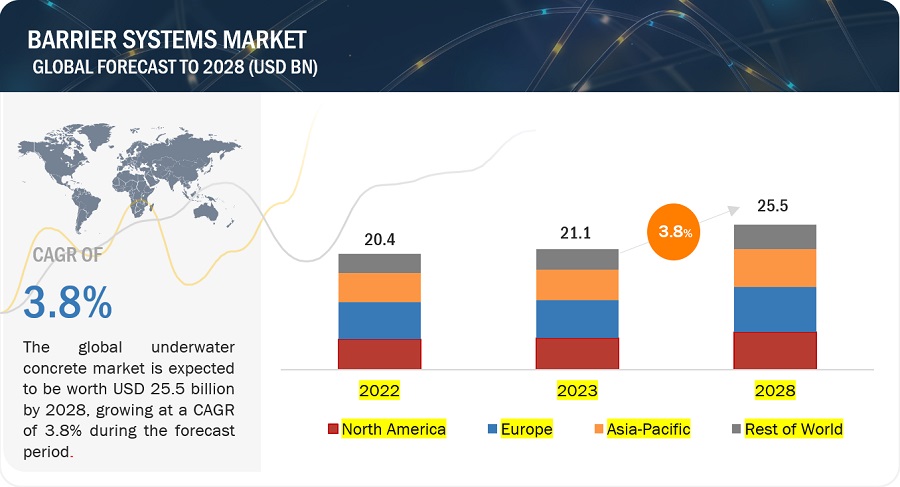
The global barrier systems market was valued at USD 21.1 billion in 2023 and is projected to reach USD 25.5 billion by 2028, growing at 3.8% cagr from 2023 to 2028. Barrier systems refer to a set of physical structures, devices, or components designed to provide separation, control access, and enhance safety in specific environments. These systems are used to create barriers or boundaries between different areas, prevent unauthorized entry, regulate traffic flow, and protect individuals and property from potential hazards. Further, barrier systems are crucial for the construction and maintenance of various infrastructure projects such as bridges, tunnels, and highways. As countries invest in expanding their infrastructure to facilitate trade and transportation, the demand for barrier systems increases.
Barrier Systems Market Forecast & Trends
To know about the assumptions considered for the study, Request for Free Sample Report
Attractive Opportunities in the Barrier Systems Market
Barrier Systems Market Dynamics
Driver: Growing infrastructural activities and automotive industries
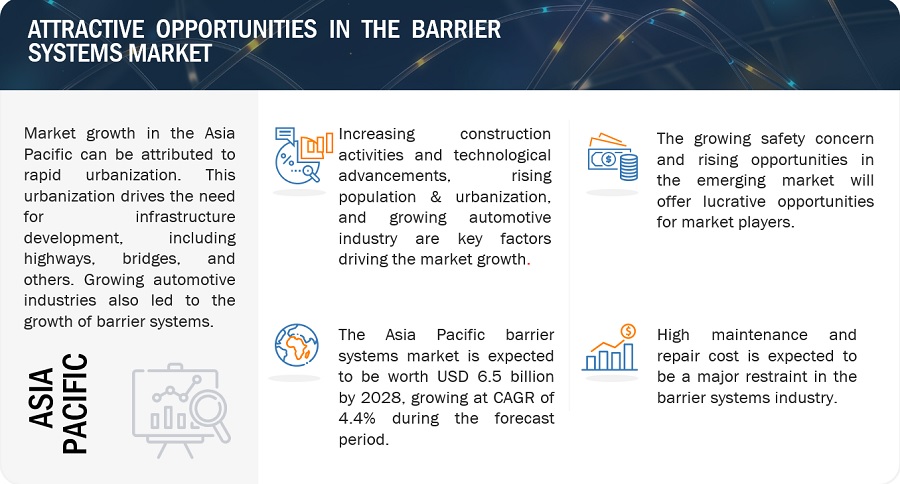
The growth of the barrier systems market is being fueled by several factors, rising urbanization, rapid industrialization, growing automotive industries, and increasing infrastructural activities such as the construction of highways, roadways, etc. The demand for barrier systems is rising due to the need for infrastructure development in urban areas, including bridges, tunnels, railways, and highways. Additionally, as a growing concern for safety, and the presence of stringent traffic norms led to the demand for barrier systems.
Restraint: High Maintenance and repair cost
Barrier systems provide essential safety and security benefits, they often require regular maintenance and occasional repairs to ensure their effectiveness and longevity. High maintenance and repair costs can pose a financial burden on the owners or operators of barrier systems. This can deter potential buyers from investing in barrier systems, especially in situations where budgets are constrained. As a result of this, it becomes a major restraining factor for the barrier systems market.
Opportunities: Growing opportunities in the emerging market
The infrastructural activities such as the construction of highways, tunnels, bridges, etc. present significant opportunities for the barrier systems market. As the demand for better infrastructure is growing due to the rise in urbanization, which raises the raises concern for safety measures. As a result of this, the demand for barrier systems is getting fuelled. Technological advancements in the automotive sector and regional development initiatives further fuel the market's growth. International collaboration and sustainability considerations also play a role in driving market opportunities.
Challenges: Volatility in raw material prices
The safety barriers market relies heavily on raw materials for production. As long as these raw materials are available at a reasonable price, manufacturing is feasible. However, the prices of raw materials are highly volatile; if these prices go up, the production prices also go up, which results in inflated prices of the finished products for end users. This will affects the demand of the end product in the market.
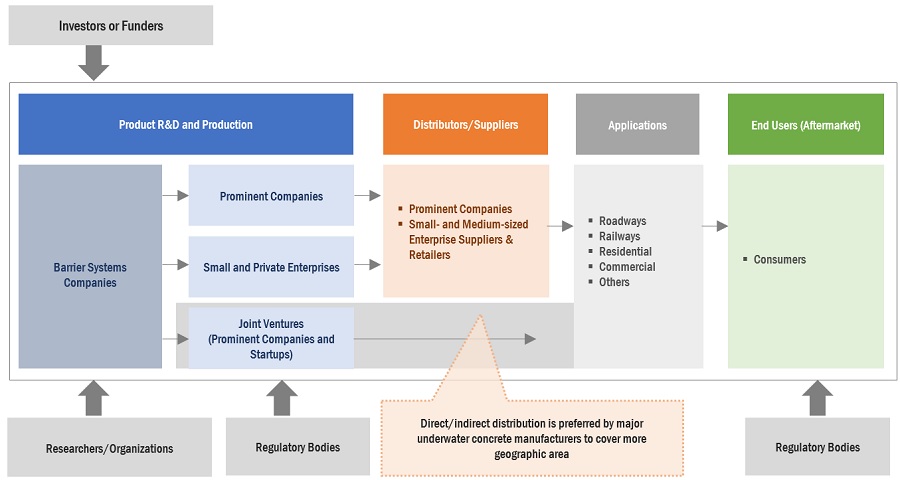
Barrier Systems Market Ecosystem
By Material, Plastics accounted for the highest CAGR during the forecast period
The combination of cost-effectiveness, versatility, lightweight nature, and sustainability aspects positions plastic-type barrier systems as a viable and increasingly popular choice for a wide range of applications, including road safety, traffic management, crowd control, construction, events, and more. However, it's important to ensure that the specific plastic materials used in barrier systems meet the required safety standards and durability for each intended application.
By Type, Passive Barriers accounted for the largest share in 2022
Passive barriers are physical structures or devices that provide a fixed or static form of separation, control, or protection in various settings. Passive barriers have dynamic or moving components, passive barriers do not require external power or ongoing adjustments to function effectively. They offer a reliable and low-maintenance solution for safety, security, and traffic management. Passive barriers serve diverse purposes and are commonly used in different applications, including road safety, crowd control, access restriction, and perimeter security. They are often made of sturdy and durable materials such as concrete, steel, plastic, or wood.
By Application, Roadways accounted for the largest share in 2022
Barrier systems used in roadways are essential for ensuring safety, managing traffic flow, and preventing accidents. These systems are strategically placed along roadways to protect motorists, pedestrians, and surrounding infrastructure. There are several types of barrier systems that are used in the roadways segment, such as Guardrails, Median Barriers, Concrete Barriers, Cable Barriers, Fencing, End Terminals, etc. Barrier systems are crucial in preventing accidents and protecting motorists and pedestrians on busy roadways. Stringent traffic norms which are used to prevent the increasing number of accidents are one of the major factors to drive the demand for barrier systems.
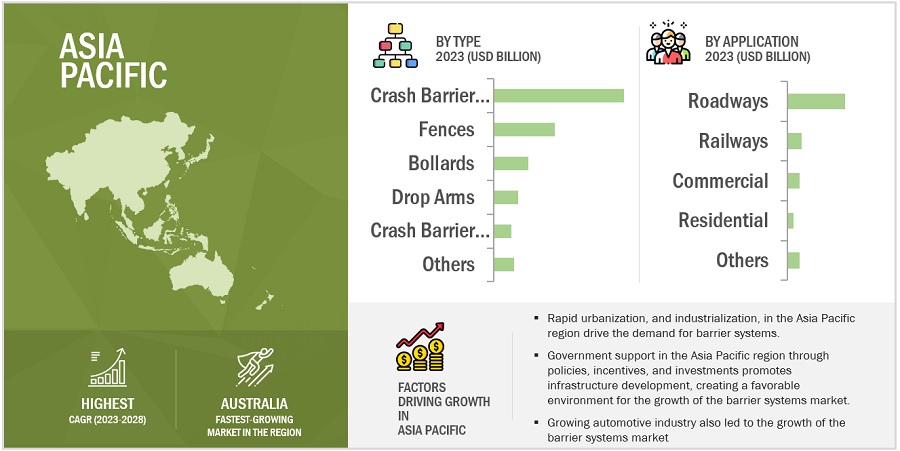
Asia Pacific is projected to account for the highest CAGR in the barrier systems market during the forecast period
The Asia Pacific region is experiencing significant investments in infrastructural projects, including the construction of highways, bridges, tunnels, and improving railway networks, which fuel the demand for barrier systems. Moreover, the region's growing automotive industries further drive the need for barrier systems. In addition to this, the government of several countries in the region such as India, imposed some stringent traffic norms which also led to the growth of barrier systems.
To know about the assumptions considered for the study, download the pdf brochure
Barrier Systems Market Players
The barrier systems market comprises key manufacturers such as Tata Steel Limited (India), Bekaert (Belgium), Valtir, LLC. (U.S.), Lindsay Corporation (U.S.), Valmont Industries Inc. (U.S), and others. Expansions, acquisitions, joint ventures, and new product developments are some of the major strategies adopted by these key players to enhance their positions in the barrier systems market.
Barrier Systems Market Report Scope
|
Report Metric |
Details |
|
Years Considered |
2021–2028 |
|
Base year |
2022 |
|
Forecast period |
2023–2028 |
|
Unit considered |
Value (USD Million/Billion), Volume (Thousands Units) |
|
Segments |
Type, Materials, Function, Application, and Region |
|
Regions |
Asia-Pacific, North America, Europe, and Rest of World |
|
Companies |
The major players are Tata Steel Limited (India), Bekaert (Belgium), Valtir, LLC. (U.S.), Lindsay Corporation (U.S.), Valmont Industries Inc. (U.S.), and others are covered in the Barrier Systems market. |
This research report categorizes the global barrier systems market on the basis of Type, Function, Raw Material, Application and Region.
Barrier Systems Market by Type
- Bollards
- Fences
- Crash Barriers Systems
- Crash Barrier Devices
- Drop Arms
- Others
Barrier Systems Market by Function
- Active Barriers
- Passive Barriers
Barrier Systems Market by Raw Material
- Concrete
- Plastic
- Metal
- Wood
Barrier Systems Market by Application
- Roadways
- Railways
- Commercial
- Residential
- Others
Barrier Systems Market by Region
- Asia Pacific (APAC)
- North America
- Europe
- Rest of World
The market has been further analyzed for the key countries in each of these regions.
Recent Developments
- In March 2023, Bekaert has partnered with Chapter Zero Brussels to share knowledge and awareness in the fight against climate change.
- In October 2022, Bekaert has decided to consolidate the European ropes manufacturing platform in the UK, by improving the existing lower-margin market segment.
- In July 2022, Tata Steel Limited has partnered with WMG, University of Warwick, to focus on developing new environmentally friendly steel grades which can be used for several applications.
- In June 2022, Tata Steel Limited has invested more than USD 7.37 million in North-East Mill to cut CO2 emissions and reduce the total costs of steel-making products.
- In February 2022, Bekaert has announced the acquisition of VisionTek Engineering Srl as an important strategic step in extending the service offering to customers.
- In June 2021, Valtir, LLC has signed an exclusive agreement with Highway Care Ltd. to manufacture, rent, and sell the MASH-tested HighwayGuard Barrier in North America.
- In September 2020, Bekaert and Almasa SA have reached an agreement on the merger of Proalco SAS (subsidiary of Bekaert) with the steel wire activities of Almasa SA, both located in Colombia.
- In March 2020, Valtir, LLC has launched two truck/trailer-mounted attenuators (TMAs) that can be attached to the rear of a stationary or moving shadow support vehicle.
- In February 2020, Bekaert has partnered with AGRO International to develop and produce high-end steel wire innerspring systems.
Frequently Asked Questions (FAQ):
What are the major drivers driving the growth of the barrier systems market?
The barrier systems market is expected to witness significant growth in the future due to the growing infrastructural activities and automotive industries.
What are the major challenges in the barrier systems market?
The major challenge in the barrier systems market is volatility in raw material prices.
What are the restraining factors in the barrier systems market?
The major restraining factor faced by the barrier systems market is the high maintenance and repair cost.
What is the key opportunity in the barrier systems market?
Growing concern for safety and security, and growing opportunities in emerging markets is the key opportunity in the barrier systems market
What are the application areas where barrier systems are used?
The barrier systems are majorly used in roadways, railways, commercial, residential and others. .
To speak to our analyst for a discussion on the above findings, click Speak to Analyst


- 5.1 INTRODUCTION
-
5.2 MARKET DYNAMICSDRIVERS- Rising spending on infrastructural development- Increasing road crash incidences- Stringent government regulations and obligationsRESTRAINTS- High maintenance and repair costsOPPORTUNITIES- Increasing opportunities in emerging regions- Growing construction and automotive industriesCHALLENGES- Interference of highway agencies- Volatility in raw material prices
-
6.1 PORTER’S FIVE FORCES ANALYSISTHREAT OF NEW ENTRANTSTHREAT OF SUBSTITUTESBARGAINING POWER OF SUPPLIERSBARGAINING POWER OF BUYERSINTENSITY OF COMPETITIVE RIVALRY
- 6.2 SUPPLY CHAIN ANALYSIS
- 6.3 VALUE CHAIN ANALYSIS
- 6.4 KEY MARKETS FOR IMPORT AND EXPORT (TRADE ANALYSIS)
-
6.5 MACROECONOMIC OVERVIEWGLOBAL GDP OUTLOOK
- 6.6 TECHNOLOGY ANALYSIS
- 6.7 TARIFF AND REGULATORY LANDSCAPE
-
6.8 CASE STUDY ANALYSISSAFETY BARRIER SYSTEM ROLLOUT FOR M74 BRIDGE IN SCOTLAND- Hardstaff Barriers supplies safety barrier system to Transport Scotland
-
6.9 TRENDS/DISRUPTIONS IMPACTING CUSTOMERS’ BUSINESSES
-
6.10 KEY STAKEHOLDERS AND BUYING CRITERIAKEY STAKEHOLDERS IN BUYING PROCESSBUYING CRITERIA
- 6.11 CKEY CONFERENCES & EVENTS, 2022–2023
-
6.12 PRICING ANALYSISCHANGES IN PRICING OF BARRIER SYSTEMS IN 2022
-
6.13 MARKET MAPPING/ECOSYSTEM MAP
-
6.14 PATENT ANALYSISINTRODUCTIONMETHODOLOGYDOCUMENT TYPE (2019–2023)INSIGHTSTOP APPLICANTS
- 7.1 INTRODUCTION
-
7.2 BOLLARDSGROWING APPLICATION IN RESIDENTIAL AND COMMERCIAL ENTRANCES, PARKS, AND WALKWAYS TO DRIVE MARKET
-
7.3 FENCESRISING USE OF FENCES IN RESIDENTIAL AND COMMERCIAL PLACES TO DRIVE MARKET
-
7.4 CRASH BARRIER SYSTEMSRISING GOVERNMENT REGULATIONS REGARDING ROAD SAFETY BARRIERS TO INCREASE DEMAND.
-
7.5 CRASH BARRIER DEVICESWIDE USAGE IN BRIDGES AND HIGHWAYS TO REDUCE VEHICLE COLLISION IMPACT
-
7.6 DROP ARMSRISING AWARENESS REGARDING SECURITY IN SEVERAL APPLICATIONS TO DRIVE DEMAND
- 7.7 OTHER TYPES
- 8.1 INTRODUCTION
-
8.2 PLASTICSCOST-EFFECTIVENESS AND LIGHTWEIGHT PROPERTY TO DRIVE DEMAND IN SEVERAL APPLICATIONS
-
8.3 METALRELIABILITY AND DURABILITY OF METAL BARRIERS TO BOOST MARKET
-
8.4 CONCRETEMINIMAL MAINTENANCE REQUIREMENTS TO DRIVE DEMAND
-
8.5 WOODRESIDENTIAL APPLICATION TO DRIVE MARKET FOR WOOD BARRIER SYSTEMS
- 9.1 INTRODUCTION
-
9.2 PASSIVE BARRIERSINCREASE IN DEMAND FOR CONCRETE AND METAL BARRIERS FOR VEHICLE SAFETY AND DAMAGE CONTROL TO DRIVE MARKET
-
9.3 ACTIVE BARRIERSRISING SECURITY SYSTEMS IN RESIDENTIAL AND COMMERCIAL APPLICATIONS TO DRIVE DEMAND
- 10.1 INTRODUCTION
-
10.2 ROADWAYSRISING ROAD SAFETY INITIATIVES AND GUIDELINES TO DRIVE DEMAND
-
10.3 RAILWAYSPASSENGER SAFETY AND MINIMAL DERAILMENT DAMAGE IN RAILWAYS APPLICATIONS TO DRIVE MARKET
-
10.4 COMMERCIALWIDE USAGE BY SECURITY DEPARTMENTS IN COMMERCIAL PREMISES TO DRIVE MARKET
-
10.5 RESIDENTIALRISE IN SECURITY CONCERNS IN RESIDENTIAL PREMISES TO INCREASE DEMAND
- 10.6 OTHER APPLICATIONS
- 11.1 INTRODUCTION
-
11.2 NORTH AMERICARECESSION IMPACTUS- New highway projects to drive marketCANADA- Large road network to drive marketMEXICO- Road safety initiatives to propel market
-
11.3 ASIA PACIFICRECESSION IMPACTCHINA- Rapid economic development to drive marketINDIA- Upcoming highway projects to drive marketJAPAN- Established steel manufacturing industries to boost marketAUSTRALIA- Government spending on infrastructure projects to drive marketINDONESIA- Increasing roadway network to propel marketREST OF ASIA PACIFIC
-
11.4 EUROPERECESSION IMPACTGERMANY- Stringent traffic norms to drive marketUK- Increased spending on infrastructure to provide growth opportunitiesFRANCE- Rising demand for railway applications to drive marketRUSSIA- Decrement in road crash fatality to drive marketITALY- Increasing highway projects to drive marketREST OF EUROPE
-
11.5 REST OF THE WORLD (ROW)RECESSION IMPACTBRAZIL- Significant investments in infrastructure to drive marketSOUTH AFRICA- Increasing investments by SANRAL in road safety projectsOTHER COUNTRIES IN ROW

- 12.1 OVERVIEW
- 12.2 MARKET RANKING ANALYSIS
-
12.3 COMPANY EVALUATION QUADRANT, 2022STARSEMERGING LEADERSPARTICIPANTSPERVASIVE COMPANIES
- 12.4 COMPETITIVE BENCHMARKING OF OVERALL MARKET
-
12.5 SMES EVALUATION QUADRANT, 2022PROGRESSIVE COMPANIESRESPONSIVE COMPANIESDYNAMIC COMPANIESSTARTING BLOCKS
-
12.6 COMPETITIVE SCENARIODEALSPRODUCT LAUNCHES
-
13.1 KEY PLAYERSTATA STEEL LIMITED- Business overview- Products/Solutions/Services offered- Recent developments- MnM viewHILL & SMITH PLC- Business overview- Products/Solutions/Services offered- Recent developments- MnM viewVALMONT INDUSTRIES, INC.- Business overview- Products/Solutions/Services offered- MnM viewBEKAERT- Business overview- Products/Solutions/Services offered- Recent developments- MnM viewLINDSAY CORPORATION- Business overview- Products/Solutions/Services offered- Recent developments- MNM viewNUCOR STEEL MARION, INC.- Business overview- Products/Solutions/Services offered- MnM viewAMERISTAR PERIMETER SECURITY- Business overview- Products/Solutions/Services offered- Recent developments- MnM viewA-SAFE- Business overview- Products/Solutions/Services offered- Recent developments- MnM viewDELTA SCIENTIFIC CORPORATION- Business overview- Products/Solutions/Services offered- Recent developments- MnM viewVALTIR, LLC- Business overview- Products/Solutions/Services offered- Recent developments- MnM view
-
13.2 OTHER PLAYERSDELTABLOC INTERNATIONAL GMBHGLOBAL GRAB TECHNOLOGIES INC.GRAMM BARRIER SYSTEMS LTD.SENSTAR CORPORATIONBETAFENCEARBUSCT SAFETY BARRIERS LTD.TRANSPO INDUSTRIES INC.ATG ACCESS LTD.AUTOMATIC SYSTEMSCIAS ELETTRONICA SRLPERIMETER PROTECTION GROUPCONCENTRIC SECURITYNASATKA SECURITYBARRIER1 SYSTEMS, LLC
- 15.1 DISCUSSION GUIDE
- 15.2 KNOWLEDGESTORE: MARKETSANDMARKETS’ SUBSCRIPTION PORTAL
- 15.3 CUSTOMIZATION OPTIONS
- 15.4 RELATED REPORTS
- 15.5 AUTHOR DETAILS
- TABLE 1 GDP GROWTH RATE FOR MAJOR REGIONS
- TABLE 2 GLOBAL AUTOMOTIVE VEHICLE PRODUCTION, BY REGION, 2019–2021 (MILLION UNIT)
- TABLE 3 BARRIER SYSTEMS MARKET: PORTER’S FIVE FORCES ANALYSIS
- TABLE 4 GRILL, NETTING, AND FENCING OF IRON OR STEEL WIRE, WELDED AT INTERSECTION (731439) IMPORTS, BY COUNTRY, 2022
- TABLE 5 GRILL, NETTING, AND FENCING OF IRON OR STEEL WIRE, WELDED AT INTERSECTION (731439) EXPORTS, BY COUNTRY, 2022
- TABLE 6 GLOBAL GDP GROWTH PROJECTION, 2019–2026 (USD BILLION)
- TABLE 7 LIST OF REGULATORY BODIES, GOVERNMENT AGENCIES, AND OTHER ORGANIZATIONS
- TABLE 8 INFLUENCE OF STAKEHOLDERS ON BUYING PROCESS FOR CONSTRUCTION INDUSTRY (%)
- TABLE 9 KEY BUYING CRITERIA FOR BARRIER SYSTEMS FOR CONSTRUCTION INDUSTRY
- TABLE 10 BARRIER SYSTEMS MARKET: DETAILED LIST OF CONFERENCES & EVENTS
- TABLE 11 LIST OF PATENTS
- TABLE 12 BARRIER SYSTEMS MARKET, BY TYPE, 2021–2028 (USD MILLION)
- TABLE 13 BOLLARDS: BARRIER SYSTEMS MARKET, BY REGION, 2021–2028 (USD MILLION)
- TABLE 14 FENCES: BARRIER SYSTEMS MARKET, BY REGION, 2021–2028 (USD MILLION)
- TABLE 15 CRASH BARRIER SYSTEMS: BARRIER SYSTEMS MARKET, BY REGION, 2021–2028 (USD MILLION)
- TABLE 16 CRASH BARRIER DEVICES: BARRIER SYSTEMS MARKET, BY REGION, 2021–2028 (USD MILLION)
- TABLE 17 DROP ARMS: BARRIER SYSTEMS MARKET, BY REGION, 2021–2028 (USD MILLION)
- TABLE 18 OTHER TYPES: BARRIER SYSTEMS MARKET, BY REGION, 2021–2028 (USD MILLION)
- TABLE 19 BARRIER SYSTEMS MARKET, BY MATERIAL, 2021–2028 (USD MILLION)
- TABLE 20 PLASTIC BARRIER SYSTEMS MARKET, BY REGION, 2021–2028 (USD MILLION)
- TABLE 21 METAL BARRIER SYSTEMS MARKET, BY REGION, 2021–2028 (USD MILLION)
- TABLE 22 CONCRETE BARRIER SYSTEMS MARKET, BY REGION, 2021–2028 (USD MILLION)
- TABLE 23 WOOD BARRIER SYSTEMS MARKET, BY REGION, 2021–2028 (USD MILLION)
- TABLE 24 BARRIER SYSTEMS MARKET, BY FUNCTION, 2021–2028 (USD MILLION )
- TABLE 25 PASSIVE BARRIER SYSTEMS MARKET, BY REGION, 2021–2028 (USD MILLION)
- TABLE 26 ACTIVE BARRIER SYSTEMS MARKET, BY REGION, 2021–2028 (USD MILLION)
- TABLE 27 BARRIER SYSTEMS MARKET, BY APPLICATION, 2021–2028 (USD MILLION)
- TABLE 28 ROADWAYS: BARRIER SYSTEMS MARKET, BY REGION, 2021–2028 (USD MILLION)
- TABLE 29 RAILWAYS: BARRIER SYSTEMS MARKET, BY REGION, 2021–2028 (USD MILLION)
- TABLE 30 COMMERCIAL: BARRIER SYSTEMS MARKET, BY REGION, 2021–2028 (USD MILLION)
- TABLE 31 RESIDENTIAL: BARRIER SYSTEMS MARKET, BY REGION, 2021–2028 (USD MILLION)
- TABLE 32 OTHER APPLICATIONS: BARRIER SYSTEMS MARKET, BY REGION, 2021–2028 (USD MILLION)
- TABLE 33 BARRIER SYSTEMS MARKET, BY REGION, 2021–2028 (USD MILLION)
- TABLE 34 NORTH AMERICA: BARRIER SYSTEMS MARKET, BY COUNTRY, 2021–2028 (USD MILLION)
- TABLE 35 NORTH AMERICA: BARRIER SYSTEMS MARKET, BY TYPE, 2021–2028 (USD MILLION)
- TABLE 36 NORTH AMERICA: BARRIER SYSTEMS MARKET, BY TYPE, 2021–2028 (MILLION UNITS AND MILLION METERS)
- TABLE 37 NORTH AMERICA: BARRIER SYSTEMS MARKET, BY MATERIAL, 2021–2028 (USD MILLION)
- TABLE 38 NORTH AMERICA: BARRIER SYSTEMS MARKET, BY FUNCTION, 2021–2028 (USD MILLION)
- TABLE 39 NORTH AMERICA: BARRIER SYSTEMS MARKET, BY APPLICATION, 2021–2028 (USD MILLION)
- TABLE 40 US: BARRIER SYSTEMS MARKET, BY TYPE, 2021–2028 (USD MILLION)
- TABLE 41 US: BARRIER SYSTEMS MARKET, BY MATERIAL, 2021–2028 (USD MILLION)
- TABLE 42 US: BARRIER SYSTEMS MARKET, BY FUNCTION, 2021–2028 (USD MILLION)
- TABLE 43 US: BARRIER SYSTEMS MARKET, BY APPLICATION, 2021–2028 (USD MILLION)
- TABLE 44 CANADA: BARRIER SYSTEMS MARKET, BY TYPE, 2021–2028 (USD MILLION)
- TABLE 45 CANADA: BARRIER SYSTEMS MARKET, BY MATERIAL, 2021–2028 (USD MILLION)
- TABLE 46 CANADA: BARRIER SYSTEMS MARKET, BY FUNCTION, 2021–2028 (USD MILLION)
- TABLE 47 CANADA: BARRIER SYSTEMS MARKET, BY APPLICATION, 2021–2028 (USD MILLION)
- TABLE 48 MEXICO: BARRIER SYSTEMS MARKET, BY TYPE, 2021–2028 (USD MILLION)
- TABLE 49 MEXICO: BARRIER SYSTEMS MARKET, BY MATERIAL, 2021–2028 (USD MILLION)
- TABLE 50 MEXICO: BARRIER SYSTEMS MARKET, BY FUNCTION, 2021–2028 (USD MILLION)
- TABLE 51 MEXICO: BARRIER SYSTEMS MARKET, BY APPLICATION, 2021–2028 (USD MILLION)
- TABLE 52 ASIA PACIFIC: BARRIER SYSTEMS MARKET, BY COUNTRY, 2021–2028 (USD MILLION)
- TABLE 53 ASIA PACIFIC: BARRIER SYSTEMS MARKET, BY TYPE, 2021–2028 (USD MILLION)
- TABLE 54 ASIA PACIFIC: BARRIER SYSTEMS MARKET, BY TYPE, 2021–2028 (MILLION UNITS AND MILLION METERS)
- TABLE 55 ASIA PACIFIC: BARRIER SYSTEMS MARKET, BY MATERIAL, 2021–2028 (USD MILLION)
- TABLE 56 ASIA PACIFIC: BARRIER SYSTEMS MARKET, BY FUNCTION, 2021–2028 (USD MILLION)
- TABLE 57 ASIA PACIFIC: BARRIER SYSTEMS MARKET, BY APPLICATION, 2021–2028 (USD MILLION)
- TABLE 58 CHINA: BARRIER SYSTEMS MARKET, BY TYPE, 2021–2028 (USD MILLION)
- TABLE 59 CHINA: BARRIER SYSTEMS MARKET, BY MATERIAL, 2021–2028 (USD MILLION)
- TABLE 60 CHINA: BARRIER SYSTEMS MARKET, BY FUNCTION, 2021–2028 (USD MILLION)
- TABLE 61 CHINA: BARRIER SYSTEMS MARKET, BY APPLICATION, 2021–2028 (USD MILLION)
- TABLE 62 INDIA: BARRIER SYSTEMS MARKET, BY TYPE, 2021–2028 (USD MILLION)
- TABLE 63 INDIA: BARRIER SYSTEMS MARKET, BY MATERIAL, 2021–2028 (USD MILLION)
- TABLE 64 INDIA: BARRIER SYSTEMS MARKET, BY FUNCTION, 2021–2028 (USD MILLION)
- TABLE 65 INDIA: BARRIER SYSTEMS MARKET, BY APPLICATION, 2021–2028 (USD MILLION)
- TABLE 66 JAPAN: BARRIER SYSTEMS MARKET, BY TYPE, 2021–2028 (USD MILLION)
- TABLE 67 JAPAN: BARRIER SYSTEMS MARKET, BY MATERIAL, 2021–2028 (USD MILLION)
- TABLE 68 JAPAN: BARRIER SYSTEMS MARKET, BY FUNCTION, 2021–2028 (USD MILLION)
- TABLE 69 JAPAN: BARRIER SYSTEMS MARKET, BY APPLICATION, 2021–2028 (USD MILLION)
- TABLE 70 AUSTRALIA: BARRIER SYSTEMS MARKET, BY TYPE, 2021–2028 (USD MILLION)
- TABLE 71 AUSTRALIA: BARRIER SYSTEMS MARKET, BY MATERIAL, 2021–2028 (USD MILLION)
- TABLE 72 AUSTRALIA: BARRIER SYSTEMS MARKET, BY FUNCTION, 2021–2028 (USD MILLION)
- TABLE 73 AUSTRALIA: BARRIER SYSTEMS MARKET, BY APPLICATION, 2021–2028 (USD MILLION)
- TABLE 74 INDONESIA: BARRIER SYSTEMS MARKET, BY TYPE, 2021–2028 (USD MILLION)
- TABLE 75 INDONESIA: BARRIER SYSTEMS MARKET, BY MATERIAL, 2021–2028 (USD MILLION)
- TABLE 76 INDONESIA: BARRIER SYSTEMS MARKET, BY FUNCTION, 2021–2028 (USD MILLION)
- TABLE 77 INDONESIA: BARRIER SYSTEMS MARKET, BY APPLICATION, 2021–2028 (USD MILLION)
- TABLE 78 REST OF ASIA PACIFIC: BARRIER SYSTEMS MARKET, BY TYPE, 2021–2028 (USD MILLION)
- TABLE 79 REST OF ASIA PACIFIC: BARRIER SYSTEMS MARKET, BY MATERIAL, 2021–2028 (USD MILLION)
- TABLE 80 REST OF ASIA PACIFIC: BARRIER SYSTEMS MARKET, BY FUNCTION, 2021–2028 (USD MILLION)
- TABLE 81 REST OF ASIA PACIFIC: BARRIER SYSTEMS MARKET, BY APPLICATION, 2021–2028 (USD MILLION)
- TABLE 82 EUROPE: BARRIER SYSTEMS MARKET, BY COUNTRY, 2021–2028 (USD MILLION)
- TABLE 83 EUROPE: BARRIER SYSTEMS MARKET, BY TYPE, 2021–2028 (USD MILLION)
- TABLE 84 EUROPE: BARRIER SYSTEMS MARKET, BY TYPE, 2021–2028 (MILLION UNITS AND MILLION METERS)
- TABLE 85 EUROPE: BARRIER SYSTEMS MARKET, BY MATERIAL, 2021–2028 (USD MILLION)
- TABLE 86 EUROPE: BARRIER SYSTEMS MARKET, BY FUNCTION, 2021–2028 (USD MILLION)
- TABLE 87 EUROPE: BARRIER SYSTEMS MARKET, BY APPLICATION, 2021–2028 (USD MILLION)
- TABLE 88 GERMANY: BARRIER SYSTEMS MARKET, BY TYPE, 2021–2028 (USD MILLION)
- TABLE 89 GERMANY: BARRIER SYSTEMS MARKET, BY MATERIAL, 2021–2028 (USD MILLION)
- TABLE 90 GERMANY: BARRIER SYSTEMS MARKET, BY FUNCTION, 2021–2028 (USD MILLION)
- TABLE 91 GERMANY: BARRIER SYSTEMS MARKET, BY APPLICATION, 2021–2028 (USD MILLION)
- TABLE 92 UK: BARRIER SYSTEMS MARKET, BY TYPE, 2021–2028 (USD MILLION)
- TABLE 93 UK: BARRIER SYSTEMS MARKET, BY MATERIAL, 2021–2028 (USD MILLION)
- TABLE 94 UK: BARRIER SYSTEMS MARKET, BY FUNCTION, 2021–2028 (USD MILLION)
- TABLE 95 UK: BARRIER SYSTEMS MARKET, BY APPLICATION, 2021–2028 (USD MILLION)
- TABLE 96 FRANCE: BARRIER SYSTEMS MARKET, BY TYPE, 2021–2028 (USD MILLION)
- TABLE 97 FRANCE: BARRIER SYSTEMS MARKET, BY MATERIAL, 2021–2028 (USD MILLION)
- TABLE 98 FRANCE: BARRIER SYSTEMS MARKET, BY FUNCTION, 2021–2028 (USD MILLION)
- TABLE 99 FRANCE: BARRIER SYSTEMS MARKET, BY APPLICATION, 2021–2028 (USD MILLION)
- TABLE 100 RUSSIA: BARRIER SYSTEMS MARKET, BY TYPE, 2021–2028 (USD MILLION)
- TABLE 101 RUSSIA: BARRIER SYSTEMS MARKET, BY MATERIAL, 2021–2028 (USD MILLION)
- TABLE 102 RUSSIA: BARRIER SYSTEMS MARKET, BY FUNCTION, 2021–2028 (USD MILLION)
- TABLE 103 RUSSIA: BARRIER SYSTEMS MARKET, BY APPLICATION, 2021–2028 (USD MILLION)
- TABLE 104 ITALY: BARRIER SYSTEMS MARKET, BY TYPE, 2021–2028 (USD MILLION)
- TABLE 105 ITALY: BARRIER SYSTEMS MARKET, BY MATERIAL, 2021–2028 (USD MILLION)
- TABLE 106 ITALY: BARRIER SYSTEMS MARKET, BY FUNCTION, 2021–2028 (USD MILLION)
- TABLE 107 ITALY: BARRIER SYSTEMS MARKET, BY APPLICATION, 2021–2028 (USD MILLION)
- TABLE 108 REST OF EUROPE: BARRIER SYSTEMS MARKET, BY TYPE, 2021–2028 (USD MILLION)
- TABLE 109 REST OF EUROPE: BARRIER SYSTEMS MARKET, BY MATERIAL, 2021–2028 (USD MILLION)
- TABLE 110 REST OF EUROPE: BARRIER SYSTEMS MARKET, BY FUNCTION, 2021–2028 (USD MILLION)
- TABLE 111 REST OF EUROPE: BARRIER SYSTEMS MARKET, BY APPLICATION, 2021–2028 (USD MILLION)
- TABLE 112 REST OF THE WORLD: BARRIER SYSTEMS MARKET, BY COUNTRY, 2021–2028 (USD MILLION)
- TABLE 113 REST OF THE WORLD: BARRIER SYSTEMS MARKET, BY TYPE, 2021–2028 (USD MILLION)
- TABLE 114 REST OF THE WORLD: BARRIER SYSTEMS MARKET, BY TYPE, 2021–2028 (MILLION UNITS AND MILLION METERS)
- TABLE 115 REST OF THE WORLD: BARRIER SYSTEMS MARKET, BY MATERIAL, 2021–2028 (USD MILLION)
- TABLE 116 REST OF THE WORLD: BARRIER SYSTEMS MARKET, BY FUNCTION, 2021–2028 (USD MILLION)
- TABLE 117 REST OF THE WORLD: BARRIER SYSTEMS MARKET, BY APPLICATION, 2021–2028 (USD MILLION)
- TABLE 118 BRAZIL: BARRIER SYSTEMS MARKET, BY TYPE, 2021–2028 (USD MILLION)
- TABLE 119 BRAZIL: BARRIER SYSTEMS MARKET, BY MATERIAL, 2021–2028 (USD MILLION)
- TABLE 120 BRAZIL: BARRIER SYSTEMS MARKET, BY FUNCTION, 2021–2028 (USD MILLION)
- TABLE 121 BRAZIL: BARRIER SYSTEMS MARKET, BY APPLICATION, 2021–2028 (USD MILLION)
- TABLE 122 SOUTH AFRICA: BARRIER SYSTEMS MARKET, BY TYPE, 2021–2028 (USD MILLION)
- TABLE 123 SOUTH AFRICA: BARRIER SYSTEMS MARKET, BY MATERIAL, 2021–2028 (USD MILLION)
- TABLE 124 SOUTH AFRICA: BARRIER SYSTEMS MARKET, BY FUNCTION, 2021–2028 (USD MILLION)
- TABLE 125 SOUTH AFRICA: BARRIER SYSTEMS MARKET, BY APPLICATION, 2021–2028 (USD MILLION)
- TABLE 126 OTHER COUNTRIES IN REST OF THE WORLD: BARRIER SYSTEMS MARKET, BY TYPE, 2021–2028 (USD MILLION)
- TABLE 127 OTHER COUNTRIES IN REST OF THE WORLD: BARRIER SYSTEMS MARKET, BY MATERIAL, 2021–2028 (USD MILLION)
- TABLE 128 OTHER COUNTRIES IN REST OF THE WORLD: BARRIER SYSTEMS MARKET, BY FUNCTION, 2021–2028 (USD MILLION)
- TABLE 129 OTHER COUNTRIES IN REST OF THE WORLD: BARRIER SYSTEMS MARKET, BY APPLICATION, 2021–2028 (USD MILLION)
- TABLE 130 BARRIER SYSTEMS MARKET: DETAILED LIST OF PLAYERS
- TABLE 131 BARRIER SYSTEMS MARKET: COMPETITIVE BENCHMARKING OF KEY START-UPS/SMES
- TABLE 132 DEALS, 2019–2023
- TABLE 133 PRODUCT LAUNCHES, 2019–2023
- TABLE 134 TATA STEEL LIMITED: COMPANY OVERVIEW
- TABLE 135 TATA STEEL LTD.: DEALS
- TABLE 136 TATA STEEL LTD.: OTHER DEVELOPMENTS
- TABLE 137 HILL & SMITH PLC.: COMPANY OVERVIEW
- TABLE 138 HILL & SMITH PLC: DEALS
- TABLE 139 HILL & SMITH PLC: PRODUCT LAUNCHES
- TABLE 140 VALMONT INDUSTRIES, INC.: COMPANY OVERVIEW
- TABLE 141 BEKAERT: COMPANY OVERVIEW
- TABLE 142 BEKAERT: DEALS
- TABLE 143 BEKAERT: OTHER DEVELOPMENTS
- TABLE 144 LINDSAY CORPORATION: COMPANY OVERVIEW
- TABLE 145 LINDSAY CORPORATION: DEALS
- TABLE 146 LINDSAY CORPORATION: PRODUCT LAUNCHES
- TABLE 147 NUCOR STEEL MARION, INC.: COMPANY OVERVIEW
- TABLE 148 AMERISTAR PERIMETER SECURITY: COMPANY OVERVIEW
- TABLE 149 AMERISTAR PERIMETER SECURITY: OTHER DEVELOPMENTS
- TABLE 150 A-SAFE: COMPANY OVERVIEW
- TABLE 151 A-SAFE: DEALS
- TABLE 152 A-SAFE: PRODUCT LAUNCHES
- TABLE 153 DELTA SCIENTIFIC CORPORATION: COMPANY OVERVIEW
- TABLE 154 DELTA SCIENTIFIC CORPORATION: PRODUCT LAUNCHES
- TABLE 155 VALTIR, LLC: COMPANY OVERVIEW
- TABLE 156 VALTIR, LLC: DEALS
- TABLE 157 VALTIR, LLC: PRODUCT LAUNCHES
- TABLE 158 DELTABLOC INTERNATIONAL GMBH: COMPANY OVERVIEW
- TABLE 159 GLOBAL GRAB TECHNOLOGIES INC.: COMPANY OVERVIEW
- TABLE 160 GRAMM BARRIER SYSTEMS LTD.: COMPANY OVERVIEW
- TABLE 161 SENSTAR CORPORATION: COMPANY OVERVIEW
- TABLE 162 BETAFENCE: COMPANY OVERVIEW
- TABLE 163 ARBUS: COMPANY OVERVIEW
- TABLE 164 CT SAFETY BARRIERS LTD.: COMPANY OVERVIEW
- TABLE 165 TRANSPO INDUSTRIES INC.: COMPANY OVERVIEW
- TABLE 166 ATG ACCESS LTD.: COMPANY OVERVIEW
- TABLE 167 AUTOMATIC SYSTEMS: COMPANY OVERVIEW
- TABLE 168 CIAS ELETTRONICA SRL: COMPANY OVERVIEW
- TABLE 169 PERIMETER PROTECTION GROUP: COMPANY OVERVIEW
- TABLE 170 CONCENTRIC SECURITY: COMPANY OVERVIEW
- TABLE 171 NASATKA SECURITY: COMPANY OVERVIEW
- TABLE 172 BARRIER1 SYSTEMS, LLC: COMPANY OVERVIEW
- TABLE 173 CRASH BARRIER SYSTEMS MARKET, BY REGION, 2019–2026 (USD MILLION)
- TABLE 174 CRASH BARRIER SYSTEMS MARKET, BY REGION, 2019–2026 (MILLION METER)
- FIGURE 1 BARRIER SYSTEMS MARKET SEGMENTATION
- FIGURE 2 BARRIER SYSTEMS MARKET: RESEARCH DESIGN
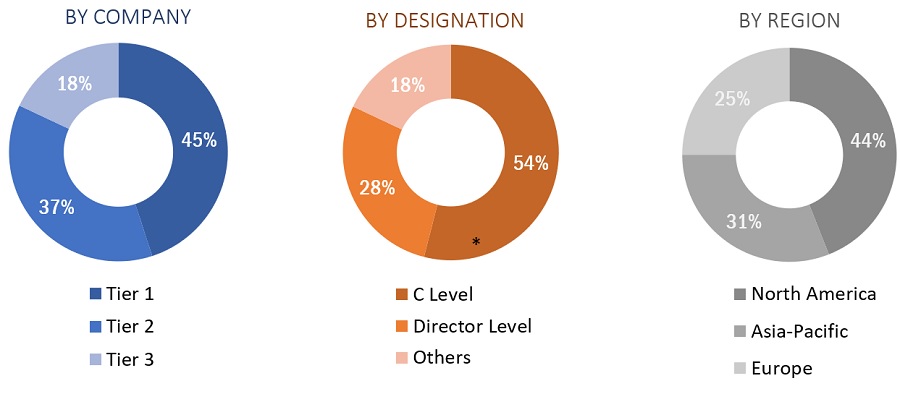
- FIGURE 3 BREAKDOWN OF PRIMARIES, BY COMPANY TYPE, DESIGNATION, AND REGION
- FIGURE 4 MARKET SIZE ESTIMATION METHODOLOGY: BOTTOM-UP APPROACH
- FIGURE 5 MARKET SIZE ESTIMATION METHODOLOGY: TOP-DOWN APPROACH
- FIGURE 6 DATA TRIANGULATION
- FIGURE 7 CRASH BARRIER SYSTEMS TO LEAD BARRIER SYSTEMS MARKET DURING FORECAST PERIOD
- FIGURE 8 EUROPE LED BARRIER SYSTEMS MARKET IN 2022
- FIGURE 9 EMERGING COUNTRIES TO OFFER ATTRACTIVE OPPORTUNITIES IN BARRIER SYSTEMS MARKET
- FIGURE 10 EUROPE: GERMANY ACCOUNTED FOR LARGEST SHARE OF BARRIER SYSTEMS MARKET IN 2022
- FIGURE 11 CRASH BARRIER SYSTEMS SEGMENT TO LEAD BARRIER SYSTEMS MARKET DURING FORECAST PERIOD
- FIGURE 12 COMMERCIAL TO BE FASTEST-GROWING SEGMENT DURING FORECAST PERIOD
- FIGURE 13 AUSTRALIA TO RECORD HIGHEST CAGR FROM 2023 TO 2028
- FIGURE 14 BARRIER SYSTEMS MARKET: DRIVERS, RESTRAINTS, OPPORTUNITIES, AND CHALLENGES
- FIGURE 15 PORTER’S FIVE FORCES ANALYSIS
- FIGURE 16 RAW MATERIAL SUPPLIERS AND MANUFACTURERS ADD MAJOR VALUE TO BARRIER SYSTEMS
- FIGURE 17 GROWING DEMAND FOR BARRIER SYSTEMS IN END-USE INDUSTRIES TO BRING IN CHANGE IN FUTURE REVENUE MIX
- FIGURE 18 INFLUENCE OF STAKEHOLDERS ON BUYING PROCESS
- FIGURE 19 KEY BUYING CRITERIA FOR CONSTRUCTION INDUSTRY
- FIGURE 20 ECOSYSTEM MAP
- FIGURE 21 DOCUMENT TYPE (2019–2023)
- FIGURE 22 PUBLICATION TRENDS, 2019–2023
- FIGURE 23 JURISDICTION ANALYSIS (2019–2023)
- FIGURE 24 TOP APPLICANTS, BY NUMBER OF PATENTS (TILL 2023)
- FIGURE 25 CRASH BARRIER SYSTEMS TO DOMINATE BARRIER SYSTEMS MARKET DURING FORECAST PERIOD
- FIGURE 26 METAL ACCOUNTED FOR LARGEST MARKET SHARE IN 2023
- FIGURE 27 PASSIVE BARRIERS TO LEAD BARRIER SYSTEMS MARKET DURING FORECAST PERIOD
- FIGURE 28 ROADWAYS TO DOMINATE BARRIER SYSTEMS MARKET DURING FORECAST PERIOD
- FIGURE 29 GEOGRAPHICAL SNAPSHOT: BARRIER SYSTEMS MARKET GROWTH RATE, BY COUNTRY, 2023–2028
- FIGURE 30 ASIA PACIFIC: MARKET SNAPSHOT
- FIGURE 31 EUROPE: MARKET SNAPSHOT
- FIGURE 32 COMPANIES ADOPTED ACQUISITIONS, PARTNERSHIPS, AND PRODUCT LAUNCHES AS KEY GROWTH STRATEGIES BETWEEN 2019 AND 2023
- FIGURE 33 BARRIER SYSTEMS: MARKET RANK ANALYSIS
- FIGURE 34 COMPANY EVALUATION QUADRANT, 2022
- FIGURE 35 SMES EVALUATION QUADRANT, 2022
- FIGURE 36 TATA STEEL LIMITED: COMPANY SNAPSHOT
- FIGURE 37 HILL & SMITH PLC: COMPANY SNAPSHOT
- FIGURE 38 VALMONT INDUSTRIES, INC.: COMPANY SNAPSHOT
- FIGURE 39 BEKAERT: COMPANY SNAPSHOT
- FIGURE 40 LINDSAY CORPORATION: COMPANY SNAPSHOT
This research involved the use of extensive secondary sources and databases, such as Factiva and Bloomberg, to identify and collect information useful for a technical and market-oriented study of the Barrier Systems market. Primary sources included industry experts from related industries and preferred suppliers, manufacturers, distributors, technologists, standards & certification organizations, and organizations related to all segments of the value chain of this industry. In-depth interviews have been conducted with various primary respondents, such as key industry participants, subject matter experts (SMEs), executives of key companies, and industry consultants, to obtain and verify critical qualitative and quantitative information as well as to assess growth prospects.
Secondary Research
In the secondary research process, various sources such as annual reports, press releases, and investor presentations of companies; white papers; and publications from recognized websites and databases have been referred to for identifying and collecting information. Secondary research has been used to obtain key information about the industry's supply chain, the total pool of key players, market classification and segmentation according to the industry trends to the bottom-most level, regional markets, and key developments from both market-and technology-oriented perspectives.
Primary Research
The Barrier Systems market comprises several stakeholders in the supply chain, which include suppliers, processors, and end-product manufacturers. Various primary sources from the supply and demand sides of the markets have been interviewed to obtain qualitative and quantitative information. The primary participants from the demand side include key opinion leaders, executives, managers, directors, and CEOs of companies in the Barrier Systems market. Primary sources from the supply side include associations and institutions involved in the Barrier Systems industry, key opinion leaders, and processing players.
Following is the breakdown of primary respondents—
To know about the assumptions considered for the study, download the pdf brochure
Market Size Estimation
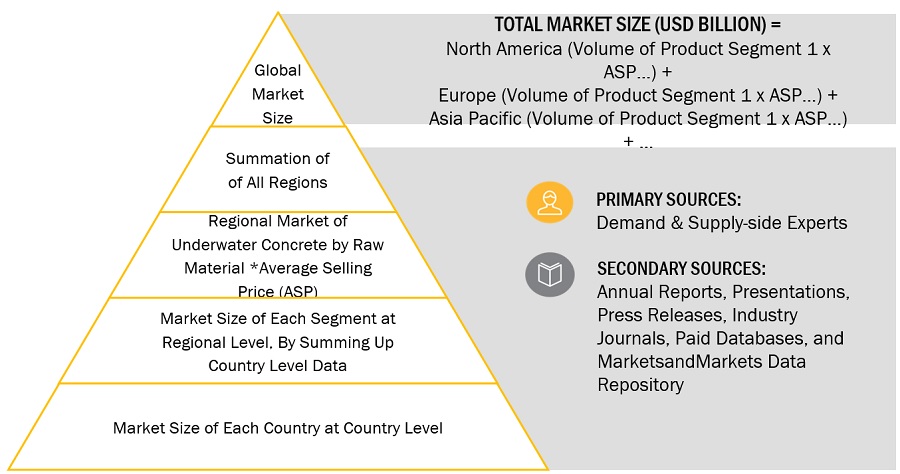
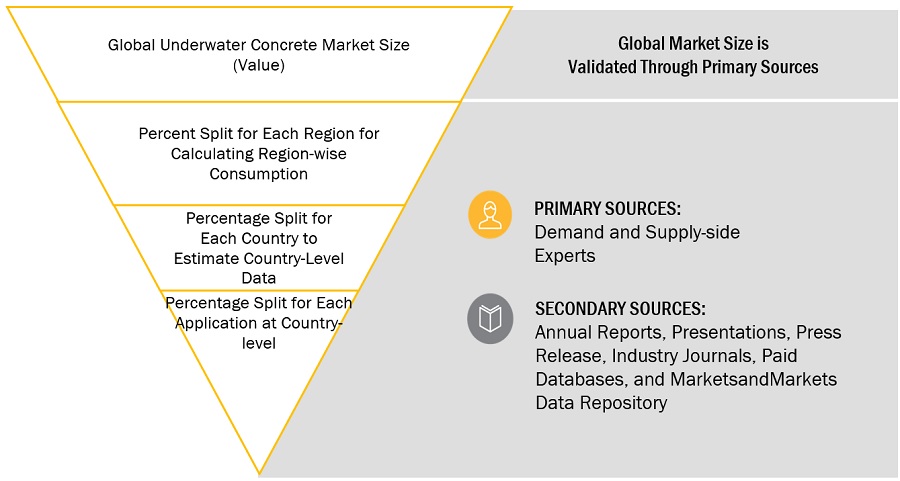
Both top-down and bottom-up approaches were used to estimate and validate the size of the global Barrier Systems market. The research methodology used to estimate the market size includes the following:
- The key players in the industry were identified through extensive secondary research.
- The supply chain of the industry and market size, in terms of value, were determined through primary and secondary research.
- All percentage shares split, and breakdowns were determined using secondary sources and verified through primary sources.
- All possible parameters that affect the markets covered in this research study were accounted for, viewed in extensive detail, verified through primary research, and analyzed to obtain the final quantitative and qualitative data.
- The research includes the study of reports, reviews, and newsletters of key industry players along with extensive interviews with key officials, such as directors and marketing executives.
Market Size Estimation: Bottom-Up Approach
To know about the assumptions considered for the study, Request for Free Sample Report
Market Size Estimation: Top-Down Approach
Data Triangulation
After arriving at the total market size from the estimation process explained above, the overall market was split into several segments and subsegments. To complete the overall market size estimation process and arrive at the exact statistics for all segments and subsegments, the data triangulation and market breakdown procedures have been employed, wherever applicable. The data have been triangulated by studying various factors and trends from both the demand and supply sides. In addition, the market size has been validated by using both the top-down and bottom-up approaches.
Market Definition
Barrier systems refer to structures or devices designed to provide protection or control access to a particular area. These systems are typically used in various industries and settings to prevent unauthorized entry, control traffic flow, enhance security, or provide safety measures. Barrier systems can vary widely depending on their intended purpose, location, and industry requirements. They play a crucial role in maintaining safety, security, and efficient operations in various settings.
Key Stakeholders
- Raw Material Suppliers and Producers
- Regulatory Bodies
- End User
- Research and Development Organizations
- Industrial Associations
- Barrier Systems manufacturers, dealers, traders, and suppliers.
Report Objectives
- To define, describe, and forecast the global Barrier Systems market in terms of value and volume.
- To provide insights regarding the significant factors influencing the growth of the market (drivers, restraints, opportunities, and challenges)
- To analyze and forecast the market based on type, materials, function, access control device, region, and application.
- To forecast the market size, in terms of value and volume, with respect to five main regions: North America, Europe, Asia Pacific, South America, and Middle East & Africa.
- To analyze the opportunities in the market for stakeholders and provide details of the competitive landscape.
- To strategically profile key players in the market.
- To analyze competitive developments in the market, such as new product launches, capacity expansions, and mergers & acquisitions.
- To strategically profile the leading players and comprehensively analyze their key developments in the market.
Available Customizations:
Along with the given market data, MarketsandMarkets offers customizations as per the specific needs of the companies. The following customization options are available for the report:
Product Analysis:
- Product Matrix which gives a detailed comparison of the product portfolio of each company
Regional Analysis:
- Further breakdown of the Rest of the APAC Barrier Systems market
- Further breakdown of the Rest of Europe’s Barrier Systems market
Company Information:
- Detailed analysis and profiling of additional market players (up to 5)


Growth opportunities and latent adjacency in Barrier Systems Market