Bioreactors Market by Scale Range (20L, 1500L), Material (Single-Use, Stainless Steel), Usage (Lab Scale, Pilot Scale, Full Scale), Suppliers (OEMs, EPCs), End-User (R&D Departments, Biopharmaceutical Manufacturers), Region- Global Forecast to 2021


The global bioreactors market size is projected to grow at a CAGR of 6.8%. The increase in adoption of single-use technologies, use of hybrid technologies: single-use and stainless steel, growing popularity of single-use bioreactor among biopharmaceutical companies, and growing biologics are spurring the growth of the bioreactors market. However, regulatory concerns related to single-use bioreactors, issues regarding leachable and extractable related to single-use bags is hampering the growth of this market.
The global bioreactors market is segmented on the basis of end-users, usage, scale, material, control types and suppliers. Furthermore, the geographic analysis covers North America, Europe, Asia-Pacific, and Rest of the World (RoW).
By material, single-use bioreactors are expected to register second highest growth by volume during the forecast period. High growth in this segment is attributed to the advantages of SUBs such as reduced need for cleaning and sterilization, reduced risk of cross contamination, and greater control over aseptic conditions. SUBs increase the quality of the end product by reducing automation complexity. In the case of stainless steel bioreactors, the complexity of the bioreactor increases with the number of in and out points. In stainless steel bioreactors, there are many points that need to be checked for maintenance of valve control or for monitoring temperature. On the other hand, owing to the improved design, SUBs have fewer pipes, valves, and instruments, thus resulting in a need for less monitoring for valve control or temperature. Reduced design complexities in SUBs also eliminate the need for surface cleaning, which in turn eliminates contamination and cross-contamination of cultures which is a major problem while using traditional bioreactors. As a result, the overall manufacturing process with SUBs is simpler than traditional bioreactors.
By control type, the bioreactor market is segmented into manual and automated control type, in terms of volume, the automated control type segment accounted for the largest share of the bioreactors market. In the present scenario, the preference for mass flow controllers (MFCs) is growing, resulting into usage of automated control type. This is because they add additional security assurance and reduce the operating costs of bioreactors. Running bioreactors on MFCs does not require skilled labour. As a result, an increasing number of companies are opting for MFCs.
On the basis of end-user, the bioreactor market has been segmented into R&D departments and biopharmaceutical manufacturers. The R&D departments segment is expected to register the highest growth rate owing to increased bioreactor usage in process development. Contract manufacturing organizations (CMOs) on the other hand are expected to gain traction in the coming years due to rise in outsourcing needs for biologics manufacturers as a result of increased demand of biologics.
By suppliers, the market is segmented into Original Equipment Manufacturers (OEMs), system integrators and Engineering Procurement and Construction (EPCs). OEMs not only supply the equipment but also set up the piping and integration, instrumentation, programing, and control. In 2015, OEMs accounted for the larger market share compared to EPCs.
The North American region accounted for the largest share in the bioreactors market. One of the main factors contributing to this large share is the increase in number of biomanufacturing facilities and investments in this region. Government in North American countries actively supports the biologics production by providing funds to life science R&D.
The bioreactors market is a competitive market with a large number of companies operational in the market. The competitive landscape includes an in-depth market share analysis along with the key business strengths of leading players in the market. Some of the leading players offering bioreactor products are Sartorius AG (Germany), Thermo Fisher Scientific, Inc. (U.S.), Merck KGaA (Germany), GE Healthcare (A subsidiary of General Electric Company) (U.S.), Danaher Corporation (U.S), Eppendorf AG (Germany).
To know about the assumptions considered for the study, download the pdf brochure
The major OEM/system integrator players included in this report are Sartorius AG (Germany), Thermo Fisher Scientific, Inc. (U.S.), Merck KGaA (Germany), GE Healthcare (A subsidiary of General Electric Company) (U.S.), Danaher Corporation (U.S), Eppendorf AG (Germany), and major EPC players included in this report are Amec Foster Wheeler plc (U.K.), Fluor Corporation (U.S.), Jacobs Engineering Group Inc. (U.S.), M+W Group (Germany), PM Group (Ireland), and Technip S.A. (France).
Target Audience
- Vendors/Service Providers
- Research and Consulting Firms
- Research Institutions
- Biopharmaceutical Manufacturers
- Contract Manufacturers
- Contract Research Organizations (CROs)
Bioreactors Market Report Scope
This report categorizes the bioreactors market on the basis of end-users, usage, scale, material, control types and suppliers.
By End-Users:
- R&D Departments
- R&D Institutes
- CROs (Contract Research Organizations)
- Biopharmaceutical Companies
- Biopharmaceutical Manufacturers
- CMOs (Contract Manufacturing Organizations)
- Biopharmaceutical Companies
By Usage
- Lab-Scale Production
- Pilot-Scale Production
- Full-Scale Production
By Scale (In Liters)
- 5L-20L
- 20L-200L
- 200L-1500L
- Above 1500L
By Material
- Glass
- Stainless Steel
- Single-Use
By Control Type
- Manual
- Automated (MFCs)
By Suppliers
- OEMs (Original Equipment Manufacturers)
- System Integrators
- EPCs (Engineering Procurement and Construction)
Available customizations
With the given market data, MarketsandMarkets offers customizations as per the company’s specific needs. The following customization options are available for the report:
Along with market data, we customize the MNM assessments to meet your company’s specific needs. Customize to get a comprehensive summary of the industry standards and a detailed analysis of the following parameters: product analysis, brand/product perception matrix, porters five force’s analysis, regulatory framework, and competitive intelligence.
Frequently Asked Questions (FAQ):
What is the size of Bioreactors Market ?
The global Bioreactors Market size is growing at a CAGR of 6.8%
What are the major growth factors of Bioreactors Market ?
The increase in adoption of single-use technologies, use of hybrid technologies: single-use and stainless steel, growing popularity of single-use bioreactor among biopharmaceutical companies, and growing biologics are spurring the growth of the bioreactors market. However, regulatory concerns related to single-use bioreactors, issues regarding leachable and extractable related to single-use bags is hampering the growth of this market.
Who all are the prominent players of Bioreactors Market ?
The major OEM/system integrator players included in this report are Sartorius AG (Germany), Thermo Fisher Scientific, Inc. (U.S.), Merck KGaA (Germany), GE Healthcare (A subsidiary of General Electric Company) (U.S.), Danaher Corporation (U.S), Eppendorf AG (Germany), and major EPC players included in this report are Amec Foster Wheeler plc (U.K.), Fluor Corporation (U.S.), Jacobs Engineering Group Inc. (U.S.), M+W Group (Germany), PM Group (Ireland), and Technip S.A. (France). .
 Exclusive indicates content/data unique to MarketsandMarkets and not available with any competitors.
Table of Contents
1 Introduction
1.1 Objectives of the Study & Market Definition
1.1.1 Objectives of the Study
1.1.2 Market Definition
2 Executive Summary
2.1 Global Bioreactors Market
2.2 Global Bioreactors Market, By End User
2.3 Global Bioreactor OEMs Market Share, 2015
2.4 Global Bioreactor EPCS Market
2.5 Global Bioreactors Market, By Control Type
3 Market Segmentation
4 Research Methodology
4.1 Research Methodology
4.1.1 Market Size Estimation
4.1.2 End-User Analysis
4.1.3 Supplier Analysis
4.2 Research Methodology: Data Triangulation
4.2.1 Bioreactor Volume Analysis
4.2.2 Bioreactor Volume Analysis
5 Bioreactor Market Volume Analysis: End User Market
5.1 End-User Market - Volume Market Share Analysis, By Region
5.2 End-User Market Volume Market Share Analysis, By End User
5.3 End-User Market Volume Market Share Analysis, By Usage
5.4 End-User Market Volume Market Share Analysis, By Scale
5.5 End-User Market Volume Market Share Analysis, By Material
5.5.1 End-User Market Price Analysis, By Material
5.6 End-User Market Key Insights From Primary Participants
5.6.1 Bioreactors: Key Insights
5.6.2 Bioreactors Market - Trends
5.7 Single-Use Bioreactor Facilities
5.7.1 Recent Expansions Pertaining to Single-Use Bioreactors: 2013-2016
6 Bioreactor Market Volume Analysis: OEM/System Integrator Market
6.1 OEM/System Integrators Market Volume Market Share Analysis
6.2 OEM/System Integrators Market Volume Market Share Analysis, By Region
6.3 OEM/System Integrators Market Key Insights From Primary Participants
7 Bioreactors Market Analysis
7.1 Engineering, Procurement, and Construction Companies Market Volume Market Share Analysis
7.2 Engineering, Procurement, and Construction Companies Market Market Share Analysis, By Region (USD Million)
7.3 Engineering, Procurement, and Construction Companies Market Key Insights From Primary Participants
7.4 Bioreactors Market Greenfield Project and Brownfield Project/Control Type (Units)
7.5 Bioreactors Market Mass Flow Controllers (MFCS)
7.5.1 Mass Flow Controllers (MFCS)
7.5.2 MFCS - Types
7.5.3 MFCS - Users
7.5.4 MFCS - Major Suppliers
7.6 Relative Pricing Key Insights From Primary Participants
7.6.1 Relative Pricing (With U.S. as 100%)
8 Bioreactors Market Company Profiles
(Overview, Products and Services, Financials, Strategy & Development)*
8.1 OEM - Danaher Corporation
8.2 OEM - Eppendorf AG
8.3 OEM - GE Healthcare
8.4 OEM - Merck Millipore Corporation
8.5 OEM - Sartorius AG
8.6 OEM - Thermo Fisher Scientific, Inc.
8.7 OEM - Bioengineering AG
8.8 OEM - Applikon Biotechnology Inc.
8.9 OEM - Praj Hipurity Systems Limited
8.10 OEM - Infors HT
8.11 OEM - Solaris Biotech
8.12 OEM - BBI-Biotech GmbH
*Details on Overview, Products and Services, Financials, Strategy & Development Might Not Be Captured in Case of Unlisted Companies.
9 Bioreactor Market Company Profiles: Engineering Procurement Construction Company Profiles
9.1 List of EPC Companies
9.2 EPC – AMEC Foster Wheeler PLC
9.2.1 Business Overview
9.2.2 Company Snapshot, 2015
9.3 EPC – Fluor Corporation
9.3.1 Business Overview
9.3.2 Company Snapshot, 2015
9.4 EPC – Jacobs Engineering Group Inc.
9.4.1 Business Overview
9.4.2 Company Snapshot, 2015
9.5 EPC – M+W Group
9.5.1 Business Overview
9.5.2 Company Snapshot, 2015
9.6 EPC – PM Group
9.6.1 Business Overview
9.6.2 Company Snapshot, 2015
9.7 EPC – Technip S.A.
9.7.1 Business Overview
9.7.2 Company Snapshot, 2015
9.7.3 Recent Financials, 2015
9.8 EPC – Faithful+Gould Inc.
9.8.1 Business Overview
9.8.2 Company Snapshot, 2015
9.9 EPC – Nne Pharmaplan as
9.9.1 Business Overview
9.9.2 Company Snapshot, 2015
9.9.3 Recent Financials, 2015
9.10 EPC – Flad Architects
9.10.1 Business Overview
9.10.2 Company Snapshot, 2015
9.11 EPC – CRB Consulting Engineers Inc.
9.11.1 Business Overview
9.11.2 Company Snapshot, 2015
List of Tables (37 Tables)
Table 1 Bioreactors Market Share, By End User, 2016 vs 2021 (Volume)
Table 2 Global Bioreactors Market, By Region, 2012-2021 (Units)
Table 3 North America: Bioreactors Market, By Country, 2012-2021 (Units)
Table 4 Global Bioreactors Market, By End User, 2012-2021 (Units)
Table 5 Global Bioreactors Market, By Usage, 2012-2021 (Units)
Table 6 Global Bioreactors Market, By Scale, 2012-2021 (Units)
Table 7 Global Bioreactors Market, By Material, 2012-2021 (Units)
Table 8 Global Bioreactors Market, Price Analysis, 2015 (USD)
Table 9 OEM/System Integrators Market Share Analysis
Table 10 Global Bioreactor Market for OEM/System Integrators, By Region, 2012-2021 (Units)
Table 11 North America: Bioreactor Market for OEM/System Integrators, By Country, 2012-2021 (Units)
Table 12 EPCS Market Share Analysis, By Key Player (Number of Projects Executed Through EPCS From 2005 Till June 2016)
Table 13 Bioreactors Market, By Control Type, 2015
Table 14 Bioreactor Volume for Danaher Corporation, By Usage (Units)
Table 15 Bioreactor Volume for Danaher Corporation, By Scale (Units)
Table 16 Bioreactor Volume for Danaher Corporation, By Region (Units)
Table 17 Bioreactor Volume for Danaher Corporation, By End User (Units)
Table 18 Bioreactor Volume for Eppendorf AG, By Usage (Units)
Table 19 Bioreactors Market Volume for Eppendorf AG, By Scale (Units)
Table 20 Bioreactor Volume for Eppendorf AG, By Region (Units)
Table 21 Bioreactor Volume for Eppendorf AG, By End User (Units)
Table 22 Bioreactor Volume for GE Healthcare, By Usage (Units)
Table 23 Bioreactor Volume for GE Healthcare, By Scale (Units)
Table 24 Bioreactor Volume for GE Healthcare, By Region (Units)
Table 25 Bioreactor Volume for GE Healthcare, By End User (Units)
Table 26 Bioreactor Volume for Merck Millipore Corporation, By Usage (Units)
Table 27 Bioreactor Volume for Merck Millipore Corporation, By Scale (Units)
Table 28 Bioreactor Volume for Merck Millipore Corporation, By Region (Units)
Table 29 Bioreactors Market Volume for Merck Millipore Corporation, By End User (Units)
Table 30 Bioreactor Volume for Sartorius AG, By Usage (Units)
Table 31 Bioreactor Volume for Sartorius AG, By Scale (Units)
Table 32 Bioreactor Volume for Sartorius AG, By Region (Units)
Table 33 Bioreactor Volume for Sartorius AG, By End User (Units)
Table 34 Bioreactor Volume for Thermo Fisher Scientific, Inc., By Usage (Units)
Table 35 Bioreactor Volume for Thermo Fisher Scientific, Inc., By Scale (Units)
Table 36 Bioreactor Volume for Thermo Fisher Scientific, Inc., By Country (Units)
Table 37 Bioreactor Volume for Thermo Fisher Scientific, Inc., By End User (Units)
List of Figures (66 Figures)
Figure 1 Single-Use Bioreactors Market, 2016 vs 2021 (Units)
Figure 2 2015: North America Leads Globally in the Biologics Production Market
Figure 3 2015: Europe is the Leading Supplier of Bioreactors, Globally
Figure 4 2015: Europe Shows the Highest Preference for EPCS, for the Execution of Projects
Figure 5 Bioreactors Market Volume for Danaher Corporation, Business Revenue Mix
Figure 6 Bioreactor Volume for Danaher Corporation, By Usage, 2015 (Units)
Figure 7 Bioreactor Volume for Danaher Corporation, By Scale, 2015 (Units)
Figure 8 Bioreactors Market Volume for Danaher Corporation, By Region (Units)
Figure 9 Bioreactor Volume for Eppendorf AG, By Usage, 2015 (Units)
Figure 10 Bioreactors Market for Eppendorf AG, By Scale, 2015 (Units)
Figure 11 Bioreactor Volume for Eppendorf AG, By Region (Units)
Figure 12 Bioreactor Volume for GE Healthcare, Business Revenue Mix
Figure 13 Bioreactor Volume for GE Healthcare, By Usage, 2015 (Units)
Figure 14 Bioreactor Volume for GE Healthcare, By Scale, 2015 (Units)
Figure 15 Bioreactors Market Volume for GE Healthcare, By Region (Units)
Figure 16 Bioreactor Volume for Merck Millipore Corporation, Business Revenue Mix
Figure 17 Bioreactor Volume for Merck Millipore Corporation, By Usage, 2015 (Units)
Figure 18 Bioreactor Volume for Merck Millipore Corporation, By Scale, 2015 (Units)
Figure 19 Bioreactor Volume for Merck Millipore Corporation, By Region (Units)
Figure 20 Bioreactor Volume for Sartorius AG, Business Revenue Mix
Figure 21 Bioreactors Market Volume for Sartorius AG, By Usage, 2015 (Units)
Figure 22 Bioreactor Volume for Sartorius AG, By Scale, 2015 (Units)
Figure 23 Bioreactor Volume for Sartorius AG, By Region (Units)
Figure 24 Bioreactor Volume for Thermo Fisher Scientific, Business Revenue Mix
Figure 25 Bioreactors Market for Thermo Fisher Scientific, Inc., By Usage,2015 (Units)
Figure 26 Bioreactor Volume for Thermo Fisher Scientific, Inc., By Scale, 2015 (Units)
Figure 27 Bioreactor Volume for Thermo Fisher Scientific, Inc., By Region (Units)
Figure 28 Bioreactor Volume for Bioengineering AG, By Scale, 2015 (Units)
Figure 29 Bioreactors Market Volume for Bioengineering AG, By Region, 2015 (Units)
Figure 30 Bioreactor Volume for Bioengineering AG, By Usage, 2015 (Units)
Figure 31 Bioreactor Volume for Applikon Biotechnology Inc., By Scale, 2015 (Units)
Figure 32 Bioreactors Market for Applikon Biotechnology Inc., By Region, 2015 (Units)
Figure 33 Bioreactor Volume for Applikon Biotechnology Inc., By Usage, 2015 (Units)
Figure 34 Bioreactors Market Volume for Praj Hipurity Systems Limited, By Region, 2015 (Units)
Figure 35 Bioreactor Volume for Infors HT, By Scale, 2015 (Units)
Figure 36 Bioreactor Volume for Infors HT, By Region, 2015 (Units)
Figure 37 Bioreactor Volume for Infors HT, By Usage, 2015 (Units)
Figure 38 Bioreactor Volume for Solaris Biotech, By Scale, 2015 (Units)
Figure 39 Bioreactor Volume for Solaris Biotech, By Region, 2015 (Units)
Figure 40 Bioreactors Market Volume for Solaris Biotech, By Usage, 2015 (Units)
Figure 41 Bioreactor Volume for BBI-Biotech GmbH, By Scale, 2015 (Units)
Figure 42 Bioreactor Volume for BBI-Biotech GmbH, By Region, 2015 (Units)
Figure 43 Bioreactors Market Volume BBI-Biotech GmbH, By Usage, 2015 (Units)
Figure 44 Bioreactor Volume for AMEC Foster Wheeler PLC, By Region, 2015 (Units)
Figure 45 Bioreactor Volume for AMEC Foster Wheeler PLC, By Usage, 2015 (Units)
Figure 46 Bioreactors Market Volume for Fluor Corporation, Business Revenue Mix, 2015
Figure 47 Bioreactor Volume for Fluor Corporation, By Region, 2015 (Units)
Figure 48 Bioreactor Volume for Fluor Corporation, By Usage, 2015 (Units)
Figure 49 Bioreactor Volume for Jacobs Engineering Group Inc., Business Revenue Mix, 2015
Figure 50 Bioreactor Volume for Jacobs Engineering Group Inc., By Region, 2015 (Units)
Figure 51 Bioreactors Market Volume for Jacobs Engineering Group Inc., By Usage, 2015 (Units)
Figure 52 Bioreactor Volume for M+W Group, By Region, 2015 (Units)
Figure 53 Bioreactor Volume for M+W Group, By Usage, 2015 (Units)
Figure 54 Bioreactor Volume for PM Group, By Region, 2015 (Units)
Figure 55 Bioreactors Market Volume for PM Group, By Usage, 2015 (Units)
Figure 56 Bioreactor Volume for Technip S.A., Business Revenue Mix, 2015
Figure 57 Bioreactor Volume for Technip S.A., By Region, 2015 (Units)
Figure 58 Bioreactors Market for Technip S.A., By Usage, 2015 (Units)
Figure 59 Bioreactor Volume for Faithful+Gould Inc., By Region, 2015 (Units)
Figure 60 Bioreactor Volume for Faithful+Gould Inc., By Usage, 2015 (Units)
Figure 61 Bioreactor Volume for Nne Pharmaplan As, By Region, 2015 (Units)
Figure 62 Bioreactors Market Volume for Nne Pharmaplan As, By Usage, 2015 (Units)
Figure 63 Bioreactor Volume for Flad Architects, By Region, 2015 (Units)
Figure 64 Bioreactors Market for Flad Architects, By Usage, 2015 (Units)
Figure 65 Bioreactor Volume for CRB Consulting Engineers Inc., By Region, 2015 (Units)
Figure 66 Bioreactors Market Volume for CRB Consulting Engineers Inc., By Usage, 2015 (Units)
The objective of this report is to define, describe, and forecast the market on the basis of usage, scale, material, control type, end-user and region. It provides detailed information regarding the major factors influencing the growth of the market. Drivers, restraints, opportunities, challenges, and trends in the market have also been taken consideration while preparing this report. This report also tracks and analyzes competitive developments of the key players in terms of market developments, product portfolios, market share analysis, and financials.
Research Methodology
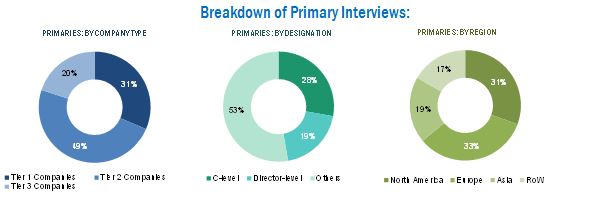
Top-down and bottom-up approaches were used to validate the size of the global bioreactors market and estimate the size of various other dependent submarkets. Major players in the market were identified through secondary research and their market revenues were determined through primary and secondary research. Secondary research included the study of the annual and financial reports of top market players, whereas primary research included extensive interviews with the key opinion leaders such as CEOs, directors, and marketing executives. The percentage splits, shares, and breakdowns of the product markets were determined using secondary sources and verified through primary sources. This data is consolidated and added to detailed inputs and analysis from MarketsandMarkets and presented in this report. Some of the secondary resources we referred are U.S. Food and Drug Administration, Bioprocess International, Biopharma International Supplement, Pharmaceutical Technology Europe, and The World Bank.
To speak to our analyst for a discussion on the above findings, click Speak to Analyst

 Generating Response ...


Growth opportunities and latent adjacency in Bioreactors Market