Blow Molding Resins Market by Type (Polyethylene, Polypropylene, Polyvinyl Chloride, Polyvinyl Terephthalate), Application (Packaging, Automotive & Transportation, Construction & Infrastructure), and Region - Global Forecast to 2022


[164 Pages Report] blow molding resins market was valued at USD 35.15 Billion in 2016 and is projected to reach USD 51.95 Billion by 2022, at a CAGR of 7.2% during the forecast period. In this report, 2016 has been considered the base year and the forecast period is considered from 2017 to 2022.
The objectives of this study are:
- To define, describe, and analyze the blow molding resins market on the basis of type, application, and region
- To forecast and analyze the size of the blow molding resins market (in terms of volume and value) in five key regions, namely, Asia Pacific, Europe, North America, South America, and Middle East & Africa
- To forecast and analyze the blow molding resins market (in terms of volume and value) at the country level in each region
- To strategically analyze each submarket with respect to individual growth trends and its contribution to the blow molding resins market
- To analyze opportunities in the blow molding resins market for stakeholders by identifying high-growth segments
- To identify the significant market trends and factors driving or inhibiting the growth of the blow molding resins market and its submarkets
- To analyze competitive developments, such as expansions, joint ventures, new products launches, and acquisitions in the blow molding resins market
- To strategically profile the key players of the blow molding resins market and comprehensively analyze their growth strategies
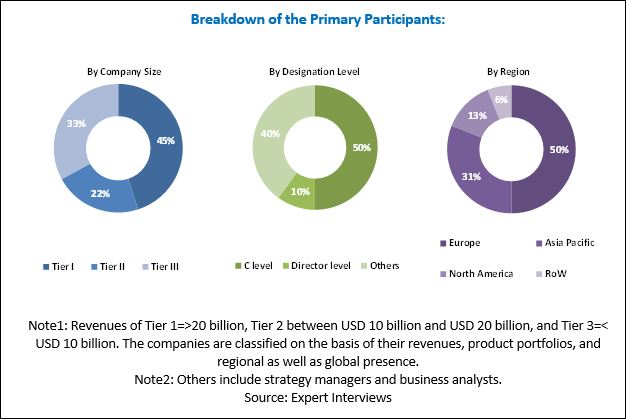
This research study involves the extensive use of secondary sources, directories, and databases such as Hoovers, Bloomberg BusinessWeek, and Factiva to identify and collect information useful for this technical, market-oriented, and commercial study of the blow molding resins market. The primary sources that have been considered mainly include several industry experts from the core and related industries and preferred suppliers, manufacturers, distributors, service providers, and organizations related to all segments of the industry�s supply chain. After arriving at the overall market size, the total market has been split into several segments and subsegments. The figure below illustrates the breakdown of the primary interviews based on company type, designation, and region conducted during this research study on the blow molding resins market:
To know about the assumptions considered for the study, download the pdf brochure
Exxon Mobil (US), LyondellBasell (Netherlands), DowDuPont (US), SABIC (Saudi Arabia), INEOS (Switzerland), Solvay (Belgium), Formosa Plastics (Taiwan), Chevron (US), Eastman (US), China Petroleum (China), and Reliance Industries (India), among others are the key players operating in the blow molding resins market.
The target audiences for the blow molding resins market report are as follows:
- Manufacturers of Blow Molding Resins
- Blow Molding Resin Compounders(those who prepare plastic formulations by mixing or/and blending polymers and additives into process ready pellets)
- Blow Molding Resin Converters (those who convert plastic resins and compounds into finished products)
- End-use Industries, such as Pharmaceutical, Food & Beverages, Personal Care, and Chemical, among others
�This study answers several questions for stakeholders, primarily, which market segments they need to focus upon during the next two to five years to prioritize their efforts and investments.�
Scope of the Report
This report categorizes the blow molding resins market on the basis of type, application, and region.
Blow Molding Resins Market, by Type:
The blow molding resins market has been segmented on the basis of the type into:
- Polyethylene
- Polypropylene
- Polyvinyl Chloride
- Polyethylene Terephthalate
- Others
Blow Molding Resins Market, by Application:
The blow molding resins market has been segmented on the basis of the end-use industry into:
- Packaging
- Automotive & Transportation
- Construction & Infrastructure
- Others
Blow Molding Resins Market, by Region:
The blow molding resins market has been segmented on the basis of the region into:
- Asia Pacific
- North America
- Europe
- South America
- Middle East and Africa
Available Customizations:
With the given market data, MarketsandMarkets offers customizations according to the specific needs of companies. The following customization options are available for the report:
Regional Analysis
- Further breakdown of a region to the country level with additional end-use industries and/or types and their subsegments
Country Information
- Additional country information (up to 3)
Company Information
- Detailed analysis and profiles of additional market players (up to 5)
The blow molding resins market was valued at USD 36.67 Billion in 2017 and is projected to reach USD 51.95 Billion by 2022, at a CAGR of 7.2% from 2017 to 2022. The increased demand for blow molding resins in the packaging applications of the pharmaceutical, food & beverages, chemicals, and personal care industries is expected to drive the growth of the blow molding resins market during the forecast period.
The blow molding resins market has been classified on the basis of type into polyethylene, polypropylene, polyvinyl chloride, polyethylene terephthalate, and others. Among types, the polyethylene segment of the blow molding resins market is projected to grow at the highest CAGR during the forecast period. The growth of this segment of the market can be attributed to its excellent properties such as high stiffness and Environmental Stress Cracking Resistance (ESCR), high load melt strength, and excellent rigidity. High density polyethylene is prominently used for the applications in blow molding.
On the basis of applications, the blow molding resins market has been classified into packaging, automotive & transportation, construction & infrastructure, and others. Among applications, the packaging segment of the blow molding resins market is projected to grow at the highest CAGR during the forecast period. Food & beverages, pharmaceutical, chemical, and personal care industries are major consumers of blow molded products in packaging applications, which are used to produce bottles, cans, and containers.
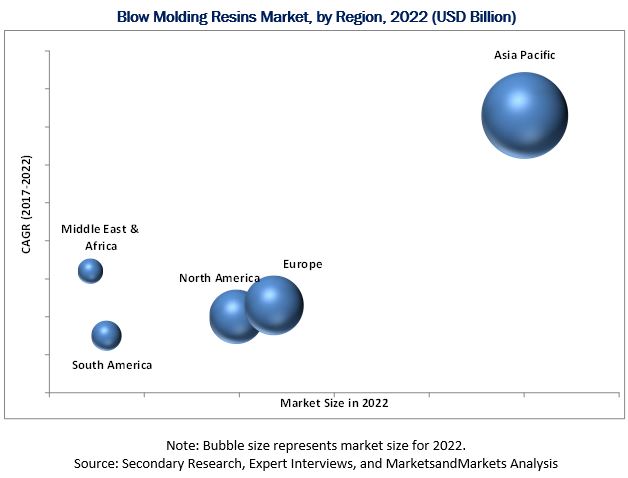
The Asia Pacific region is the largest market for blow molding resins across the globe. The Asia Pacific blow molding resins market is projected to grow at the highest CAGR between 2017 and 2022. The growth of the Asia Pacific blow molding resins market can be attributed to the presence of various applications of blow molding resins in the region and increasing demand for blow molding resins from applications, such as packaging, automotive & transportation, from countries, such as China, Japan, and India.
The major factors challenging the growth of the blow molding resins market across the globe are the fluctuations in crude oil prices. The fluctuating feedstocks prices have a direct impact on the profitability and scalability of blow molding resin suppliers, which was evident during the fall of crude oil prices.
Some of the key players operating in the blow molding resins market are Exxon Mobil (US), LyondellBasell (Netherlands), DowDuPont (US), SABIC (Saudi Arabia), INEOS (Switzerland), Solvay (Belgium), Formosa Plastics (Taiwan), Chevron (US), Eastman (US), China Petroleum (China), and Reliance Industries (India).
To speak to our analyst for a discussion on the above findings, click Speak to Analyst
 Exclusive indicates content/data unique to MarketsandMarkets and not available with any competitors.
Table of Contents
1 Introduction (Page No. - 16)
1.1 Objectives of the Study
1.2 Market Definition
1.3 Market Scope
1.3.1 Years Considered for the Study
1.4 Currency
1.5 Limitations
1.6 Stakeholders
2 Research Methodology (Page No. - 20)
2.1 Research Data
2.1.1 Secondary Data
2.1.1.1 Key Data From Secondary Sources
2.1.2 Primary Data
2.1.2.1 Key Data From Primary Sources
2.1.2.2 Key Industry Insights
2.1.2.3 Breakdown of Primary Interviews
2.2 Market Size Estimation
2.2.1 Bottom-Up Approach
2.2.2 Top-Down Approach
2.3 Data Triangulation
2.4 Research Assumptions
3 Executive Summary (Page No. - 28)
4 Premium Insights (Page No. - 32)
4.1 Attractive Opportunities in Blow Molding Resins Market
4.2 Blow Molding Resins Market, By Type
4.3 Blow Molding Resins Market, By Application & By Region
4.4 Blow Molding Resins Market Attractiveness
5 Market Overview (Page No. - 35)
5.1 Introduction
5.2 Market Dynamics
5.2.1 Drivers
5.2.1.1 High Demand for Blow Molding Resins in Packaging Industry
5.2.1.2 Automotive Light-Weighting Driving the Demand for Blow Molding Resins
5.2.2 Restraint
5.2.2.1 Fluctuation in Crude Oil Prices Hampering the Growth of Blow Molding Resins Market
5.2.3 Opportunity
5.2.3.1 High Demand for Blow Molding Resins in Emerging Countries of APAC Creates Lucrative Growth Opportunities
5.2.4 Challenge
5.2.4.1 Weak Economic Conditions in South America
5.3 Porter�s Five Forces Analysis
5.3.1 Threat of New Entrants
5.3.2 Threat of Substitutes
5.3.3 Bargaining Power of Suppliers
5.3.4 Bargaining Power of Buyers
5.3.5 Intensity of Competitive Rivalry
5.4 Macroeconomic Indicators
5.4.1 Introduction
5.4.2 Global GDP Per Capita Outlook, By Country (USD)
5.4.3 Global Automotive Production
6 Blow Molding Resins Market, By Type (Page No. - 44)
6.1 Introduction
6.2 Polyethylene
6.3 Polypropylene
6.4 Polyvinyl Chloride
6.5 Polyethylene Terephthalate
6.6 Others
7 Blow Molding Resins Market, By Application (Page No. - 54)
7.1 Introduction
7.2 Packaging
7.3 Automotive & Transportation
7.4 Construction & Infrastructure
7.5 Others
8 Blow Molding Resins Market, By Region (Page No. - 63)
8.1 Introduction
8.2 APAC
8.2.1 China
8.2.2 Japan
8.2.3 India
8.2.4 Thailand
8.2.5 Indonesia
8.2.6 Rest of APAC
8.3 Europe
8.3.1 Western Europe
8.3.1.1 Germany
8.3.1.2 Italy
8.3.1.3 France
8.3.1.4 Spain
8.3.1.5 UK
8.3.1.6 Rest of Western Europe
8.3.2 Central & Eastern Europe
8.3.2.1 Russia
8.3.2.2 Turkey
8.3.2.3 Rest of Central & Eastern Europe
8.4 North America
8.4.1 US
8.4.2 Canada
8.4.3 Mexico
8.5 Middle East & Africa
8.5.1 Iran
8.5.2 Saudi Arabia
8.5.3 Rest of Middle East & Africa
8.6 South America
8.6.1 Brazil
8.6.2 Argentina
8.6.3 Rest of South America
9 Competitive Landscape (Page No. - 124)
9.1 Overview
9.2 Market Ranking Analysis
9.3 Competitive Scenario
9.3.1 Expansions
9.3.2 Acquisitions
9.3.3 New Product Developments
9.3.4 Joint Ventures
10 Company Profiles (Page No. - 129)
10.1 Exxon Mobil
10.1.1 Business Overview
10.1.2 Products Offered
10.1.3 Recent Developments
10.1.4 SWOT Analysis
10.1.5 MnM View
10.2 Lyondellbasell Industries Holdings B.V.
10.2.1 Business Overview
10.2.2 Products Offered
10.2.3 Recent Developments
10.2.4 SWOT Analysis
10.2.5 MnM View
10.3 Dowdupont
10.3.1 Business Overview
10.3.2 Products Offered
10.3.3 Recent Developments
10.3.4 SWOT Analysis
10.3.5 MnM View
10.4 Sabic
10.4.1 Business Overview
10.4.2 Products Offered
10.4.3 Recent Developments
10.4.4 SWOT Analysis
10.4.5 MnM View
10.5 Ineos Group Holdings S.A.
10.5.1 Business Overview
10.5.2 Products Offered
10.5.3 Recent Developments
10.5.4 MnM View
10.6 China Petroleum Corporation
10.6.1 Business Overview
10.6.2 Products Offered
10.6.3 MnM View
10.7 Solvay
10.7.1 Business Overview
10.7.2 Products Offered
10.7.3 MnM View
10.8 Eastman Chemical Company
10.8.1 Business Overview
10.8.2 Products Offered
10.8.3 Recent Developments
10.8.4 MnM View
10.9 Formosa Plastics Group (FPG)
10.9.1 Business Overview
10.9.2 Products Offered
10.9.3 Recent Developments
10.9.4 MnM View
10.10 Chevron Corporation
10.10.1 Business Overview
10.10.2 Products Offered
10.10.3 Recent Developments
10.10.4 MnM View
10.11 Qenos Pty Ltd
10.11.1 Business Overview
10.11.2 Products Offered
10.11.3 MnM View
10.12 Other Key Players
10.12.1 Lanxess
10.12.2 Eastman Chemical Company
10.12.3 Versalis S.P.A.
10.12.4 BASF SE
10.12.5 Reliance Industries Limited
10.12.6 Westlake Chemical Corporation
10.12.7 Braskem
10.12.8 Haldia Petrochemicals Limited
10.12.9 AGC Chemicals Americas Inc.
10.12.10 LG Chem
10.12.11 The Chemours Company
10.12.12 Shin�Etsu Chemical Co. Ltd
10.12.13 Lotte Chemical UK Ltd
10.12.14 EMS-Chemie Holding AG
11 Appendix (Page No. - 155)
11.1 Insights From Industry Experts
11.2 Discussion Guide
11.3 Knowledge Store: Marketsandmarkets� Subscription Portal
11.4 Introducing RT: Real-Time Market Intelligence
11.5 Author Details
List of Tables (156 Tables)
Table 1 Per Capita GDP Outlook By Country
Table 2 Global Vehicle Production (Units)
Table 3 Blow Molding Resins Market Size, By Type, 2015�2022 (Kiloton)
Table 4 Blow Molding Resins Market Size, By Type, 2015�2022 (USD Million)
Table 5 Polyethylene Market Size, By Region, 2015�2022 (Kiloton)
Table 6 Polyethylene Market Size, By Region, 2015�2022 (USD Million)
Table 7 Polypropylene Market Size, By Region, 2015�2022 (Kiloton)
Table 8 Polypropylene Market Size, By Region, 2015�2022 (USD Million)
Table 9 Polyvinyl Chloride Market Size, By Region, 2015�2022 (Kiloton)
Table 10 Polyvinyl Chloride Market Size, By Region, 2015�2022 (USD Million)
Table 11 Polyethylene Terephthalate Market Size, By Region, 2015�2022 (Kiloton)
Table 12 Polyethylene Terephthalate Market Size, By Region, 2015�2022 (USD Million)
Table 13 Other Blow Molding Resins Market Size, By Region, 2015�2022 (Kiloton)
Table 14 Other Blow Molding Resins Market Size, By Region, 2015�2022 (USD Million)
Table 15 Blow Molding Resins Market Size, By Application, 2015�2022 (Kiloton)
Table 16 By Market Size, By Application, 2015�2022 (USD Million)
Table 17 By Market Size in Packaging, By Region, 2015�2022 (Kiloton)
Table 18 By Market Size in Packaging, By Region, 2015�2022 (USD Million)
Table 19 By Market Size in Automotive & Transportation, By Region, 2015�2022 (Kiloton)
Table 20 By Market Size in Automotive & Transportation, By Region, 2015�2022 (USD Million)
Table 21 By Market Size in Construction & Infrastructure, By Region, 2015�2022 (Kiloton)
Table 22 By Market Size in Construction & Infrastructure, By Region, 2015�2022 (USD Million)
Table 23 By Market Size in Other Applications, By Region, 2015�2022 (Kiloton)
Table 24 By Market Size in Other Applications, By Region, 2015�2022 (USD Million)
Table 25 By Market Size, By Region, 2015�2022 (Kiloton)
Table 26 By Market Size, By Region, 2015�2022 (USD Million)
Table 27 APAC: By Market Size, By Country, 2015�2022 (Kiloton)
Table 28 APAC: By Market Size, By Country, 2015�2022 (USD Million)
Table 29 APAC: By Market Size, By Type, 2015�2022 (Kiloton)
Table 30 APAC: By Market Size, By Type, 2015�2022 (USD Million)
Table 31 APAC: By Market Size, By Application, 2015�2022 (Kiloton)
Table 32 APAC: By Market Size, By Application, 2015�2022 (USD Million)
Table 33 China: By Market Size, By Type, 2015�2022 (Kiloton)
Table 34 China: By Market Size, By Type, 2015�2022 (USD Million)
Table 35 China: By Market Size, By Application, 2015�2022 (Kiloton)
Table 36 China: By Market Size, By Application, 2015�2022 (USD Million)
Table 37 Japan: Blow Molding Resins Market Size, By Type, 2015�2022 (Kiloton)
Table 38 Japan: By Market Size, By Type, 2015�2022 (USD Million)
Table 39 Japan: By Market Size, By Application, 2015�2022 (Kiloton)
Table 40 Japan: By Market Size, By Application, 2015�2022 (USD Million)
Table 41 India: Blow Molding Resins Market Size, By Type, 2015�2022 (Kiloton)
Table 42 India: By Market Size, By Type, 2015�2022 (USD Million)
Table 43 India: By Market Size, By Application, 2015�2022 (Kiloton)
Table 44 India: By Market Size, By Application, 2015�2022 (USD Million)
Table 45 Thailand: Blow Molding Resins Market Size, By Type, 2015�2022 (Kiloton)
Table 46 Thailand: By Market Size, By Type, 2015�2022 (USD Million)
Table 47 Thailand: By Market Size, By Application, 2015�2022 (Kiloton)
Table 48 Thailand: By Market Size, By Application, 2015�2022 (USD Million)
Table 49 Indonesia: Blow Molding Resins Market Size, By Type, 2015�2022 (Kiloton)
Table 50 Indonesia: By Market Size, By Type, 2015�2022 (USD Million)
Table 51 Indonesia: By Market Size, By Application, 2015�2022 (Kiloton)
Table 52 Indonesia: By Market Size, By Application, 2015�2022 (USD Million)
Table 53 Rest of APAC: Blow Molding Resins Market Size, By Type, 2015�2022 (Kiloton)
Table 54 Rest of APAC: By Market Size, By Type, 2015�2022 (USD Million)
Table 55 Rest of APAC: By Market Size, By Application, 2015�2022 (Kiloton)
Table 56 Rest of APAC: By Market Size, By Application, 2015�2022 (USD Million)
Table 57 Europe: Blow Molding Resins Market Size, By Country, 2015�2022 (Kiloton)
Table 58 Europe: By Market Size, By Country, 2015�2022 (USD Million)
Table 59 Europe: By Market Size, By Type, 2015�2022 (Kiloton)
Table 60 Europe: By Market Size, By Type, 2015�2022 (USD Million)
Table 61 Europe: By Market Size, By Application, 2015�2022 (Kiloton)
Table 62 Europe: By Market Size, By Application, 2015�2022 (USD Million)
Table 63 Germany: By Market Size, By Type, 2015�2022 (Kiloton)
Table 64 Germany: By Market Size, By Type, 2015�2022 (USD Million)
Table 65 Germany: By Market Size, By Application, 2015�2022 (Kiloton)
Table 66 Germany: By Market Size, By Application, 2015�2022 (USD Million)
Table 67 Italy: By Market Size, By Type, 2015�2022 (Kiloton)
Table 68 Italy: By Market Size, By Type, 2015�2022 (USD Million)
Table 69 Italy: By Market Size, By Application, 2015�2022 (Kiloton)
Table 70 Italy: By Market Size, By Application, 2015�2022 (USD Million)
Table 71 France: By Market Size, By Type, 2015�2022 (Kiloton)
Table 72 France: By Market Size, By Type, 2015�2022 (USD Million)
Table 73 France: By Market Size, By Application, 2015�2022 (Kiloton)
Table 74 France: By Market Size, By Application, 2015�2022 (USD Million)
Table 75 Spain: By Market Size, By Type, 2015�2022 (Kiloton)
Table 76 Spain: By Market Size, By Type, 2015�2022 (USD Million)
Table 77 Spain: By Market Size, By Application, 2015�2022 (Kiloton)
Table 78 Spain: By Market Size, By Application, 2015�2022 (USD Million)
Table 79 UK: By Market Size, By Type, 2015�2022 (Kiloton)
Table 80 UK: By Market Size, By Type, 2015�2022 (USD Million)
Table 81 UK: By Market Size, By Application, 2015�2022 (Kiloton)
Table 82 UK: By Market Size, By Application, 2015�2022 (USD Million)
Table 83 Rest of Western Europe: By Market Size, By Type, 2015�2022 (Kiloton)
Table 84 Rest of Western Europe: By Market Size, By Type, 2015�2022 (USD Million)
Table 85 Rest of Western Europe: By Market Size, By Application, 2015�2022 (Kiloton)
Table 86 Rest of Western Europe: By Market Size, By Application, 2015�2022 (USD Million)
Table 87 Russia: By Market Size, By Type, 2015�2022 (Kiloton)
Table 88 Russia: By Market Size, By Type, 2015�2022 (USD Million)
Table 89 Russia: By Market Size, By Application, 2015�2022 (Kiloton)
Table 90 Russia: By Market Size, By Application, 2015�2022 (USD Million)
Table 91 Turkey: By Market Size, By Type, 2015�2022 (Kiloton)
Table 92 Turkey: By Market Size, By Type, 2015�2022 (USD Million)
Table 93 Turkey: By Market Size, By Application, 2015�2022 (Kiloton)
Table 94 Turkey: By Market Size, By Application, 2015�2022 (USD Million)
Table 95 Rest of Central & Eastern Europe: Market Size, By Type, 2015�2022 (Kiloton)
Table 96 Rest of Central & Eastern Europe: By Market Size, By Type, 2015�2022 (USD Million)
Table 97 Rest of Central & Eastern Europe: By Market Size, By Application, 2015�2022 (Kiloton)
Table 98 Rest of Central & Eastern Europe: By Market Size, By Application, 2015�2022 (USD Million)
Table 99 North America: By Market Size, By Country, 2015�2022 (Kiloton)
Table 100 North America: By Market Size, By Country, 2015�2022 (USD Million)
Table 101 North America: By Market Size, By Type, 2015�2022 (Kiloton)
Table 102 North America: By Market Size, By Type, 2015�2022 (USD Million)
Table 103 North America: By Market Size, By Application, 2015�2022 (Kiloton)
Table 104 North America: By Market Size, By Application, 2015�2022 (USD Million)
Table 105 US: By Market Size, By Type, 2015�2022 (Kiloton)
Table 106 US: By Market Size, By Type, 2015�2022 (USD Million)
Table 107 US: By Market Size, By Application, 2015�2022 (Kiloton)
Table 108 US: By Market Size, By Application, 2015�2022 (USD Million)
Table 109 Canada: By Market Size, By Type, 2015�2022 (USD Kiloton)
Table 110 Canada: By Market Size, By Type, 2015�2022 (USD Million)
Table 111 Canada: By Market Size, By Application, 2015�2022 (Kiloton)
Table 112 Canada: By Market Size, By Application, 2015�2022 (USD Million)
Table 113 Mexico: By Market Size, By Type, 2015�2022 (Kiloton)
Table 114 Mexico: By Market Size, By Type, 2015�2022 (USD Million)
Table 115 Mexico: By Market Size, By Application, 2015�2022 (Kiloton)
Table 116 Mexico: By Market Size, By Application, 2015�2022 (USD Million)
Table 117 Middle East & Africa: By Market Size, By Country, 2015�2022 (Kiloton)
Table 118 Middle East & Africa: By Market Size, By Country, 2015�2022 (USD Million)
Table 119 Middle East & Africa: By Market Size, By Type, 2015�2022 (Kiloton)
Table 120 Middle East & Africa: By Market Size, By Type, 2015�2022 (USD Million)
Table 121 Middle East & Africa: By Market Size, By Application, 2015�2022 (Kiloton)
Table 122 Middle East & Africa: By Market Size, By Application, 2015�2022 (USD Million)
Table 123 Iran: By Market Size, By Type, 2015�2022 (Kiloton)
Table 124 Iran: By Market Size, By Type, 2015�2022 (USD Million)
Table 125 Iran: By Market Size, By Application, 2015�2022 (Kiloton)
Table 126 Iran: By Market Size, By Application, 2015�2022 (USD Million)
Table 127 Saudi Arabia: By Market Size, By Type, 2015�2022 (Kiloton)
Table 128 Saudi Arabia: By Market Size, By Type, 2015�2022 (USD Million)
Table 129 Saudi Arabia: By Market Size, By Application, 2015�2022 (Kiloton)
Table 130 Saudi Arabia: By Market Size, By Application, 2015�2022 (USD Million)
Table 131 Rest of Middle East & Africa: By Market Size, By Type, 2015�2022 (Kiloton)
Table 132 Rest of Middle East & Africa: By Market Size, By Type, 2015�2022 (USD Million)
Table 133 Rest of Middle East & Africa: By Market Size, By Application, 2015�2022 (Kiloton)
Table 134 Rest of Middle East & Africa: By Market Size, By Application, 2015�2022 (USD Million)
Table 135 South America: By Market Size, By Country, 2015�2022 (Kiloton)
Table 136 South America: By Market Size, By Country, 2015�2022 (USD Million)
Table 137 South America: By Market Size, By Type, 2015�2022 (Kiloton)
Table 138 South America: By Market Size, By Type, 2015�2022 (USD Million)
Table 139 South America: By Market Size, By Application, 2015�2022 (Kiloton)
Table 140 South America: By Market Size, By Application, 2015�2022 (USD Million)
Table 141 Brazil: By Market Size, By Type, 2015�2022 (Kiloton)
Table 142 Brazil: By Market Size, By Type, 2015�2022 (USD Million)
Table 143 Brazil: By Market Size, By Application, 2015�2022 (Kiloton)
Table 144 Brazil: By Market Size, By Application, 2015�2022 (USD Million)
Table 145 Argentina: By Market Size, By Type, 2015�2022 (Kiloton)
Table 146 Argentina: By Market Size, By Type, 2015�2022 (USD Million)
Table 147 Argentina: By Market Size, By Application, 2015�2022 (Kiloton)
Table 148 Argentina: By Market Size, By Application, 2015�2022 (USD Million)
Table 149 Rest of South America: By Market Size, By Type, 2015�2022 (Kiloton)
Table 150 Rest of South America: By Market Size, By Type, 2015�2022 (USD Million)
Table 151 Rest of South America: By Market Size, By Application, 2015�2022 (Kiloton)
Table 152 Rest of South America: By Market Size, By Application, 2015�2022 (USD Million)
Table 153 Expansions, 2012�2017
Table 154 Acquisitions, 2012�2017
Table 155 New Product Developments, 2012�2017
Table 156 Joint Ventures, 2012�2017
List of Figures (43 Figures)
Figure 1 Blow Molding Resins Market Segmentation
Figure 2 Blow Molding Resins Market: Research Design
Figure 3 Market Size Estimation: Bottom-Up Approach
Figure 4 Market Size Estimation: Top-Down Approach
Figure 5 Blow Molding Resins Market: Data Triangulation
Figure 6 Packaging to Be the Largest and Fastest-Growing Application of Blow Molding Resins, 2017�2022
Figure 7 Polyethylene Blow Molding Resins to Dominate the Market, 2017�2022
Figure 8 APAC Dominated the Blow Molding Resins Market in 2016
Figure 9 Blow Molding Resins Market to Witness Moderate Growth During Forecast Period
Figure 10 Polyethylene to Be the Largest Blow Molding Resins Market Type Between 2017 and 2022
Figure 11 Packaging Application and APAC Accounted for the Largest Market Share in Blow Molding Resins Market in 2016
Figure 12 Blow Molding Resins to Register High CAGR in APAC and North America Between 2017 and 2022
Figure 13 Drivers, Restraints, Opportunities, and Challenges in the Blow Molding Resins Market
Figure 14 Porter�s Five Forces Analysis for Blow Molding Resins Market
Figure 15 Per Capita Plastic Consumption
Figure 16 Global Industrial Production Outlook
Figure 17 Polyethylene to Be the Fastest-Growing Segment of Blow Molding Resins Market Between 2017 and 2022
Figure 18 APAC to Be the Largest Market of Polyethylene Between 2017 and 2022
Figure 19 APAC to Be the Fastest-Growing Market of Polypropylene Between 2017 and 2022
Figure 20 APAC to Be the Largest Market for Polyvinyl Chloride Between 2017 and 2022
Figure 21 APAC to Be the Largest Market of Polyethylene Terephthalate Between 2017 and 2022
Figure 22 APAC to Be the Largest Market of Polyethylene Terephthalate Between 2017 and 2022
Figure 23 Packaging to Be the Largest Application in Blow Molding Resins Market Between 2017 and 2022
Figure 24 APAC to Be the Largest Market of Blow Molding Resins in Packaging Application During Forecast Period
Figure 25 APAC to Be the Largest Market of Blow Molding Resins in the Automotive & Transportation Application During the Forecast Period
Figure 26 APAC to Be the Largest Market of Blow Molding Resins in Construction & Infrastructure Application During Forecast Period
Figure 27 APAC to Be the Largest Market of Blow Molding Resins in Other Applications During Forecast Period
Figure 28 Regional Snapshot: India and China to Emerge as New Strategic Destinations for Blow Molding Resins Market
Figure 29 APAC Market Snapshot
Figure 30 Europe Market Snapshot
Figure 31 North America Market Snapshot
Figure 32 Middle East & Africa Market Snapshot: Iran and Saudi Arabia to Create Lucrative Growth Opportunities in Blow Molding Resins Market
Figure 33 Brazil is the Largest and the Fastest-Growing Market
Figure 34 Companies Primarily Adopted Organic Growth Strategies (2012-2017)
Figure 35 Blow Molding Resins Market Ranking, 2016
Figure 36 Exxon Mobil: Company Snapshot
Figure 37 Lyondellbasell Industries Holdings B.V.: Company Snapshot
Figure 38 Sabic: Company Snapshot
Figure 39 Ineos Group Holdings S.A.: Company Snapshot
Figure 40 China Petroleum Corporation: Company Snapshot
Figure 41 Solvay: Company Snapshot
Figure 42 Eastman Chemical Company: Company Snapshot
Figure 43 Chevron Corporation: Company Snapshot


Growth opportunities and latent adjacency in Blow Molding Resins Market