Carbon Fiber Construction Repair Market

Carbon Fiber Construction Repair Market by Product Type (Rebar, Fabric, Plate), Application (Residential & Commercial Building, Infrastructure, Industrial), and Region (North America, Europe, APAC, Latin America, MEA) - Global Forecast to 2028

Report Code: CH 8835 Oct, 2023, by marketsandmarkets.com

Updated on : March 20, 2024

Carbon Fiber Construction Repair Market

The global carbon fiber construction repair market size was valued at USD 119 million in 2023 and is projected to reach USD 192 million by 2028, growing at 10.0% cagr from 2023 to 2028. Carbon fiber products are used in residential & commercial building, infrastructure, and industrial structures repair applications. The construction industry has many diverse and specialized requirements. Construction carbon fiber reinforcements are used in the construction industry for their excellent physical and mechanical properties, such as lightweight, high mechanical strength, thermal & chemical stability, and recyclability. The application of construction carbon fiber composites is now increasing as the requirement for construction and infrastructure repair projects is increasing across the globe. Lightweight, high strength, durability, and other performance properties are driving the demand for various carbon fiber composite products, such as fabric, mesh, rebar, plate, laminates, and grid.

The volatility in prices, high cost of carbon fiber, and supply chain disruptions are expected to hamper the market growth in the near future. The rising demand for commercial and industrial repair applications from the US, Germany, and Brazil, among other countries, is expected to provide immense opportunities for the market players in the near future. Furthermore, heavy investment by leading industry players to carry out R&D activities in the field of construction carbon fiber composites could help to reduce the cost of carbon fiber composite products used in repair projects.

Attractive Opportunities in Carbon Fiber Construction Repair Market Trends

Carbon Fiber Construction Repair Market

To know about the assumptions considered for the study, Request for Free Sample Report

Carbon Fiber Construction Repair Market

Carbon Fiber Construction Repair Market Dynamics

Driver: High demand for superior performance materials

Carbon fiber composites are increasingly being used in construction as an alternative to steel due to their high strength and low weight. It can be formed in different shapes and sizes and can be customized according to the needs of the consumers. It has low thermal conductivity and good cohesion with concrete. Owing to its much lighter weight, it is logistically much simpler to deliver carbon fiber composite products at the location of the construction sites. Thus, the supply chain also becomes much easier and smoother. The common applications of carbon fiber composites include strengthening structures made of steel, concrete, and iron, increasing load capacity of older structures, such as bridges, and the restoration of old historical buildings. The logistical advantage over steel and the reduction in time to install carbon fiber composites products in an ongoing project make it preferable in projects where there is a strict deadline, as it takes a much shorter time to work with carbon fiber composites products.

Restraint: High cost of carbon fiber

Carbon fiber is currently used in the construction industry in the form of bars, rods, mesh, and fabrics. Because of the high cost of carbon fibers, the average price of these products is higher than that of traditional products. Higher prices for such products have a greater impact in many developing countries, as consumers prefer more traditional alternatives. Because carbon fiber construction repair products are still uncommon, particularly in emerging markets, it will be difficult to compete with more traditional alternatives such as steel or aluminum. Prices may fall as mass production increases and carbon fiber manufacturing technology evolves.

Opportunity: Growing demand from emerging markets

Traditionally, the composites industry was concentrated in Japan, North America, and Europe. However, in recent years, there has been a significant shift toward emerging economies in Asia Pacific. Owing to rapid industrialization, the building & infrastructure sector is rapidly expanding in the growing and developing economies, creating a huge demand for materials used in construction. Thus, construction composite products have significant demand in such growing economies. The construction repair of various megastructures and infrastructure projects in these countries has been increasingly using reinforcement solutions, and construction composites have been adopted for various projects due to their long-term cost benefits.

Challenge: Development of technology to reduce cycle time

Huge investments are being made, and various laboratories are being set up to develop new technologies for producing low-cost carbon fiber (LCCF). ORNL (Tennessee, US) is leading a Department of Energy initiative to develop a technology for producing LCCF. Attempts are being made to modify the value chain of carbon fiber composites, but nothing concrete has been achieved yet. Problems are identified, but no significant development has been witnessed to reduce the cycle time in production lines. The future of carbon fiber construction repair products is dependent on the availability of lower-cost raw materials, which can bring down the price of such products and offer competition to traditional materials, especially in emerging markets.

Carbon Fiber Construction Repair Market Ecosystem

Carbon Fiber Construction Repair Market Ecosystem

Based on the application, the infrastructure segment is estimated to account for the largest carbon fiber construction repair market share during the forecast period.

Carbon fiber rebars, mesh, carbon fabric, and other products are widely used to increase the strength of old structures, such as bridges, water structures, historical structures, highways, and transportation structures across the world. Carbon fiber composite material has several advantages, including faster, easier, and less expensive installation and repair of structures because smaller cranes are required while working. They enable the delivery of large sections to construction sites, which reduces repair and assembly time and cost.

Based on product type, the fabric segment is anticipated to register the highest CAGR in carbon fiber construction repair market.

Fabrics offer flexibility, high strength, high modulus, and long shelf life. Carbon fiber fabrics or textiles are manufactured by twisting the fibers like a yarn (which is known as tow) and then weaving them into a fabric. The fabric comes in a variety of strengths, depending upon its weaves. Carbon fabrics have a variety of properties, such as flexibility, high strength, high modulus, lightweight, resistance to high temperature, and long shelf life. These fabrics provide various advantages, including easy installation, corrosion resistance, short construction period, low maintenance, and cost-effectiveness.

Europe to hold the largest market share during the forecast period.

The market for carbon fiber construction repair products in Europe is characterized by capacity expansions, joint ventures, and agreements among various leading market players. The building & construction industry is generating high demand for carbon fiber products. Its usage is high in various applications—residential, commercial, industrial, and other infrastructure projects. The usage of carbon fiber construction repair products, particularly in bridges across Europe, has been very high. New public projects, such as hospitals, schools, and public buildings, have been using carbon fiber construction repair products, and many historical structures across the continent have been reinforced and strengthened using carbon fiber construction repair products.

Carbon Fiber Construction Repair Market by Region

To know about the assumptions considered for the study, download the pdf brochure

Key Market Players

The carbon fiber construction repair market is dominated by a few globally established players. SIKA AG (Switzerland), Mapei SpA (Italy), Fosroc Inc. (UAE), Master Builders Solutions (Germany), Critica Infrastructure (US), AB-SCHOMBURG Yapi Kimyasallari A.S. (Turkey), Dowaksa (UAE), Dextra Group (Thailand), Rhino Carbon Fiber Reinforcement Products (US), Mitsubishi Chemical Corporation (Japan), Toray Industries Inc. (Japan), Simpson Strong-Tie Company Inc. (US), Antop Global Technology Co., Ltd. (China), Sireg Geotech S.r.l. (Italy), and Chomarat Group (US), among others, are the key manufacturers that secured major contracts in the last few years. The major focus was given to the contracts and new product development due to the changing requirements across the world.

These companies are pursuing a variety of inorganic and organic strategies in order to gain a foothold in the carbon fiber construction repair market. The research includes a detailed competitive analysis of these key players in the carbon fiber construction repair market, including company profiles, recent developments, and key market strategies.

Scope of the  Report

Report Metric

Details

Market size available for years

2021–2028

Base year considered

2022

Forecast period

2023–2028

Units considered

Value (USD Million), Volume (Kiloton)

Segments Covered

By Product Type, By Application, By Region

Geographies covered

Europe, North America, Asia Pacific, Latin America, Middle East, and Africa

Companies covered

SIKA AG (Switzerland), Mapei SpA (Italy), Fosroc Inc. (UAE), Master Builders Solutions (Germany), Critica Infrastructure (US), AB-SCHOMBURG Yapi Kimyasallari A.S. (Turkey), Dowaksa (UAE), Dextra Group (Thailand), Rhino Carbon Fiber Reinforcement Products (US), Mitsubishi Chemical Corporation (Japan), Toray Industries Inc. (Japan), Simpson Strong-Tie Company Inc. (US), Antop Global Technology Co., Ltd. (China), Sireg Geotech S.r.l. (Italy), Chomarat Group (US)

The study categorizes the carbon fiber construction repair market based on Product Type, Application, and Region.

By Product Type:
By Application:
  • Residential & Commercial Building
  • Infrastructure
  • Industrial
By Region:
  • North America
  • Asia Pacific
  • Europe
  • Latin America
  • Middle East & Africa

Recent Developments

  • In June 2023, FOSROC Inc. entered into a JV with Chemtech, a leading construction chemicals manufacturer in Egypt.
  • In May 2023, Sika acquired MBCC Group to strengthen its footprint across all regions and reinforce its range of products and services across the entire construction life cycle.
  • In September 2022, Mapei Group acquired ProfilPas, which is a leading manufacturer and seller of construction materials and accessories.
  • In September 2022, Mitsubishi Chemical Corporation partnered with Ibaraki Prefecture governance body to establish circular industrial complex in Kashima coastal industrial zone and create a carbon- neutral industrial base located in the Ibaraki coastal area.

Frequently Asked Questions (FAQ):

To speak to our analyst for a discussion on the above findings, click Speak to Analyst

TABLE OF CONTENTS
 
1 INTRODUCTION (Page No. - 29)
    1.1 STUDY OBJECTIVES 
    1.2 MARKET DEFINITION 
    1.3 INCLUSIONS AND EXCLUSIONS 
    1.4 MARKET SCOPE 
          FIGURE 1 CARBON FIBER CONSTRUCTION REPAIR MARKET SEGMENTATION
           1.4.1 REGIONS COVERED
           1.4.2 YEARS CONSIDERED
    1.5 CURRENCY CONSIDERED 
    1.6 UNITS CONSIDERED 
    1.7 LIMITATIONS 
    1.8 STAKEHOLDERS 
    1.9 IMPACT OF RECESSION 
 
2 RESEARCH METHODOLOGY (Page No. - 33)
    2.1 RESEARCH APPROACH 
          FIGURE 2 CARBON FIBER CONSTRUCTION REPAIR MARKET: RESEARCH DESIGN
    2.2 BASE NUMBER CALCULATION 
           2.2.1 SUPPLY-SIDE APPROACH
           2.2.2 DEMAND-SIDE APPROACH
    2.3 IMPACT OF RECESSION 
          FIGURE 3 RECESSION IMPACT ON CARBON FIBER CONSTRUCTION REPAIR MARKET
    2.4 FORECAST NUMBER CALCULATION 
    2.5 RESEARCH DATA 
           2.5.1 SECONDARY DATA
                    2.5.1.1 Key data from secondary sources
           2.5.2 PRIMARY DATA
                    2.5.2.1 Key data from primary sources
                    2.5.2.2 Key companies participating in primary interviews
                    2.5.2.3 Breakdown of primary interviews
                    2.5.2.4 Key industry insights
    2.6 MARKET SIZE ESTIMATION 
           2.6.1 BOTTOM-UP APPROACH
                    FIGURE 4 MARKET SIZE ESTIMATION METHODOLOGY: BOTTOM-UP APPROACH
           2.6.2 TOP-DOWN APPROACH
                    FIGURE 5 MARKET SIZE ESTIMATION METHODOLOGY: TOP-DOWN APPROACH
    2.7 DATA TRIANGULATION 
          FIGURE 6 CARBON FIBER CONSTRUCTION REPAIR MARKET: DATA TRIANGULATION
    2.8 RESEARCH ASSUMPTIONS 
    2.9 MARKET GROWTH RATE ASSUMPTIONS/GROWTH FORECAST 
    2.1 RESEARCH LIMITATIONS 
    2.11 RISKS ASSOCIATED WITH CARBON FIBER CONSTRUCTION REPAIR MARKET STUDY 
 
3 EXECUTIVE SUMMARY (Page No. - 44)
    FIGURE 7 FABRIC TO BE FASTEST-GROWING SEGMENT DURING FORECAST PERIOD
    FIGURE 8 RESIDENTIAL & COMMERCIAL BUILDINGS TO BE FASTEST-GROWING APPLICATION OF CARBON FIBER CONSTRUCTION REPAIR
    FIGURE 9 US TO BE LARGEST MARKET FOR CARBON FIBER CONSTRUCTION REPAIR
    FIGURE 10 ASIA PACIFIC TO REGISTER HIGHEST CAGR DURING FORECAST PERIOD
 
4 PREMIUM INSIGHTS (Page No. - 48)
    4.1 ATTRACTIVE OPPORTUNITIES IN CARBON FIBER CONSTRUCTION REPAIR MARKET 
          FIGURE 11 HIGH DEMAND OF LIGHTWEIGHT MATERIALS FOR CONSTRUCTION REPAIR ACTIVITIES TO DRIVE MARKET
    4.2 CARBON FIBER CONSTRUCTION REPAIR MARKET, BY PRODUCT TYPE 
          FIGURE 12 CARBON FIBER FABRIC ACCOUNTED FOR LARGEST MARKET SHARE IN 2022
    4.3 CARBON FIBER CONSTRUCTION REPAIR MARKET, BY APPLICATION AND REGION 
          FIGURE 13 EUROPE TO BE LARGEST MARKET FOR CARBON FIBER CONSTRUCTION REPAIR
    4.4 CARBON FIBER CONSTRUCTION REPAIR MARKET, BY KEY COUNTRIES 
          FIGURE 14 CHINA TO REGISTER HIGHEST CAGR DURING FORECAST PERIOD
 
5 MARKET OVERVIEW (Page No. - 50)
    5.1 INTRODUCTION 
    5.2 MARKET DYNAMICS 
          FIGURE 15 DRIVERS, RESTRAINTS, OPPORTUNITIES, AND CHALLENGES IN CARBON FIBER CONSTRUCTION REPAIR MARKET
           5.2.1 DRIVERS
                    5.2.1.1 High demand for superior-performance materials
                    5.2.1.2 High growth of construction sector
           5.2.2 RESTRAINTS
                    5.2.2.1 Lack of experienced professionals in emerging markets
                    5.2.2.2 High cost of carbon fiber
           5.2.3 OPPORTUNITIES
                    5.2.3.1 Development of low-cost carbon fibers
                    5.2.3.2 Growing demand from emerging markets
                                TABLE 1 GROWTH IN GLOBAL CONSTRUCTION OUTPUT, BY COUNTRY (2019–2030)
           5.2.4 CHALLENGES
                    5.2.4.1 Availability of low-cost substitutes and lower acceptance of construction composites
    5.3 PORTER’S FIVE FORCES ANALYSIS 
          FIGURE 16 CARBON FIBER CONSTRUCTION REPAIR MARKET: PORTER’S FIVE FORCES ANALYSIS
           5.3.1 BARGAINING POWER OF BUYERS
           5.3.2 BARGAINING POWER OF SUPPLIERS
           5.3.3 THREAT OF NEW ENTRANTS
           5.3.4 THREAT OF SUBSTITUTES
           5.3.5 INTENSITY OF COMPETITIVE RIVALRY
                    TABLE 2 CARBON FIBER CONSTRUCTION REPAIR MARKET: PORTER’S FIVE FORCES ANALYSIS
    5.4 SUPPLY CHAIN ANALYSIS 
          TABLE 3 CARBON FIBER CONSTRUCTION REPAIR MARKET: ROLE IN ECOSYSTEM
    5.5 PRICING ANALYSIS 
           5.5.1 AVERAGE SELLING PRICE OF KEY PLAYERS, BY APPLICATION
                    FIGURE 17 AVERAGE SELLING PRICES OF KEY PLAYERS IN TOP APPLICATIONS (USD/KG)
                    TABLE 4 AVERAGE SELLING PRICES OF KEY PLAYERS, BY APPLICATION (USD/KG)
           5.5.2 AVERAGE SELLING PRICE, BY PRODUCT TYPE
          vFIGURE 18 AVERAGE SELLING PRICE, BY PRODUCT TYPE (USD/KG)
           5.5.3 AVERAGE SELLING PRICE, BY APPLICATION
                    FIGURE 19 AVERAGE SELLING PRICES, APPLICATION (USD/KG)
    5.6 AVERAGE SELLING PRICE, BY REGION 
          TABLE 5 AVERAGE SELLING PRICE TREND IN CARBON FIBER CONSTRUCTION REPAIR MARKET, BY REGION
    5.7 KEY STAKEHOLDERS & BUYING CRITERIA 
           5.7.1 KEY STAKEHOLDERS IN BUYING PROCESS
                    FIGURE 20 INFLUENCE OF STAKEHOLDERS ON BUYING PROCESS IN TOP 3 APPLICATIONS
                    TABLE 6 INFLUENCE OF STAKEHOLDERS ON BUYING PROCESS FOR TOP 3 APPLICATIONS
           5.7.2 BUYING CRITERIA
                    FIGURE 21 KEY BUYING CRITERIA FOR TOP 3 APPLICATIONS
                    TABLE 7 KEY BUYING CRITERIA FOR TOP 3 APPLICATIONS
    5.8 TECHNOLOGY ANALYSIS 
    5.9 ECOSYSTEM ANALYSIS 
          FIGURE 22 CARBON FIBER CONSTRUCTION REPAIR MARKET: ECOSYSTEM
    5.10 VALUE CHAIN ANALYSIS 
           FIGURE 23 VALUE CHAIN ANALYSIS: CARBON FIBER CONSTRUCTION REPAIR MARKET
           5.10.1 RAW MATERIAL AND LABOR
           5.10.2 CARBON FIBER REPAIR PRODUCT MANUFACTURERS
           5.10.3 CONSTRUCTION REPAIR SERVICE PROVIDERS
    5.11 CASE STUDY ANALYSIS 
    5.12 TRENDS AND DISRUPTIONS IMPACTING CUSTOMERS’ BUSINESSES 
    5.13 TRADE ANALYSIS 
           5.13.1 TOP CARBON FIBER EXPORTING COUNTRIES
                     TABLE 8 TOP 25 CARBON FIBER EXPORTING COUNTRIES IN 2022
           5.13.2 TOP CARBON FIBER IMPORTING COUNTRIES
                     TABLE 9 TOP 25 CARBON FIBER IMPORTING COUNTRIES IN 2022
           5.13.3 KEY MARKET FOR IMPORT/EXPORT
                    5.13.3.1 US
                    5.13.3.2 Germany
                    5.13.3.3 France
                    5.13.3.4 UK
                    5.13.3.5 China
    5.14 TARIFF AND REGULATORY LANDSCAPE 
           5.14.1 STANDARDS IN CARBON FIBER CONSTRUCTION REPAIR MARKET
                     TABLE 10 CURRENT STANDARD CODES FOR CARBON FIBER CONSTRUCTION REPAIR MARKET
           5.14.2 REGULATORY BODIES, GOVERNMENT AGENCIES, AND OTHER ORGANIZATIONS
                     TABLE 11 NORTH AMERICA: LIST OF REGULATORY BODIES, GOVERNMENT AGENCIES, AND OTHER ORGANIZATIONS
                     TABLE 12 EUROPE: LIST OF REGULATORY BODIES, GOVERNMENT AGENCIES, AND OTHER ORGANIZATIONS
                     TABLE 13 ASIA PACIFIC: LIST OF REGULATORY BODIES, GOVERNMENT AGENCIES, AND OTHER ORGANIZATIONS
                     TABLE 14 REST OF WORLD: LIST OF REGULATORY BODIES, GOVERNMENT AGENCIES, AND OTHER ORGANIZATIONS
    5.15 KEY CONFERENCES & EVENTS 
           TABLE 15 DETAILED LIST OF CONFERENCES & EVENTS RELATED TO CARBON FIBER CONSTRUCTION REPAIR MARKET, 2023–2024
    5.16 PATENT ANALYSIS 
           5.16.1 INTRODUCTION
           5.16.2 METHODOLOGY
           5.16.3 DOCUMENT TYPE
                     TABLE 16 CARBON FIBER CONSTRUCTION REPAIR MARKET: GLOBAL PATENTS
                     FIGURE 24 GLOBAL PATENT ANALYSIS, BY DOCUMENT TYPE
                     FIGURE 25 GLOBAL PATENT PUBLICATION TREND: 2017–2022
           5.16.4 INSIGHTS
           5.16.5 LEGAL STATUS OF PATENTS
                     FIGURE 26 CARBON FIBER CONSTRUCTION REPAIR MARKET: LEGAL STATUS OF PATENTS
           5.16.6 JURISDICTION ANALYSIS
                     FIGURE 27 GLOBAL JURISDICTION ANALYSIS
           5.16.7 TOP APPLICANTS' ANALYSIS
                     FIGURE 28 REGISTAD & ASS INC. REGISTERED HIGHEST NUMBER OF PATENTS
           5.16.8 PATENTS BY REGISTAD & ASS INC.
           5.16.9 PATENTS BY STATE GRID CORP. CHINA
                    5.16.10 PATENTS BY UNIVERSITY OF XIAN ARCHITECTURE & TECH
 
6 CARBON FIBER CONSTRUCTION REPAIR MARKET, BY PRODUCT TYPE (Page No. - 77)
    6.1 INTRODUCTION 
          FIGURE 29 CARBON FIBER FABRIC TO REGISTER HIGHEST CAGR DURING FORECAST PERIOD
          TABLE 17 CARBON FIBER CONSTRUCTION REPAIR MARKET SIZE, BY PRODUCT TYPE, 2021–2028 (USD MILLION)
          TABLE 18 CARBON FIBER CONSTRUCTION REPAIR MARKET SIZE, BY PRODUCT TYPE, 2021–2028 (KILOTON)
    6.2 REBAR 
           6.2.1 NEED FOR HIGH-STRENGTH MATERIALS TO SUPPORT OLD STRUCTURES TO DRIVE DEMAND
                    FIGURE 30 EUROPE TO BE LARGEST MARKET FOR CARBON FIBER REBAR CONSTRUCTION REPAIR
           6.2.2 CARBON FIBER REBAR CONSTRUCTION REPAIR MARKET, BY REGION
                    TABLE 19 CARBON FIBER REBAR CONSTRUCTION REPAIR MARKET SIZE, BY REGION, 2021–2028 (USD MILLION)
                    TABLE 20 CARBON FIBER REBAR CONSTRUCTION REPAIR MARKET SIZE, BY REGION, 2021–2028 (KILOTON)
                    TABLE 21 CARBON FIBER REBAR CONSTRUCTION REPAIR MARKET SIZE, BY APPLICATION, 2021–2028 (USD MILLION)
                    TABLE 22 CARBON FIBER REBAR CONSTRUCTION REPAIR MARKET SIZE, BY APPLICATION, 2021–2028 (KILOTON)
    6.3 FABRIC 
           6.3.1 CARBON FIBER FABRICS WIDELY USED FOR THEIR FLEXIBILITY, HIGH STRENGTH, HIGH MODULUS, AND LONG SHELF LIFE
                    FIGURE 31 ASIA PACIFIC TO REGISTER HIGHEST CAGR IN CARBON FIBER FABRIC CONSTRUCTION REPAIR MARKET
           6.3.2 CARBON FIBER FABRIC CONSTRUCTION REPAIR MARKET, BY REGION
                    TABLE 23 CARBON FIBER FABRIC CONSTRUCTION REPAIR MARKET SIZE, BY REGION, 2021–2028 (USD MILLION)
                    TABLE 24 CARBON FIBER FABRIC CONSTRUCTION REPAIR MARKET SIZE, BY REGION, 2021–2028 (KILOTON)
                    TABLE 25 CARBON FIBER FABRIC CONSTRUCTION REPAIR MARKET SIZE, BY APPLICATION, 2021–2028 (USD MILLION)
                    TABLE 26 CARBON FIBER REBAR CONSTRUCTION FABRIC MARKET SIZE, BY APPLICATION, 2021–2028 (KILOTON)
    6.4 PLATE 
           6.4.1 OFFERS LOW WEIGHT, CORROSION RESISTANT, AND HIGH TENSILE STRENGTH
                    FIGURE 32 EUROPE TO BE LARGEST CARBON FIBER PLATE CONSTRUCTION REPAIR MARKET
           6.4.2 CARBON FIBER PLATE CONSTRUCTION REPAIR MARKET, BY REGION
                    TABLE 27 CARBON FIBER PLATE CONSTRUCTION REPAIR MARKET SIZE, BY REGION, 2021–2028 (USD MILLION)
                    TABLE 28 CARBON FIBER PLATE CONSTRUCTION REPAIR MARKET SIZE, BY REGION, 2021–2028 (KILOTON)
                    TABLE 29 CARBON FIBER PLATE CONSTRUCTION REPAIR MARKET SIZE, BY APPLICATION, 2021–2028 (USD MILLION)
                    TABLE 30 CARBON FIBER PLATE CONSTRUCTION PLATE MARKET SIZE, BY APPLICATION, 2021–2028 (KILOTON)
    6.5 OTHERS 
           6.5.1 OTHERS CARBON FIBER CONSTRUCTION REPAIR MARKET, BY REGION
                    TABLE 31 OTHERS CARBON FIBER CONSTRUCTION REPAIR MARKET SIZE, BY REGION, 2021–2028 (USD MILLION)
                    TABLE 32 OTHERS CARBON FIBER CONSTRUCTION REPAIR MARKET SIZE, BY REGION, 2021–2028 (KILOTON)
                    TABLE 33 OTHERS CARBON FIBER CONSTRUCTION REPAIR MARKET SIZE, BY APPLICATION, 2021–2028 (USD MILLION)
                    TABLE 34 OTHERS CARBON FIBER REBAR CONSTRUCTION MARKET SIZE, BY APPLICATION, 2021–2028 (KILOTON)
 
7 CARBON FIBER CONSTRUCTION REPAIR MARKET, BY APPLICATION (Page No. - 88)
    7.1 INTRODUCTION 
          FIGURE 33 RESIDENTIAL & COMMERCIAL BUILDINGS TO REGISTER HIGHEST CAGR DURING FORECAST PERIOD
          TABLE 35 CARBON FIBER CONSTRUCTION REPAIR MARKET SIZE, BY APPLICATION, 2021–2028 (USD MILLION)
          TABLE 36 CARBON FIBER CONSTRUCTION REPAIR MARKET SIZE, BY APPLICATION, 2021–2028 (KILOTON)
    7.2 RESIDENTIAL & COMMERCIAL BUILDINGS 
           7.2.1 RESIDENTIAL & COMMERCIAL BUILDINGS SEGMENT TO BE FASTEST-GROWING APPLICATION DURING FORECAST PERIOD
                    FIGURE 34 EUROPE TO BE LARGEST CONSUMER OF CARBON FIBER CONSTRUCTION REPAIR IN RESIDENTIAL & COMMERCIAL BUILDINGS
           7.2.2 CARBON FIBER CONSTRUCTION REPAIR MARKET IN RESIDENTIAL & COMMERCIAL BUILDINGS, BY REGION
                    TABLE 37 CARBON FIBER CONSTRUCTION REPAIR MARKET SIZE IN RESIDENTIAL & COMMERCIAL BUILDINGS, BY REGION, 2021–2028 (USD MILLION)
                    TABLE 38 CARBON FIBER CONSTRUCTION REPAIR MARKET SIZE IN RESIDENTIAL & COMMERCIAL BUILDINGS, BY REGION, 2021–2028 (KILOTON)
    7.3 INFRASTRUCTURE 
           7.3.1 CARBON FIBER REBARS, MESH, AND FABRICS INCREASINGLY USED TO IMPROVE STRENGTH OF BRIDGES
                    FIGURE 35 EUROPE TO DOMINATE CARBON FIBER CONSTRUCTION REPAIR MARKET IN INFRASTRUCTURE SEGMENT
           7.3.2 CARBON FIBER CONSTRUCTION REPAIR MARKET IN INFRASTRUCTURE, BY REGION
                    TABLE 39 CARBON FIBER CONSTRUCTION REPAIR MARKET SIZE IN INFRASTRUCTURE, BY REGION, 2021–2028 (USD MILLION)
                    TABLE 40 CARBON FIBER CONSTRUCTION REPAIR MARKET SIZE IN INFRASTRUCTURE, BY REGION, 2021–2028 (KILOTON)
    7.4 INDUSTRIAL 
           7.4.1 ASIA PACIFIC TO WITNESS HIGHEST GROWTH OF CARBON FIBER CONSTRUCTION REPAIR MARKET IN INDUSTRIAL SEGMENT
                    FIGURE 36 NORTH AMERICA TO BE LARGEST MARKET FOR INDUSTRIAL CARBON FIBER CONSTRUCTION REPAIR
           7.4.2 CARBON FIBER CONSTRUCTION REPAIR MARKET IN INDUSTRIAL, BY REGION
                    TABLE 41 CARBON FIBER CONSTRUCTION REPAIR MARKET SIZE IN INDUSTRIAL, BY REGION, 2021–2028 (USD MILLION)
                    TABLE 42 CARBON FIBER CONSTRUCTION REPAIR MARKET SIZE IN INDUSTRIAL, BY REGION, 2021–2028 (KILOTON)
 
8 CARBON FIBER CONSTRUCTION REPAIR MARKET, BY REGION (Page No. - 96)
    8.1 INTRODUCTION 
          FIGURE 37 CHINA TO REGISTER HIGHEST GROWTH RATE DURING FORECAST PERIOD
           8.1.1 CARBON FIBER CONSTRUCTION REPAIR MARKET, BY REGION
                    TABLE 43 CARBON FIBER CONSTRUCTION REPAIR MARKET SIZE, BY REGION, 2021–2028 (USD MILLION)
                    TABLE 44 CARBON FIBER CONSTRUCTION REPAIR MARKET SIZE, BY REGION, 2021–2028 (KILOTON)
    8.2 NORTH AMERICA 
           8.2.1 IMPACT OF RECESSION IN NORTH AMERICA
                    FIGURE 38 NORTH AMERICA: CARBON FIBER CONSTRUCTION REPAIR MARKET SNAPSHOT
           8.2.2 NORTH AMERICA: CARBON FIBER CONSTRUCTION REPAIR MARKET, BY PRODUCT TYPE
                    TABLE 45 NORTH AMERICA: CARBON FIBER CONSTRUCTION REPAIR MARKET SIZE, BY PRODUCT TYPE, 2021–2028 (USD MILLION)
                    TABLE 46 NORTH AMERICA: CARBON FIBER CONSTRUCTION REPAIR MARKET SIZE, BY PRODUCT TYPE, 2021–2028 (KILOTON)
           8.2.3 NORTH AMERICA: CARBON FIBER CONSTRUCTION REPAIR MARKET, BY APPLICATION
                    TABLE 47 NORTH AMERICA: CARBON FIBER CONSTRUCTION REPAIR MARKET SIZE, BY APPLICATION, 2021–2028 (USD MILLION)
                    TABLE 48 NORTH AMERICA: CARBON FIBER CONSTRUCTION REPAIR MARKET SIZE, BY APPLICATION, 2021–2028 (KILOTON)
           8.2.4 NORTH AMERICA: CARBON FIBER CONSTRUCTION REPAIR MARKET, BY COUNTRY
                    TABLE 49 NORTH AMERICA: CARBON FIBER CONSTRUCTION REPAIR MARKET SIZE, BY COUNTRY, 2021–2028 (USD MILLION)
                    TABLE 50 NORTH AMERICA: CARBON FIBER CONSTRUCTION REPAIR MARKET SIZE, BY COUNTRY, 2021–2028 (KILOTON)
                    8.2.4.1 US
                               8.2.4.1.1 Largest consumer of construction repair carbon fiber products in North America
                               8.2.4.1.2 US: Carbon fiber construction repair market, by application
                                              TABLE 51 US: CARBON FIBER CONSTRUCTION REPAIR MARKET SIZE, BY APPLICATION, 2021–2028 (USD MILLION)
                                              TABLE 52 US: CARBON FIBER CONSTRUCTION REPAIR MARKET SIZE, BY APPLICATION, 2021–2028
                    8.2.4.2 Canada
                               8.2.4.2.1 Carbon fiber products widely used to maintain water structures
                               8.2.4.2.2 Canada: Carbon fiber construction repair market, by application
                                              TABLE 53 CANADA: CARBON FIBER CONSTRUCTION REPAIR MARKET SIZE, BY APPLICATION, 2021–2028 (USD MILLION)
                                              TABLE 54 CANADA: CARBON FIBER CONSTRUCTION REPAIR MARKET SIZE, BY APPLICATION, 2021–2028 (KILOTON)
    8.3 EUROPE 
           8.3.1 RECESSION IMPACT
                    FIGURE 39 EUROPE: CARBON FIBER CONSTRUCTION REPAIR MARKET SNAPSHOT
           8.3.2 EUROPE: CARBON FIBER CONSTRUCTION REPAIR MARKET, BY PRODUCT TYPE
                    TABLE 55 EUROPE: CARBON FIBER CONSTRUCTION REPAIR MARKET, BY PRODUCT TYPE, 2021–2028 (USD MILLION)
                    TABLE 56 EUROPE: CARBON FIBER CONSTRUCTION REPAIR MARKET, BY PRODUCT TYPE, 2021–2028 (KILOTON)
           8.3.3 EUROPE: CARBON FIBER CONSTRUCTION REPAIR MARKET, BY APPLICATION
                    TABLE 57 EUROPE: CARBON FIBER CONSTRUCTION REPAIR MARKET, BY APPLICATION, 2021–2028 (USD MILLION)
                    TABLE 58 EUROPE: CARBON FIBER CONSTRUCTION REPAIR MARKET, BY APPLICATION, 2021–2028 (KILOTON)
           8.3.4 EUROPE: CARBON FIBER CONSTRUCTION REPAIR MARKET, BY COUNTRY
                    TABLE 59 EUROPE: CARBON FIBER CONSTRUCTION REPAIR MARKET, BY COUNTRY, 2021–2028 (USD MILLION)
                    TABLE 60 EUROPE: CARBON FIBER CONSTRUCTION REPAIR MARKET, BY COUNTRY, 2021–2028 (KILOTON)
                    8.3.4.1 Germany
                               8.3.4.1.1 Leading carbon fiber construction repair market in Europe
                               8.3.4.1.2 Germany: Carbon fiber construction repair market, by application
                                              TABLE 61 GERMANY: CARBON FIBER CONSTRUCTION REPAIR MARKET, BY APPLICATION, 2021–2028 (USD MILLION)
                                              TABLE 62 GERMANY: CARBON FIBER CONSTRUCTION REPAIR MARKET, BY APPLICATION, 2021–2028 (KILOTON)
                    8.3.4.2 UK
                               8.3.4.2.1 Growth of construction sector to drive market
                               8.3.4.2.2 UK: Carbon fiber construction repair market, by application
                                              TABLE 63 UK: CARBON FIBER CONSTRUCTION REPAIR MARKET, BY APPLICATION, 2021–2028 (USD MILLION)
                                              TABLE 64 UK: CARBON FIBER CONSTRUCTION REPAIR MARKET, BY APPLICATION, 2021–2028 (KILOTON)
                    8.3.4.3 France
                               8.3.4.3.1 Infrastructure to be major consumer of carbon fiber construction repair products
                               8.3.4.3.2 France: Carbon fiber construction repair market, by application
                                              TABLE 65 FRANCE: CARBON FIBER CONSTRUCTION REPAIR MARKET, BY APPLICATION, 2021–2028 (USD MILLION)
                                              TABLE 66 FRANCE: CARBON FIBER CONSTRUCTION REPAIR MARKET, BY APPLICATION, 2021–2028 (KILOTON)
                    8.3.4.4 Italy
                               8.3.4.4.1 Presence of major players to drive market
                               8.3.4.4.2 Italy: Carbon fiber construction repair market, by application
                                              TABLE 67 ITALY: CARBON FIBER CONSTRUCTION REPAIR MARKET, BY APPLICATION, 2021–2028 (USD MILLION)
                                              TABLE 68 ITALY: CARBON FIBER CONSTRUCTION REPAIR MARKET, BY APPLICATION, 2021–2028 (KILOTON)
                    8.3.4.5 Spain
                               8.3.4.5.1 High demand in reinforcement and refurbishment purposes to fuel market growth
                               8.3.4.5.2 Spain: Carbon fiber construction repair market, by application
                                              TABLE 69 SPAIN: CARBON FIBER CONSTRUCTION REPAIR MARKET, BY APPLICATION, 2021–2028 (USD MILLION)
                                              TABLE 70 SPAIN: CARBON FIBER CONSTRUCTION REPAIR MARKET, BY APPLICATION, 2021–2028 (KILOTON)
                    8.3.4.6 Rest of Europe
                               8.3.4.6.1 Region witnessing increasing usage in different construction repair applications
                               8.3.4.6.2 Rest of Europe: Carbon fiber construction repair market, by application
                                              TABLE 71 REST OF EUROPE: CARBON FIBER CONSTRUCTION REPAIR MARKET, BY APPLICATION, 2021–2028 (USD MILLION)
                                              TABLE 72 REST OF EUROPE: CARBON FIBER CONSTRUCTION REPAIR MARKET, BY APPLICATION, 2021–2028 (KILOTON)
    8.4 ASIA PACIFIC 
           8.4.1 RECESSION IMPACT
                    FIGURE 40 ASIA PACIFIC: CARBON FIBER CONSTRUCTION REPAIR MARKET SNAPSHOT
           8.4.2 ASIA PACIFIC: CARBON FIBER CONSTRUCTION REPAIR MARKET, BY PRODUCT TYPE
                    TABLE 73 ASIA PACIFIC: CARBON FIBER CONSTRUCTION REPAIR MARKET, BY PRODUCT TYPE, 2021–2028 (USD MILLION)
                    TABLE 74 ASIA PACIFIC: CARBON FIBER CONSTRUCTION REPAIR MARKET, BY PRODUCT TYPE, 2021–2028 (KILOTON)
           8.4.3 ASIA PACIFIC: CARBON FIBER CONSTRUCTION REPAIR MARKET, BY APPLICATION
                    TABLE 75 ASIA PACIFIC: CARBON FIBER CONSTRUCTION REPAIR MARKET, BY APPLICATION, 2021–2028 (USD MILLION)
                    TABLE 76 ASIA PACIFIC: CARBON FIBER CONSTRUCTION REPAIR MARKET, BY APPLICATION, 2021–2028 (KILOTON)
           8.4.4 ASIA PACIFIC: CARBON FIBER CONSTRUCTION REPAIR MARKET, BY COUNTRY
                    TABLE 77 ASIA PACIFIC: CARBON FIBER CONSTRUCTION REPAIR MARKET, BY COUNTRY, 2021–2028 (USD MILLION)
                    TABLE 78 ASIA PACIFIC: CARBON FIBER CONSTRUCTION REPAIR MARKET, BY COUNTRY, 2021–2028 (KILOTON)
                    8.4.4.1 China
                               8.4.4.1.1 Largest carbon fiber construction repair market in Asia Pacific
                               8.4.4.1.2 China: Carbon fiber construction repair market, by application
                                              TABLE 79 CHINA: CARBON FIBER CONSTRUCTION REPAIR MARKET, BY APPLICATION, 2021–2028 (USD MILLION)
                                              TABLE 80 CHINA: CARBON FIBER CONSTRUCTION REPAIR MARKET, BY APPLICATION, 2021–2028 (KILOTON)
                    8.4.4.2 Japan
                               8.4.4.2.1 Technological advancement to drive market in Japan
                               8.4.4.2.2 Japan: Carbon fiber construction repair market, by application
                                              TABLE 81 JAPAN: CARBON FIBER CONSTRUCTION REPAIR MARKET, BY APPLICATION, 2021–2028 (USD MILLION)
                                              TABLE 82 JAPAN: CARBON FIBER CONSTRUCTION REPAIR MARKET, BY APPLICATION, 2021–2028 (KILOTON)
                    8.4.4.3 Rest of Asia Pacific
                               8.4.4.3.1 Urbanization and population growth to drive market during forecast period
                               8.4.4.3.2 Rest of Asia Pacific: Carbon fiber construction repair market, by application
                                              TABLE 83 REST OF ASIA PACIFIC: CARBON FIBER CONSTRUCTION REPAIR MARKET, BY APPLICATION, 2021–2028 (USD MILLION)
                                              TABLE 84 REST OF ASIA PACIFIC: CARBON FIBER CONSTRUCTION REPAIR MARKET, BY APPLICATION, 2021–2028 (KILOTON)
    8.5 LATIN AMERICA 
           8.5.1 IMPACT OF RECESSION IN LATIN AMERICA
           8.5.2 LATIN AMERICA: CARBON FIBER CONSTRUCTION REPAIR MARKET, BY PRODUCT TYPE
                    TABLE 85 LATIN AMERICA: CARBON FIBER CONSTRUCTION REPAIR MARKET SIZE, BY PRODUCT TYPE, 2021–2028 (USD MILLION)
                    TABLE 86 LATIN AMERICA: CARBON FIBER CONSTRUCTION REPAIR MARKET SIZE, BY PRODUCT TYPE, 2021–2028 (KILOTON)
           8.5.3 LATIN AMERICA: CARBON FIBER CONSTRUCTION REPAIR MARKET, BY APPLICATION
                    TABLE 87 LATIN AMERICA: CARBON FIBER CONSTRUCTION REPAIR MARKET SIZE, BY APPLICATION, 2021–2028 (USD MILLION)
                    TABLE 88 LATIN AMERICA: CARBON FIBER CONSTRUCTION REPAIR MARKET SIZE, BY APPLICATION, 2021–2028 (KILOTON)
           8.5.4 LATIN AMERICA: CARBON FIBER CONSTRUCTION REPAIR MARKET, BY COUNTRY
                    TABLE 89 LATIN AMERICA: CARBON FIBER CONSTRUCTION REPAIR MARKET SIZE, BY COUNTRY, 2021–2028 (USD MILLION)
                    TABLE 90 LATIN AMERICA: CARBON FIBER CONSTRUCTION REPAIR MARKET SIZE, BY COUNTRY, 2021–2028 (KILOTON)
                    8.5.4.1 Brazil
                               8.5.4.1.1 Largest market for carbon fiber construction repair in Latin America
                               8.5.4.1.2 Brazil: Carbon fiber construction repair market
                                              TABLE 91 BRAZIL: CARBON FIBER CONSTRUCTION REPAIR MARKET SIZE, BY APPLICATION, 2021–2028 (USD MILLION)
                                              TABLE 92 BRAZIL: CARBON FIBER CONSTRUCTION REPAIR MARKET SIZE, BY APPLICATION, 2021–2028 (KILOTON)
                    8.5.4.2 Mexico
                               8.5.4.2.1 Infrastructure to be largest as well as fastest-growing end user during forecast period
                               8.5.4.2.2 Mexico: Carbon fiber construction repair market, by application
                                              TABLE 93 MEXICO: CARBON FIBER CONSTRUCTION REPAIR MARKET SIZE, BY APPLICATION, 2021–2028 (USD MILLION)
                                              TABLE 94 MEXICO: CARBON FIBER CONSTRUCTION REPAIR MARKET SIZE, BY APPLICATION, 2021–2028 (KILOTON)
                    8.5.4.3 Rest of Latin America
                               8.5.4.3.1 Infrastructure to be dominant end user of carbon fiber repair products
                               8.5.4.3.2 Rest of Latin America: carbon fiber construction repair market, by application
                                              TABLE 95 REST OF LATIN AMERICA: CARBON FIBER CONSTRUCTION REPAIR MARKET SIZE, BY APPLICATION, 2021–2028 (USD MILLION)
                                              TABLE 96 REST OF LATIN AMERICA: CARBON FIBER CONSTRUCTION REPAIR MARKET SIZE, BY APPLICATION, 2021–2028 (KILOTON)
    8.6 MIDDLE EAST & AFRICA 
           8.6.1 RECESSION IMPACT
           8.6.2 MIDDLE EAST & AFRICA: CARBON FIBER CONSTRUCTION REPAIR MARKET, BY PRODUCT TYPE
                    TABLE 97 MIDDLE EAST & AFRICA: CARBON FIBER CONSTRUCTION REPAIR MARKET, BY PRODUCT TYPE, 2021–2028 (USD MILLION)
                    TABLE 98 MIDDLE EAST & AFRICA: CARBON FIBER CONSTRUCTION REPAIR MARKET, BY PRODUCT TYPE, 2021–2028 (KILOTON)
           8.6.3 MIDDLE EAST & AFRICA: CARBON FIBER CONSTRUCTION REPAIR MARKET, BY APPLICATION
                    TABLE 99 MIDDLE EAST & AFRICA: CARBON FIBER CONSTRUCTION REPAIR MARKET, BY APPLICATION, 2021–2028 (USD MILLION)
                    TABLE 100 MIDDLE EAST & AFRICA: CARBON FIBER CONSTRUCTION REPAIR MARKET, BY APPLICATION, 2021–2028 (KILOTON)
           8.6.4 MIDDLE EAST & AFRICA: CARBON FIBER CONSTRUCTION REPAIR MARKET, BY COUNTRY
                    TABLE 101 MIDDLE EAST & AFRICA: CARBON FIBER CONSTRUCTION REPAIR MARKET, BY COUNTRY, 2021–2028 (USD MILLION)
                    TABLE 102 MIDDLE EAST & AFRICA: CARBON FIBER CONSTRUCTION REPAIR MARKET, BY COUNTRY, 2021–2028 (KILOTON)
                    8.6.4.1 UAE
                               8.6.4.1.1 Favorable government support to drive demand
                               8.6.4.1.2 UAE: Carbon fiber construction repair market, by application
                                              TABLE 103 UAE: CARBON FIBER CONSTRUCTION REPAIR MARKET, BY APPLICATION, 2021–2028 (USD MILLION)
                                              TABLE 104 UAE: CARBON FIBER CONSTRUCTION REPAIR MARKET, BY APPLICATION, 2021–2028 (KILOTON)
                    8.6.4.2 Saudi Arabia
                               8.6.4.2.1 Construction of high-speed trains, highways, bridges, and water treatment plants to fuel demand
                               8.6.4.2.2 Saudi Arabia: Carbon fiber construction repair market, by application
                                              TABLE 105 SAUDI ARABIA: CARBON FIBER CONSTRUCTION REPAIR MARKET, BY APPLICATION, 2021–2028 (USD MILLION)
                                              TABLE 106 SAUDI ARABIA: CARBON FIBER CONSTRUCTION REPAIR MARKET, BY APPLICATION, 2021–2028 (KILOTON)
                    8.6.4.3 Rest of Middle East & Africa
                               8.6.4.3.1 Increasing construction of commercial and residential buildings to drive market
                               8.6.4.3.2 Rest of Middle East & Africa: Carbon fiber construction repair market, by application
                                              TABLE 107 REST OF MIDDLE EAST & AFRICA: CARBON FIBER CONSTRUCTION REPAIR MARKET, BY APPLICATION, 2021–2028 (USD MILLION)
                                              TABLE 108 REST OF MIDDLE EAST & AFRICA: CARBON FIBER CONSTRUCTION REPAIR MARKET, BY APPLICATION, 2021–2028 (KILOTON)
 
9 COMPETITIVE LANDSCAPE (Page No. - 133)
    9.1 OVERVIEW 
    9.2 KEY PLAYERS STRATEGIES/RIGHT TO WIN 
           9.2.1 OVERVIEW OF STRATEGIES ADOPTED BY KEY MARKET PLAYERS
                    TABLE 109 COMPANIES ADOPTED ACQUISITION AS KEY GROWTH STRATEGY BETWEEN 2018 AND 2022
    9.3 REVENUE ANALYSIS 
           9.3.1 CARBON FIBER CONSTRUCTION REPAIR MARKET: REVENUE ANALYSIS OF TOP 5 MARKET PLAYERS
                    FIGURE 41 REVENUE ANALYSIS OF KEY COMPANIES (2018–2022)
    9.4 MARKET SHARE ANALYSIS 
          FIGURE 42 MARKET SHARE OF TOP 5 COMPANIES IN CARBON FIBER CONSTRUCTION REPAIR MARKET
           9.4.1 RANKING OF KEY MARKET PLAYERS
                    FIGURE 43 RANKING OF TOP FIVE PLAYERS IN CARBON FIBER CONSTRUCTION REPAIR MARKET
    9.5 COMPANY EVALUATION MATRIX (TIER 1) 
           9.5.1 STARS
           9.5.2 EMERGING LEADERS
           9.5.3 PERVASIVE PLAYERS
           9.5.4 PARTICIPANTS
                    FIGURE 44 CARBON FIBER CONSTRUCTION REPAIR MARKET: COMPANY EVALUATION MATRIX FOR TIER 1 COMPANIES
           9.5.5 COMPANY FOOTPRINT
                    TABLE 110 COMPANY OVERALL FOOTPRINT
                    TABLE 111 COMPANY APPLICATION FOOTPRINT
                    TABLE 112 COMPANY REGION FOOTPRINT
    9.6 START-UP/SME EVALUATION MATRIX 
           9.6.1 PROGRESSIVE COMPANIES
           9.6.2 RESPONSIVE COMPANIES
           9.6.3 DYNAMIC COMPANIES
           9.6.4 STARTING BLOCKS
                    FIGURE 45 CARBON FIBER CONSTRUCTION REPAIR MARKET: START-UP/SME EVALUATION MATRIX, 2023
           9.6.5 COMPETITIVE BENCHMARKING
                    TABLE 113 CARBON FIBER CONSTRUCTION REPAIR MARKET: DETAILED LIST OF KEY STARTUP/SMES
                    TABLE 114 CARBON FIBER CONSTRUCTION REPAIR MARKET: COMPETITIVE BENCHMARKING OF KEY STARTUPS/SMES, BY TYPE
                    TABLE 115 CARBON FIBER CONSTRUCTION REPAIR MARKET: COMPETITIVE BENCHMARKING OF STARTUPS/SMES, BY APPLICATION
                    TABLE 116 CARBON FIBER CONSTRUCTION REPAIR MARKET: COMPETITIVE BENCHMARKING OF KEY STARTUPS, BY REGION
    9.7 COMPETITIVE SITUATION AND TRENDS 
           9.7.1 DEALS
                    TABLE 117 CARBON FIBER CONSTRUCTION REPAIR: DEALS, 2018–2022
           9.7.2 OTHERS
                    TABLE 118 CARBON FIBER CONSTRUCTION REPAIR: OTHERS, 2018–2022
 
10 COMPANY PROFILES (Page No. - 147)
(Business overview, Products offered, Recent Developments, Deals, MNM view, Right to win, Strategic Choices, Weaknesses and competitive threats)*
     10.1 KEY PLAYERS 
             10.1.1 SIKA AG
                        TABLE 119 SIKA AG: COMPANY OVERVIEW
                        FIGURE 46 SIKA AG: COMPANY SNAPSHOT
                        TABLE 120 SIKA AG: PRODUCT OFFERINGS
                        TABLE 121 SIKA AG: DEALS
             10.1.2 MAPEI SPA
                        TABLE 122 MAPEI SPA: COMPANY OVERVIEW
                        FIGURE 47 MAPEI SPA: COMPANY SNAPSHOT
                        TABLE 123 MAPEI SPA: PRODUCT OFFERINGS
                        TABLE 124 MAPEI SPA: DEALS
                        TABLE 125 MAPEI SPA: OTHER DEVELOPMENTS
             10.1.3 FOSROC INC.
                        TABLE 126 FOSROC INC.: COMPANY OVERVIEW
                        TABLE 127 FOSROC INC.: PRODUCT OFFERINGS
                        TABLE 128 FOSROC INC.: DEALS
             10.1.4 MASTER BUILDERS SOLUTIONS
                        TABLE 129 MASTER BUILDERS SOLUTIONS: COMPANY OVERVIEW
                        TABLE 130 MASTER BUILDERS SOLUTIONS: PRODUCT OFFERINGS
             10.1.5 CRITICA INFRASTRUCTURE
                        TABLE 131 CRITICA INFRASTRUCTURE: COMPANY OVERVIEW
                        TABLE 132 CRITICA INFRASTRUCTURE: PRODUCT OFFERINGS
             10.1.6 AB-SCHOMBURG YAPI KIMYASALLARI A.S.
                        TABLE 133 AB-SCHOMBURG YAPI KIMYASALLARI A.S.: COMPANY OVERVIEW
                        TABLE 134 AB-SCHOMBURG YAPI KIMYASALLARI A.S.: PRODUCT OFFERINGS
             10.1.7 DOWAKSA
                        TABLE 135 DOWAKSA: COMPANY OVERVIEW
                        TABLE 136 DOWAKSA: PRODUCT OFFERINGS
             10.1.8 DEXTRA GROUP
                        TABLE 137 DEXTRA GROUP: COMPANY OVERVIEW
                        TABLE 138 DEXTRA GROUP: PRODUCT OFFERINGS
             10.1.9 RHINO CARBON FIBER REINFORCEMENT PRODUCTS
                        TABLE 139 STEKLONIT JSC: COMPANY OVERVIEW
                        TABLE 140 RHINO CARBON FIBER REINFORCEMENT PRODUCTS: PRODUCT OFFERINGS
             10.1.10 MITSUBISHI CHEMICAL CORPORATION
                        TABLE 141 MITSUBISHI CHEMICAL COMPANY: COMPANY OVERVIEW
                        FIGURE 48 MITSUBISHI CHEMICAL CORPORATION: COMPANY SNAPSHOT
                        TABLE 142 MITSUBISHI CHEMICAL CORPORATION: PRODUCT OFFERINGS
                        TABLE 143 MITSUBISHI CHEMICAL CORPORATION: DEALS
                        TABLE 144 MITSUBISHI CHEMICAL CORPORATION: OTHER DEVELOPMENTS
             10.1.11 TORAY INDUSTRIES INC.
                        TABLE 145 TORAY INDUSTRIES INC: COMPANY OVERVIEW
                        FIGURE 49 TORAY INDUSTRIES INC.: COMPANY SNAPSHOT
                        TABLE 146 TORAY INDUSTRIES INC.: PRODUCT OFFERINGS
             10.1.12 SIMPSON STRONG-TIE COMPANY INC.
                        TABLE 147 SIMPSON STRONG-TIE COMPANY INC.: COMPANY OVERVIEW
                        TABLE 148 SIMPSON STRONG-TIE COMPANY INC.: PRODUCT OFFERINGS
             10.1.13 ANTOP GLOBAL TECHNOLOGY CO., LTD.
                        TABLE 149 ANTOP GLOBAL TECHNOLOGY CO., LTD.: COMPANY OVERVIEW
                        TABLE 150 ANTOP GLOBAL TECHNOLOGY CO., LTD.: PRODUCT OFFERINGS
             10.1.14 SIREG GEOTECH S.R.L.
                        TABLE 151 SIREG GEOTECH S.R.L.: COMPANY OVERVIEW
                        TABLE 152 SIREG GEOTECH S.R.L.: PRODUCT OFFERINGS
             10.1.15 CHOMARAT GROUP
                        TABLE 153 CHOMARAT GROUP: COMPANY OVERVIEW
                        TABLE 154 CHOMARAT GROUP: PRODUCT OFFERINGS
*Details on Business overview, Products offered, Recent Developments, Deals, MNM view, Right to win, Strategic Choices, Weaknesses and competitive threats might not be captured in case of unlisted companies.
     10.2 OTHER PLAYERS 
             10.2.1 ZHONGAO CARBON
                        TABLE 155 ZHONGAO CARBON: BUSINESS OVERVIEW
             10.2.2 JIANGSU NONGCHAOER COMPOSITE MATERIAL CO., LTD.
                        TABLE 156 JIANGSU NONGCHAOER COMPOSITE MATERIAL CO., LTD.: BUSINESS OVERVIEW
             10.2.3 TEIJIN CARBON
                        TABLE 157 TEIJIN CARBON: BUSINESS OVERVIEW
             10.2.4 CHANGZHOU JLON COMPOSITE CO., LTD.
                        TABLE 158 CHANGZHOU JLON COMPOSITE CO., LTD.: BUSINESS OVERVIEW
             10.2.5 RELIANCE COMPOSITES
                        TABLE 159 RELIANCE COMPOSITES: BUSINESS OVERVIEW
             10.2.6 DRIZORO S.A.U
                        TABLE 160 DRIZORO S.A.U: BUSINESS OVERVIEW
             10.2.7 CARBON-CORE CORP.
                        TABLE 161 CARBON-CORE CORP.: BUSINESS OVERVIEW
             10.2.8 HEXCEL
                        TABLE 162 HEXCEL: BUSINESS OVERVIEW
             10.2.9 HINDOOSTAN COMPOSITE SOLUTIONS
                        TABLE 163 HINDOOSTAN COMPOSITE SOLUTIONS: BUSINESS OVERVIEW
 
11 APPENDIX (Page No. - 190)
     11.1 DISCUSSION GUIDE 
     11.2 KNOWLEDGESTORE: MARKETSANDMARKETS’ SUBSCRIPTION PORTAL 
     11.3 CUSTOMIZATION OPTIONS 
     11.4 RELATED REPORTS 
     11.5 AUTHOR DETAILS 

The study involves two major activities in estimating the current market size for the carbon fiber construction repair market. Exhaustive secondary research was done to collect information on the market, peer market, and parent market. The next step was to validate these findings, assumptions, and sizing with industry experts across the value chain through primary research. Both top-down and bottom-up approaches were employed to estimate the complete market size. After that, market breakdown and data triangulation were used to estimate the market size of segments and subsegments.

Secondary Research

Secondary sources referred to for this research study include financial statements of companies offering carbon fiber construction repair and information from various trade, business, and professional associations. Secondary research has been used to obtain critical information about the industry’s value chain, the total pool of key players, market classification, and segmentation according to industry trends to the bottom-most level and regional markets. The secondary data was collected and analyzed to arrive at the overall size of the carbon fiber construction repair market, which was validated by primary respondents.

Primary Research

Extensive primary research was conducted after obtaining information regarding the carbon fiber construction repair market scenario through secondary research. Several primary interviews were conducted with market experts from both the demand and supply sides across major countries of North America, Europe, Asia Pacific, the Middle East & Africa, and Latin America. Primary data was collected through questionnaires, emails, and telephonic interviews. The primary sources from the supply side included various industry experts, such as Chief X Officers (CXOs), Vice Presidents (VPs), Directors from business development, marketing, product development/innovation teams, and related key executives from carbon fiber construction repair industry vendors; system integrators; component providers; distributors; and key opinion leaders. Primary interviews were conducted to gather insights such as market statistics, data on revenue collected from the products and services, market breakdowns, market size estimations, market forecasting, and data triangulation. Primary research also helped in understanding the various trends related to product type, application, vertical, and region. Stakeholders from the demand side, such as CIOs, CTOs, CSOs, and installation teams of the customer/end users who are using carbon fiber products for construction repair activities were interviewed to understand the buyer’s perspective on the suppliers, products, component providers, and their current usage of carbon fiber products and future outlook of their business which will affect the overall market.

The Breakup of Primary Research:

Carbon Fiber Construction Repair Market Size, and Share

To know about the assumptions considered for the study, download the pdf brochure

Market Size Estimation

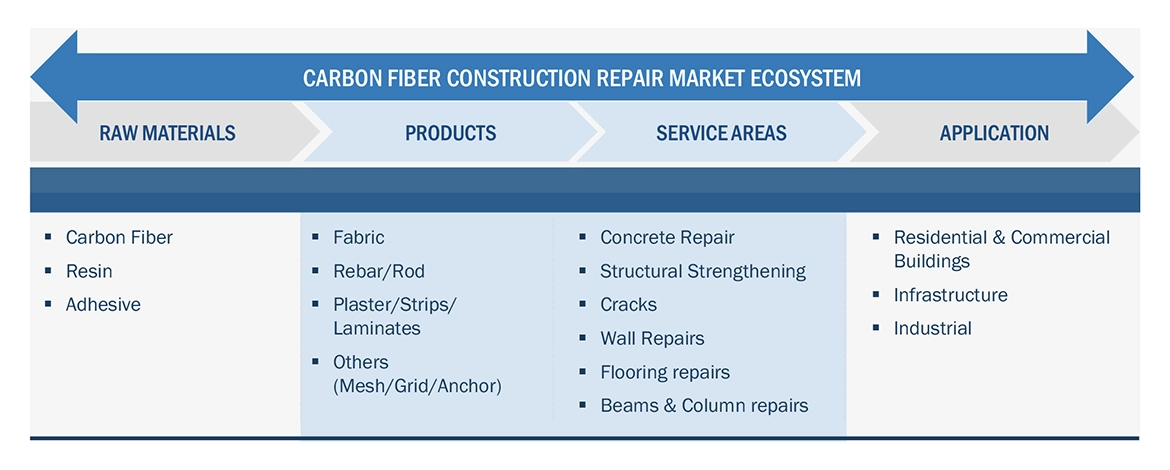
The research methodology used to estimate the size of the carbon fiber construction repair market includes the following details. The market sizing of the market was undertaken from the demand side. The market was upsized based on procurements and modernizations in carbon fiber construction repair in different applications of the construction repair industry at a regional level. Such procurements provide information on the demand aspects of the carbon fiber construction repair industry for each application. For each application, all possible segments of the carbon fiber construction repair market were integrated and mapped.

Carbon Fiber Construction Repair Market Size: Botton Up Approach

Carbon Fiber Construction Repair Market Size, and Share

To know about the assumptions considered for the study, Request for Free Sample Report

Carbon Fiber Construction Repair Market Size: Top-Down Approach

Carbon Fiber Construction Repair Market Size, and Share

Data Triangulation

After arriving at the overall size from the market size estimation process explained above, the total market was split into several segments and subsegments. The data triangulation and market breakdown procedures explained below were implemented, wherever applicable, to complete the overall market engineering process and arrive at the exact statistics for various market segments and subsegments. The data was triangulated by studying various factors and trends from the demand and supply sides. Along with this, the market size was validated using both the top-down and bottom-up approaches.

Market Definition

Carbon fibers are a type of high-performance fiber used in civil engineering. Carbon fiber, also known as graphite fiber or carbon graphite, is made up of very thin strands of the element carbon. These fibers are extremely strong for their size and have a high tensile strength. They have the potential to be the strongest material. Carbon fibers outperform glass fibers in terms of elastic modulus and fatigue strength. When it comes to service life, studies show that carbon fiber reinforced polymers outperform aramid, basalt and glass fibers. They are also highly chemically resistant, have a high temperature tolerance with low thermal expansion, and are resistant to corrosion.

Carbon fiber's high strength, lightweight, and corrosion resistance make it an ideal reinforcing material. Carbon fiber reinforced polymer is used in a variety of structural engineering applications due to its potential construction benefits and cost effectiveness. The most common applications are strengthening structures made of concrete, steel, timber, masonry, and cast iron; retrofitting to increase the load capacity of old structures such as bridges; and enhancing shear strength and flexure in reinforced concrete structures. Other applications include steel replacement, prestressing materials, and strengthening cast-iron beams.

Key Stakeholders

  • Construction composites manufacturers
  • Carbon fiber manufactures
  • Raw material manufacturers
  • Universities, governments, and research organizations
  • Construction composites associations and industrial bodies
  • Research and consulting firms
  • R&D institutions
  • Environmental support agencies
  • Investment banks and private equity firms

Report Objectives

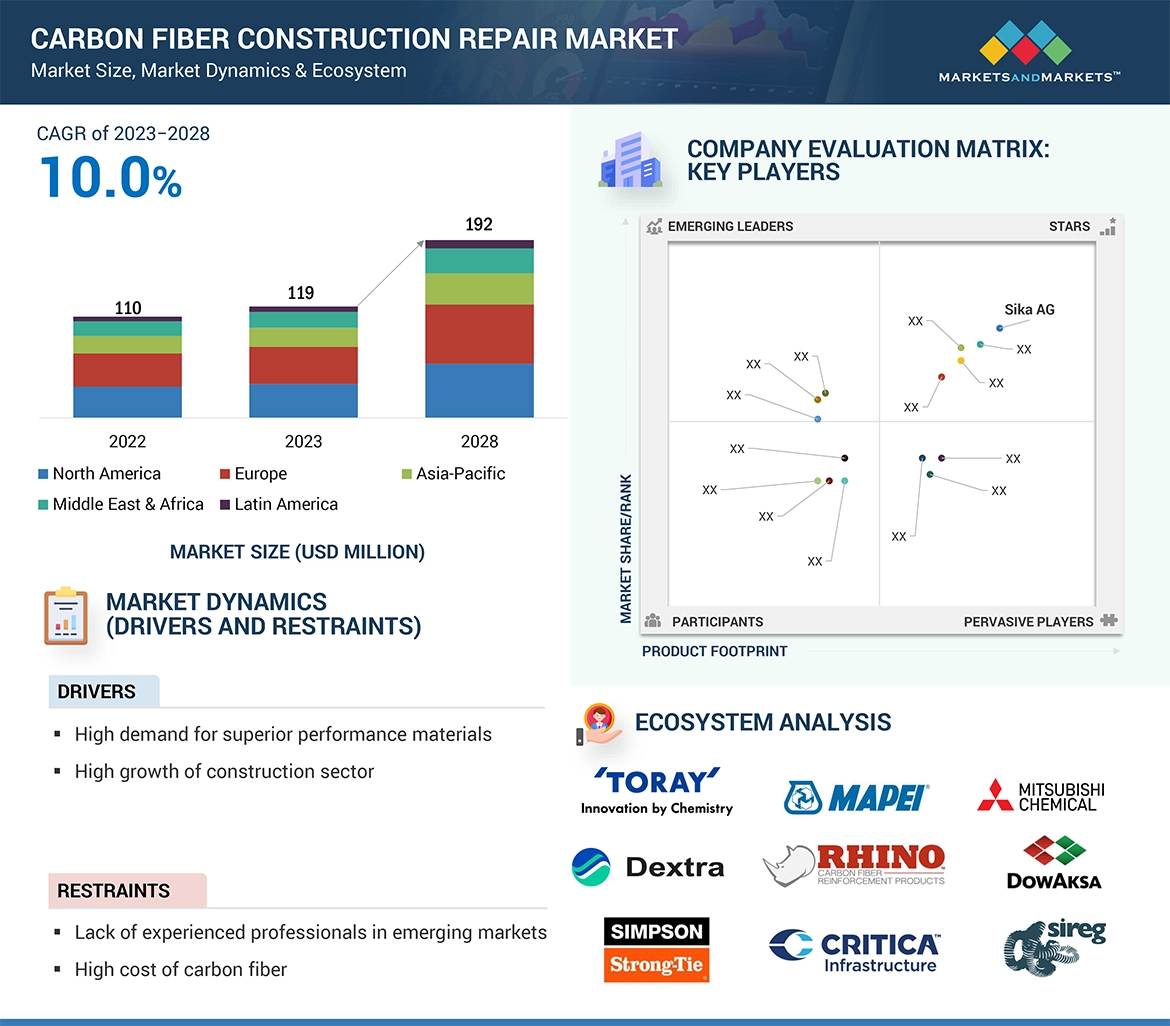
  • To define, describe, and forecast the carbon fiber construction repair market size in terms of volume and value
  • To provide detailed information regarding the key factors, such as drivers, restraints, opportunities, and challenges influencing the growth of the market
  • To analyze and project the global carbon fiber construction repair market, by product type, application, and region
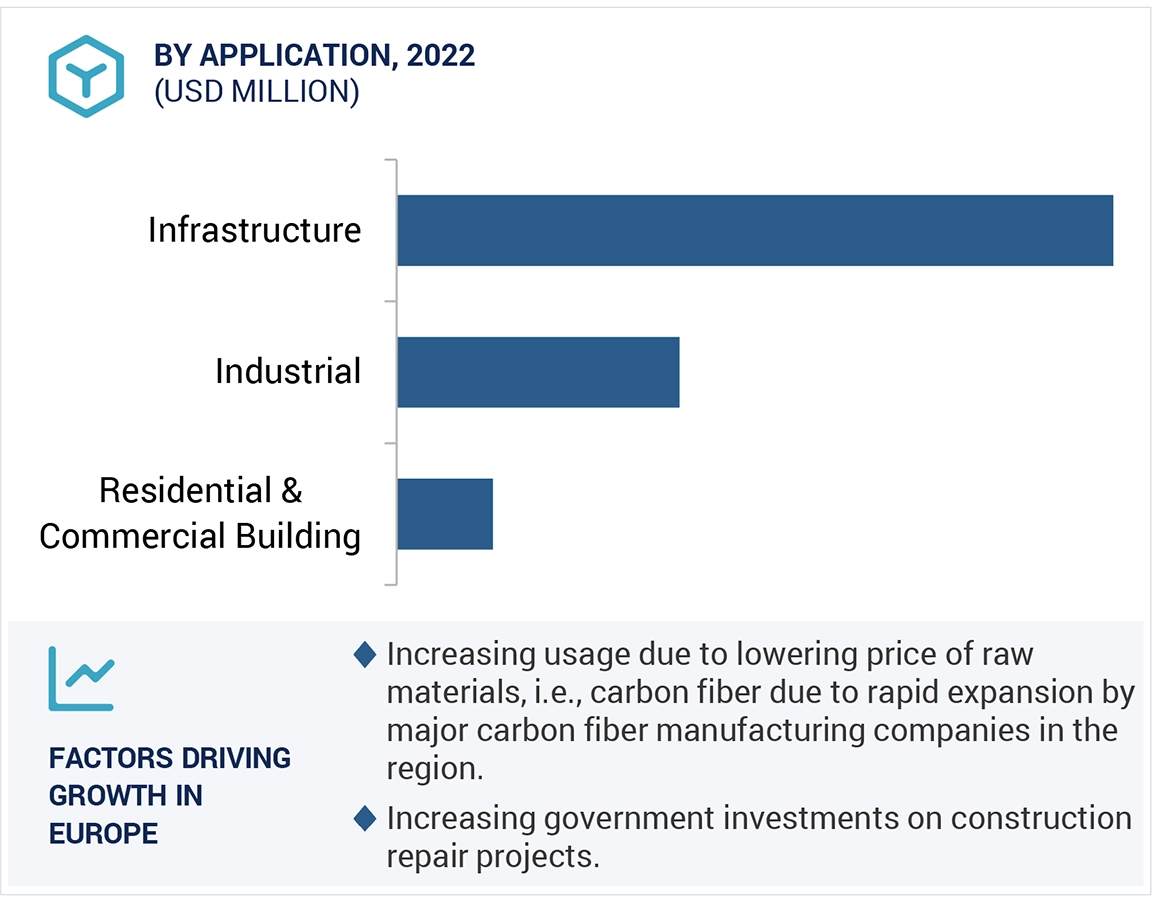
  • To forecast the market size with respect to five main regions (along with country-level data), namely, North America, Europe, Asia Pacific, Latin America, and the Middle East & Africa and analyze the significant region-specific trends
  • To strategically analyze the market with respect to individual growth trends, prospects, and contribution of the submarkets to the overall market
  • To analyze the market opportunities and the competitive landscape for stakeholders and market leaders
  • To analyze recent market developments and competitive strategies, such as agreements, contracts, acquisitions, and new product development/new product launch, to draw the competitive landscape.
  • To strategically profile the key market players and comprehensively analyze their core competencies

Available Customizations

MarketsandMarkets offers following customizations for this market report:

  • Additional country-level analysis of the carbon fiber construction repair market

Product Analysis

  • Product matrix, which provides a detailed comparison of the product portfolio of each company's market
Custom Market Research Services

We will customize the research for you, in case the report listed above does not meet with your exact requirements. Our custom research will comprehensively cover the business information you require to help you arrive at strategic and profitable business decisions.

Request Customization
Report Code
CH 8835
Published ON
Oct, 2023
Choose License Type
BUY NOW
  • SHARE
X
Request Customization
Speak to Analyst
Speak to Analyst
OR FACE-TO-FACE MEETING
PERSONALIZE THIS RESEARCH
  • Triangulate with your Own Data
  • Get Data as per your Format and Definition
  • Gain a Deeper Dive on a Specific Application, Geography, Customer or Competitor
  • Any level of Personalization
REQUEST A FREE CUSTOMIZATION
LET US HELP YOU!
  • What are the Known and Unknown Adjacencies Impacting the Carbon Fiber Construction Repair Market
  • What will your New Revenue Sources be?
  • Who will be your Top Customer; what will make them switch?
  • Defend your Market Share or Win Competitors
  • Get a Scorecard for Target Partners
CUSTOMIZED WORKSHOP REQUEST
+1-888-600-6441
  • Call Us
  • +1-888-600-6441 (Corporate office hours)
  • +1-888-600-6441 (US/Can toll free)
  • +44-800-368-9399 (UK office hours)
CONNECT WITH US
ABOUT TRUST ONLINE
©2024 MarketsandMarkets Research Private Ltd. All rights reserved
DMCA.com Protection Status Website Feedback