Carrier Screening Market Size, Share & Trends by Product and Service, Type (Expanded (Customized, Predesigned) Targeted Diseases, Medical condition (Hematologic, Pulmonary), Technology (DNA Sequencing, PCR), End User, Region - Global Forecast to 2028
Carrier Screening Market Size, Share & Trends
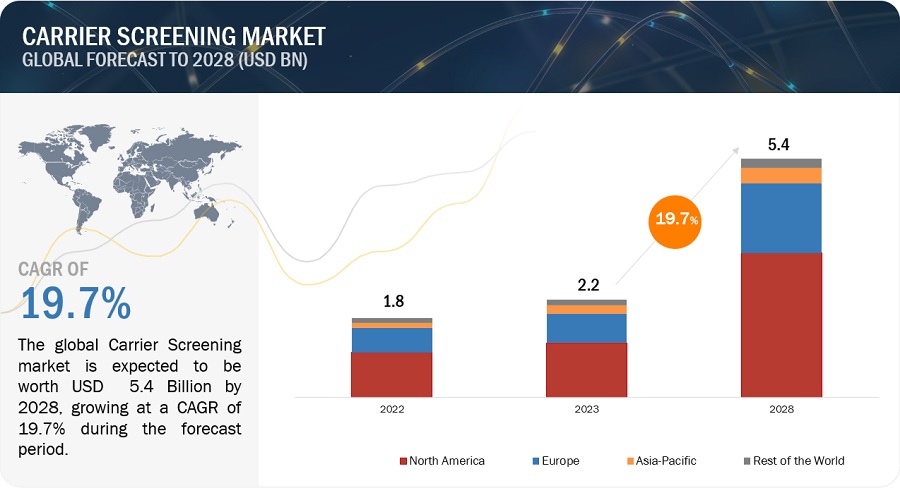
The size of global carrier screening market in terms of revenue was estimated to be worth $2.2 Billion in 2023 and is poised to reach $5.4 Billion by 2028, growing at a CAGR of 19.7% from 2023 to 2028. The comprehensive research encompasses an exhaustive examination of industry trends, meticulous pricing analysis, patent scrutiny, insights derived from conferences and webinars, identification of key stakeholders, and a nuanced understanding of market purchasing dynamics.
The expansion of this market is majorly due to the development and availability of expanded carrier screening panels that cover a wide range of genetic conditions contribute to the market's growth. Comprehensive panels offer more thorough assessments, and healthcare providers adopt them to provide more extensive genetic information to patients. However, Despite efforts to increase awareness, many individuals and healthcare professionals may still have limited knowledge about the availability and importance of carrier screening. Lack of awareness can contribute to underutilization of carrier screening services which may inhibit the growth of this market.
Carrier Screening Market Trends
To know about the assumptions considered for the study, Request for Free Sample Report
Global Carrier Screening Market Dynamics
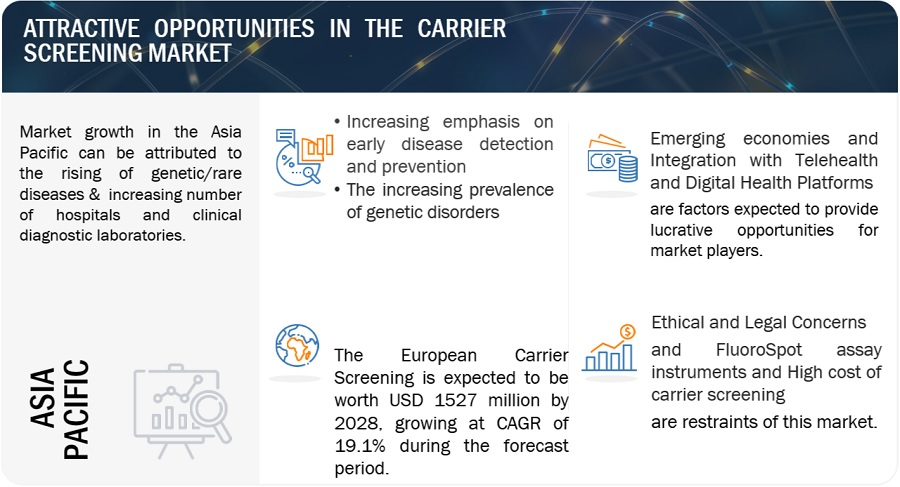
DRIVER: the increasing prevalence of genetic disorders
The rising prevalence and awareness of genetic diseases contribute significantly to the growth and demand in the carrier screening market. Carrier screening is a crucial tool for identifying individuals who carry a single copy of a gene mutation associated with a specific genetic disorder.
There are an estimated 10,000 different types of single-gene diseases (also called monogenic diseases), which are diseases caused by mutations in a single gene. The World Health Organization estimates that 10 out of every 1000 people are affected. This means that between 70 million and 80 million people in the world are living with one of these diseases. Similarly, as per the NIH, around 350 million people are living with rare disorders, and this is a disorder or condition with fewer than 200,000 people diagnosed. About 80% of these rare disorders are genetic in origin, and 95% of them do not have even one treatment approved by the FDA. In addition, as per a new scientific paper published in the European Journal of Human Genetics has confirmed that the number of people worldwide living with a rare disease is estimated at 300 million.
In addition, the rising prevalence of hereditary cancer is indeed a significant driver for the market. Carrier screening, particularly for cancer susceptibility genes, plays a crucial role in identifying individuals who carry genetic mutations associated with an increased risk of developing certain types of cancer. For instance, as per the NIH, up to 10% of all cancers may cause by inherited genetic changes. As a result, The rising prevalence of genetic diseases underscores the importance of carrier screening as a preventive measure and a tool for informed decision-making in family planning. As awareness continues to grow the market is likely to play an increasingly crucial role in managing and preventing genetic diseases.
RESTRAINT: high cost of carrier screening
The high cost of carrier screening can indeed be a significant restraint for market growth. The affordability and accessibility of genetic testing services, including carrier screening, are key factors that influence the adoption of these services by individuals, couples, and healthcare providers. High costs may limit access to carrier screening services for individuals and couples with limited financial means. This can result in disparities in healthcare, where only those who can afford the testing may benefit, creating inequities in access. Similarly, the high cost of carrier screening may lead to reduced adoption rates, as individuals and couples may be deterred by the financial burden associated with undergoing the testing. This can impact the overall uptake of carrier screening services.
For instance, the Centers for Medicare & Medicaid Services, or CMS, establishes payment levels and coverage rules under Medicare, while state Medicaid programs and commercial health plans establish rates and coverage rules independently in accordance with applicable rules. As such, the reimbursement rates for our diagnostic tests vary by third-party payer. CMS has established a pricing benchmark of USD 2,450 for expanded carrier screening testing. Similarly, as per the article published by obstetrics & Gynecology 2023, the price of 22 panels ranged from USD 349 to USD 4320 per couple in USD.
As a result, High costs may influence consumer perception and acceptance of carrier screening. Individuals and couples may question the value proposition of the testing in relation to the associated financial investment which can cause a threat to market growth.
OPPORTUNITY: integration with telehealth and digital health platforms
The integration of telehealth and digital health platforms creates significant opportunities within the market. Leveraging digital technologies enhances accessibility, improves the efficiency of genetic testing services, and contributes to a more patient-centered approach. Telehealth platforms enable individuals, especially those in remote or underserved areas, to access carrier screening services without the need to visit a physical healthcare facility. This increased accessibility helps reach a broader population. Similarly, telehealth platforms allow for the provision of preconception and prenatal care services, including carrier screening consultations. This supports individuals and couples in making decisions about family planning and managing genetic risks during pregnancy. In addition, Digital health platforms support ongoing follow-up care after carrier screening. This includes virtual consultations, monitoring of genetic risks, and the development of personalized care plans based on screening results. One of the recent developments in this segment is as below:
In 2022, Ambry Genetics (Ambry), a clinical diagnostic testing and a subsidiary of REALM IDx, launched a new reproductive health program that is driven by its CARE ProgramTM (Comprehensive Assessment Risk and Education), a digital platform that enhances the patient and provider experience through easier access to genetic education, testing, reporting, and counseling. This end-to-end program improves family planning and prenatal care by expanding access to carrier screening and NIPT, also known as non-invasive prenatal screening (NIPS), and by helping patients make informed decisions. NIPT is for screening, not diagnosis.
CHALLENGE: dearth of skilled professionals
In diagnostic laboratories, there is a high demand for technicians who are well-versed in handling advanced diagnostic techniques such as sequencing & PCR and capable of interpreting large volumes of data. However, there is a huge supply gap for such professionals worldwide.
According to data reported on Sep 22, 2022, by Education, Lab Management, it was estimated that the industry is short between 20,000 and 25,000 laboratory technologists, with roughly 335,000 such professionals currently employed nationwide. That’s one technologist for every 1,000 U.S. citizens, a shortfall of about 7%.The large gap between the number of medical laboratory professionals graduating and the number of job vacancies in major markets is expected to hamper the growth of the market in the coming years. Likewise, as per the article published by Forbes 2022, in a survey of laboratory professionals by the American Society for Clinical Pathology showed that 85.3% reported burnout. An additional 36.5% complained of inadequate staffing and almost as many of too heavy workload. Lack of recognition was cited by 14.9%.
Furthermore, every genetic analysis testing method requires certain skills to choose appropriate methods and instruments for specific applications. Unskilled personnel limit the use of these products and technologies, resulting in unproductive practices and a lack of understanding of sequencing-based data and detection of genetic abnormalities. As a result, the lack of adequate knowledge regarding the right choice of consumables and instruments may result in incorrect diagnosis and critical delays in timelines. This, in turn, can offset the benefits offered by carrier screening.
Ecosystem Analysis of Carrier Screening Market

Source: MarketsandMarkets Analysis
An ecosystem analysis in the context of carrier screening involves examining the interconnected network of entities, stakeholders, and factors that influence the development, delivery, and utilization of carrier screening services. This analysis considers the broader ecosystem, including healthcare providers, laboratories, regulatory bodies, technology developers, and patients.
China is anticipated to account the second largest share of Apac Region of Carrier Screening Industry
Based on the Apac region, the Carrier Screening Market is divided into China, Japan, and India. China is expected to account the largest share of Market. This is due to the Growing awareness among the Chinese population about genetic disorders and the importance of carrier screening is a key driver. Educational initiatives and campaigns can contribute to increased demand for carrier screening services and increased healthcare spending in China which lead to improved access to advanced medical technologies, including carrier screening. In addition, The prevalence of genetic disorders in the Chinese population can drive the demand for carrier screening.
Germany is forecasted as the fastest growing country of Carrier Screening Industry in Europe.
Based on the Europe region, the Carrier Screening Market is divided into Germany, UK, Italy, Spain, France, and RoE. Germany is forecasted to be the fastest growing market of Market in Europe. Germany is known for its strong biomedical research community, including leading universities, research institutes, and healthcare facilities. The country's commitment to scientific research contributes to the demand for advanced diagnostic technologies like carrier screening. In addition, Germany has a robust healthcare infrastructure, which includes advanced laboratories and diagnostic facilities. The availability of well-equipped healthcare institutions supports the implementation and utilization of sophisticated diagnostic technologies such as carrier screening.
North America dominates the global Carrier Screening Industry
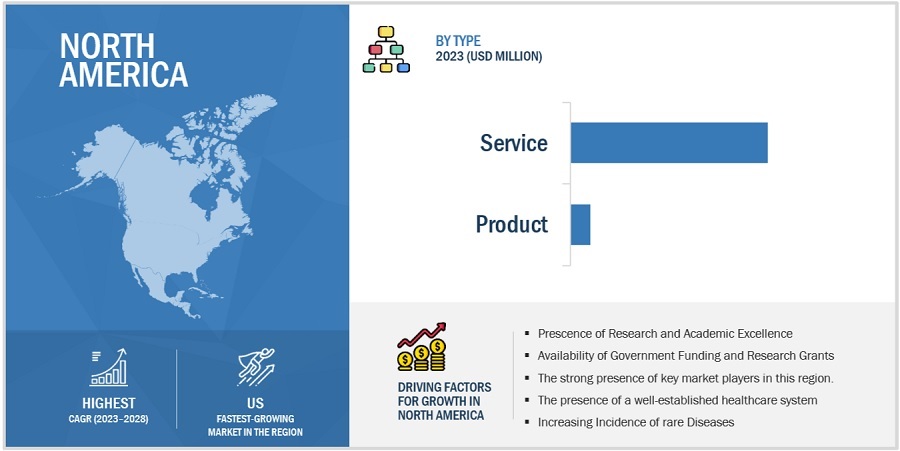
Based on the region, the Carrier Screening Market is segmented into North America, Europe, Asia Pacific, and the Rest of the World (RoW). North America is expected to dominate the Carrier Screening assay market. Growth in the North American market is mainly driven by the factors such as North America, boasts an advanced and well-established healthcare infrastructure. The presence of state-of-the-art laboratories, research institutions, and healthcare facilities provides a conducive environment for the adoption of advanced diagnostic technologies like carrier screening. Similarly, The region is home to some of the world's leading research institutions and academic centers. These institutions are often at the forefront of genetic research, including studies related to rare diseases, driving the demand for carrier screening services.
To know about the assumptions considered for the study, download the pdf brochure
Some of the players operating in North American market are: Invitae Corporation. (US), Fulgent Genetics. (US), OPKO Health, Inc. (US), Thermo Fisher Scientific Inc. (US), Quest Diagnostics Incorporated (US), Myriad Genetics, Inc (US), Illumina, Inc. (US), Natera, Inc. (Italy), Laboratory Corporation of America Holdings. (US), Otogenetics (US),
Targeted Diseases Carrier screening segment of Carrier screening industry to witness the second highest shares during the forecast period.
Based on the Type, the global Carrier Screening Market is segmented into Expanded Carrier Screening (Customized Panel Testing, Predesigned Panel Testing)., and Targeted Diseases Carrier screening. Targeted Diseases Carrier screening segment is expected to witness the second highest shares. The growth of this market is driven by due to its wide applications such as Targeted carrier screening is driven by the higher prevalence of certain genetic conditions within specific ethnic or racial groups likewise, In populations where consanguineous marriages (marriage between close relatives) are more common, targeted carrier screening may be conducted to identify genetic risks associated with consanguinity.
Hematologic Conditions segment of Carrier screening industry to witness the third highest shares during the forecast period.
Based on the Medical Conditions, Carrier Screening Market is classified into Hematologic Conditions, Pulmonary Conditions, Neurological Conditions, and Others. The Hematologic Conditions segment is forecasted to drive the third highest shares of Market. This is due to the rising cases of Thalassemias globally which is a genetic disorders that affect hemoglobin production, leading to anemia. Carrier screening can identify individuals carrying mutations associated with thalassemia, especially in populations with a higher prevalence of these mutations. Likewise, The prevalence of specific hematologic disorders in a population may drive the demand for carrier screening for these conditions.
Scope of the Carrier Screening Industry:
|
Report Metric |
Details |
|
Market Revenue Size in 2023 |
$2.2 billion |
|
Projected Revenue Size by 2028 |
$5.4 billion |
|
Industry Growth Rate |
Poised to Grow at a CAGR of 19.7% |
|
Market Driver |
the increasing prevalence of genetic disorders |
|
Market Opportunity |
integration with telehealth and digital health platforms |
This research report categorizes the Carrier Screening Market to forecast revenue and analyze trends in each of the following submarkets:
By Region
- North America
- Europe
- Asia Pacific
- Rest of the World
By Product and Service
- Product
- Service
By Type
- Targeted Diseases Carrier screening
- Expanded Carrier Screening
- Customized Panel Testing
- Predesigned Panel Testing
By Medical Conditions
- Hematologic Conditions
- Pulmonary Conditions
- Neurological Conditions
- Others
By Technology
- DNA Sequencing
- PCR
- DNA Microarray
- Other
By End User
- Hospitals and Medical Centers
- Clinical Laboratories
- Fertility Clinics
- Other End Users
Recent Developments of Carrier Screening Industry:
- In 2022, OPKO Health Acquired ModeX Therapeutics, to gain Proprietary Immunotherapy Technology with a Focus on Oncology and Infectious Diseases
- In 2021, DiaSorin acquired Luminex Corporation to expands DiaSorin’s offer in the molecular diagnostic sector gaining access to multiplexing technology, which allows analysis of multiple parameters from a single biological sample within a single run.
Frequently Asked Questions (FAQ):
What is the projected market revenue value of the global carrier screening Market?
The global carrier screening market boasts a total revenue value of $5.4 Billion by 2028.
What is the estimated growth rate (CAGR) of the global Carrier Screening Market?
The global carrier screening market has an estimated compound annual growth rate (CAGR) of 19.7% and a revenue size in the region of $2.2 Billion in 2023. .
To speak to our analyst for a discussion on the above findings, click Speak to Analyst
The study involved four major activities in estimating the current size of the Carrier Screening Market. Exhaustive secondary research was done to collect information on the market and its different subsegments. The next step was to validate these findings, assumptions, and sizing with industry experts across the value chain through primary research. Both top-down and bottom-up approaches were employed to estimate the complete market size. After that, market breakdown and data triangulation procedures were used to estimate the market size of the segments and subsegments.
Secondary Research
In the secondary research process, various secondary sources such as annual reports, press releases & investor presentations of companies, white papers, certified publications, articles by recognized authors, gold-standard & silver-standard websites, regulatory bodies, and databases (such as D&B Hoovers, Bloomberg Business, and Factiva) were referred to identify and collect information for this study.
Primary Research
Extensive primary research was conducted after acquiring knowledge about the global market scenario through secondary research. Primary interviews were conducted from both the demand (Doctors, Surgeons, Gynecologist, genetic consultant) and supply sides (Carrier Screening product/service providers and distributors).
The following is a breakdown of the primary respondents:
Breakdown of Primary Participants:
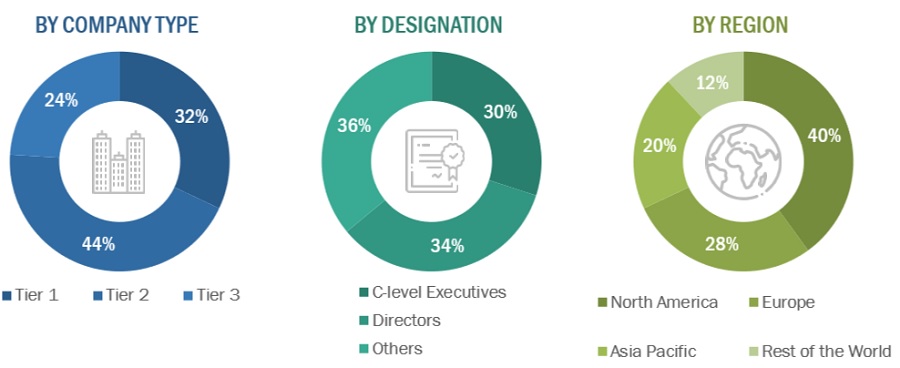
Note 1: Others include sales managers, marketing managers, and product managers.
Note 2. Tiers of companies are defined based on their total revenue. As of 2021: Tier 1 = >USD 5 billion, Tier 2 = USD 500 million to USD 5 billion, and Tier 3 = <USD 500 million.
To know about the assumptions considered for the study, download the pdf brochure
Market Size Estimation
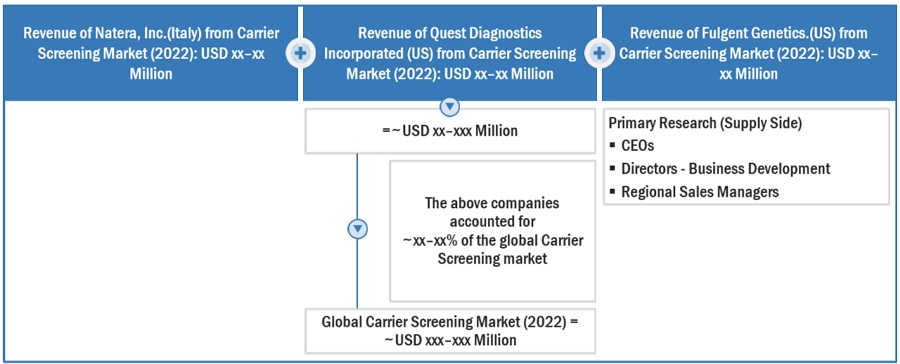
Both top-down and bottom-up approaches were used to estimate and validate the total size of the Carrier Screening Market. These methods were also used extensively to estimate the size of various subsegments in the market. The research methodology used to estimate the market size includes the following:
- The key players in the industry and markets have been identified through extensive secondary research
- The industry’s supply chain and market size, in terms of value, have been determined through primary and secondary research processes
- All percentage shares, splits, and breakdowns have been determined using secondary sources and verified through primary sources
To know about the assumptions considered for the study, Request for Free Sample Report

Data Triangulation
After arriving at the overall market size—using the market size estimation processes—the market was split into several segments and subsegments. To complete the overall market engineering process and arrive at the exact statistics of each market segment and subsegment, the data triangulation, and market breakdown procedures were employed, wherever applicable. The data was triangulated by studying various factors and trends from both the demand and supply sides in the Carrier Screening Market industry.
Market Definition
Carrier screening is a type of genetic testing that is used to determine if a person is a carrier for a specific autosomal recessive disease. Similarly, when it is done before or during pregnancy, it allows to find out the chances of having a child with a genetic disorder. Carrier screening involves testing a sample of blood, saliva, or tissue from the inside of the cheek.
Market Stakeholders
- Carrier screening product manufacturers, vendors, and distributors
- Carrier screening service companies
- Hospitals and private physician clinics
- Reference laboratories
- Donor banks
- Health insurance payers
- Research & consulting firms
- Diagnostic Centers, and Medical Colleges
- Research Institutes
- Clinical Laboratories
- Distributors of Carrier Screening Products and services
Report Objectives
- To define, describe, and forecast the global Carrier Screening Market based on Product & Service, Type, Medical Condition, Technology, End User, and Region
- To provide detailed information regarding the major factors influencing the growth of the market (drivers, opportunities, and industry-specific challenges)
- To strategically analyze micromarkets1 with respect to individual growth trends, future prospects, and contributions to the total market
- To analyze opportunities in the market for stakeholders and provide details of the competitive landscape for market leaders
- To forecast the size of market segments with respect to four main regions—North America, Europe, Asia Pacific and the Rest of the World (RoW)2
- To strategically profile key players and comprehensively analyze their product portfolios, market shares, and core competencies
- To track and analyze competitive developments such as acquisitions, expansions, new product launches, and partnerships in the Carrier Screening Market.
Available Customizations:
With the given market data, MarketsandMarkets offers customizations as per the company’s specific needs. The following customization options are available for the report:
- Product Analysis: Product matrix, which gives a detailed comparison of the product portfolios of each company
- Geographic Analysis: Further breakdown of the European Carrier Screening Market into specific countries.


 Generating Response ...


Growth opportunities and latent adjacency in Carrier Screening Market