COVID-19 Impact on Analytics Market by Components, Verticals and Region - Global Forecast to 2021
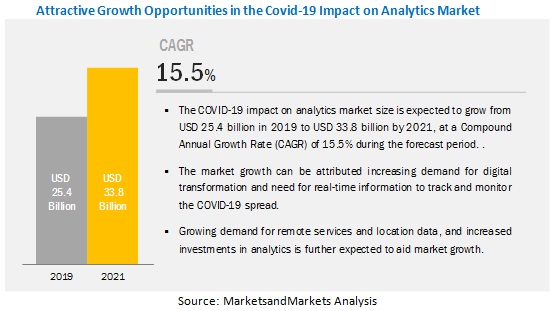
[83 Pages Report] The COVID-19 impact on the global analytics market size is expected to grow from USD 25.4 billion in 2019 to USD 33.8 billion by 2021, at a Compound Annual Growth Rate (CAGR) of 15.5% during the forecast period. The major factors driving the growth of COVID-19 impact on the analytics industry include increasing demand for digital transformation, increased investments in analytics, growing demand for remote services and location data, and increasing need for real-time information to track and monitor the COVID-19 spread.

The analytics solution segment to hold the largest size during the forecast period
Analytics can enable companies to increase operational efficiencies and reduce costs. With traditional data architecture and models, it becomes difficult for organizations to maintain data and make decisions effectively. Enterprises have realized the need for solutions that can access a large volume of data and empower data analysts to focus on data-driven objectives to gain data insights. The analytics solution is fit to leverage big quantities of data in a consistent way with algorithms to drive real-time results with streaming data. Modern big data analytics systems will provide organizations with speedy and efficient analytical procedures. This ability will allow businesses to work faster and achieve business goals.
The healthcare industry to grow at a rapid pace during the forecast period
During the COVID-19 pandemic, the healthcare industry vertical is under immense pressure to enhance and provide PPE, ventilators, prophylactic, and anti-viral drugs across the world. Healthcare organizations are using advanced technologies, such as analytics, AI, and machine learning to analyze the complex data around COVID-19 to monitor and reduce the impact of the virus.

North America to hold the highest market share during the forecast period
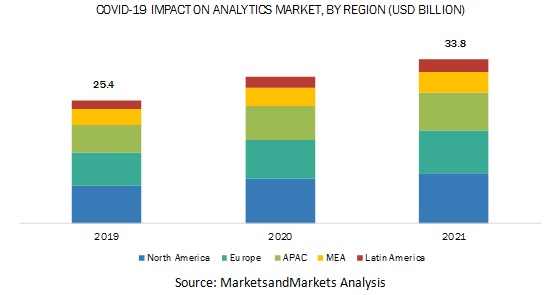
North America is expected to maintain the highest share in the global analytics market. In contrast, Asia Pacific (APAC) and Latin America are expected to grow at the highest CAGR during the forecast period. North America is the most significant revenue contributor in the global market. Growing challenges faced by various industry verticals, such as Banking, Financial Services & Insurance (BFSI), manufacturing, retail and eCommerce, and healthcare to efficiently process, manage, and store large data sets leading to the adoption of analytics solutions in the region.
Key market players
Major vendors in the global analytics market include Microsoft (US), Teradata (US), IBM (US), Oracle (US), SAS Institute (US), Google (US), Adobe (US), Talend (US), Qlik (US), TIBCO Software (US), Alteryx (US), Sisense (US), Informatica (US), Splunk (US), Hitachi Vantara (US), Information Builders (US), AWS (US), SAP (Germany), Salesforce (US), Micro Focus (UK), MicroStrategy (US), Gorilla Technology (US), and ThoughtSpot (US). These vendors have adopted various organic and inorganic growth strategies, such as new product launches, partnerships & collaborations, and mergers & acquisitions, to expand their presence in the global analytics market.
IBM (US) is one of the leading companies in this market. Using IBM Cognos Analytics, IBM has developed a new, interactive global dashboard to show the spread of COVID-19 across the globe. The COVID-19 data reflected in this dashboard is pulled from state and local governments and the World Health Organization. IBM has developed an Incidents Map on the IBM Weather Channel app and weather.com. The Incidents Map provides data by the state as well as by county-level. It includes trend graphs at the state level in the US, as well as the latest COVID-19 news and video from The Weather Channel editorial team. Public health information and patient education materials are also provided.
Get online access to the report on the World's First Market Intelligence Cloud
- Easy to Download Historical Data & Forecast Numbers
- Company Analysis Dashboard for high growth potential opportunities
- Research Analyst Access for customization & queries
- Competitor Analysis with Interactive dashboard
- Latest News, Updates & Trend analysis
Request Sample Scope of the Report
Get online access to the report on the World's First Market Intelligence Cloud
- Easy to Download Historical Data & Forecast Numbers
- Company Analysis Dashboard for high growth potential opportunities
- Research Analyst Access for customization & queries
- Competitor Analysis with Interactive dashboard
- Latest News, Updates & Trend analysis
|
Report Metrics |
Details |
|
Market size available for years |
2019–2021 |
|
Base year considered |
2019 |
|
Forecast period |
2020–2021 |
|
Forecast units |
Million (USD) |
|
Segments covered |
|
|
Geographies covered |
|
|
Companies covered |
Microsoft (US), Teradata (US), IBM (US), Oracle (US), SAS Institute (US), Google (US), Adobe (US), Talend (US), Qlik (US), TIBCO Software (US), Alteryx (US), Sisense (US), Informatica (US), Splunk (US), Hitachi Vantara (US), Information Builders (US), AWS (US), SAP (Germany), Salesforce (US), Micro Focus (UK), MicroStrategy (US), Gorilla Technology (US), and ThoughtSpot (US) |
This research report categorizes the COVID-19 impact on the analytics market based on components, industry verticals, and regions.
By component:
- Solutions
- Services
By industry vertical:
- Banking, Financial Services and Insurance (BFSI)
- Government and Defense
- Healthcare
- Manufacturing
- Retail
- Media and Entertainment
- Telecommunication and IT
- Energy and Utilities
- Transportation and Logistics
- Others
By region:
- North America
- Europe
- Asia Pacific (APAC)
- Middle East & Africa (MEA)
- Latin America
Recent developments
- In March 2020, AWS announced that it would invest USD 20 million for customers working on diagnostics solutions. The AWS Diagnostic Development Initiative (DDI) is open to accredited research institutions and private entities using AWS to support research-oriented workloads for the development of COVID-19 testing and diagnostics.
- On March 26, 2020, Nuance announced the availability of the free COVID-19 Content Pack for all Nuance Dragon Medical users and mobile solutions for care teams, which comprises more than 500,000 physicians worldwide.
- On March 25, 2020, Avaamo released Project COVID, an Intelligent Virtual Assistant that leverages Avaamo's Conversational AI and deep learning technologies to answer pressing questions on COVID-19.
- On March 31, 2020, GoodData and Emarsys launched the new COVID-19 Commerce Insight (ccinsight) project. It analyses a billion engagements and 400 million transactions showing the impact of COVID-19 on global and regional consumer spending by sector.
Critical questions the report answers
- Where are the short-to-mid-term growth opportunities in the analytics market, in the current COVID-19 scenario?
- In the current COVID-19 situation, which industry vertical will be the leading adopter of analytics solutions?
- Where will the COVID-19 related recent developments of market vendors take the industry in the short-to-mid-term?
- Who are the top vendors in the analytics market, and what are they doing to fight the COVID-19 pandemic?
- What will be the impact of COVI-19 on the market dynamics in the analytics market?
To speak to our analyst for a discussion on the above findings, click Speak to Analyst
TABLE OF CONTENTS
1 INTRODUCTION (Page No. - 12)
1.1 COVID-19 HEALTH ASSESSMENT
1.2 COVID-19 ECONOMIC ASSESSMENT
1.2.1 COVID-19 IMPACT ON THE ECONOMY—SCENARIO ASSESSMENT
2 RESEARCH METHODOLOGY (Page No. - 18)
2.1 INTRODUCTION
2.1.1 OBJECTIVES OF THE STUDY
2.1.2 DEFINITION
2.1.3 INCLUSIONS AND EXCLUSIONS
2.2 RESEARCH ASSUMPTIONS
2.3 DATA TRIANGULATION
2.3.1 PRIMARY DATA
2.4 STAKEHOLDERS
3 EXECUTIVE SUMMARY (Page No. - 22)
3.1 SUMMARY OF KEY FINDINGS
4 COVID-19 IMPACT ON ANALYTICS ECOSYSTEM AND EXTENDED ECOSYSTEM (Page No. - 23)
4.1 INTRODUCTION
4.2 ANALYTICS ECOSYSTEM AND STAKEHOLDERS
4.2.1 CORE ECOSYSTEM STAKEHOLDERS
4.2.2 EXTENDED ECOSYSTEM STAKEHOLDERS
4.2.3 EXTERNAL ECOSYSTEM STAKEHOLDERS
4.3 COVID-19-DRIVEN MARKET DYNAMICS
4.3.1 DRIVERS AND OPPORTUNITIES
4.3.2 RESTRAINTS AND CHALLENGES
4.3.3 CUMULATIVE GROWTH ANALYSIS
5 BUSINESS IMPLICATIONS OF COVID-19 ON ANALYTICS MARKET (Page No. - 30)
5.1 INTRODUCTION
5.2 IMPLICATIONS ON COMPONENT SEGMENT (PESSIMISTIC, AS-IS, AND OPTIMISTIC SCENARIOS)
5.2.1 SOLUTIONS FORECAST (2020–2021)
5.2.1.1 Forecast 2020–2021 (optimistic/as-is/pessimistic)
5.2.2 SERVICES FORECAST (2020–2021)
5.2.2.1 Forecast 2020–2021 (optimistic/as-is/pessimistic)
6 COVID-19 IMPACT ON MAJOR INDUSTRY VERTICALS WITH USE CASES AND HOW CLIENTS ARE RESPONDING TO THE CURRENT SITUATION (Page No. - 34)
6.1 INTRODUCTION
6.2 IMPACT OF COVID-19 ON THE BANKING, FINANCIAL SERVICES, AND INSURANCE (BFSI) INDUSTRY VERTICAL
6.2.1 FORECAST 2020–2021 (OPTIMISTIC/AS-IS/PESSIMISTIC)
6.2.2 KEY USE CASES: BFSI
6.2.3 MNM VIEWPOINT (VERTICAL’S RESPONSE TO COVID-19)
6.3 IMPACT OF COVID-19 ON THE TELECOMMUNICATIONS AND IT INDUSTRY VERTICAL
6.3.1 FORECAST 2020–2021 (OPTIMISTIC/AS-IS/PESSIMISTIC)
6.3.2 KEY USE CASES: TELECOMMUNICATIONS AND IT
6.3.3 MNM VIEWPOINT (VERTICAL’S RESPONSE TO COVID-19)
6.4 IMPACT OF COVID-19 ON THE HEALTHCARE INDUSTRY VERTICAL
6.4.1 FORECAST 2020–2021 (OPTIMISTIC/AS-IS/PESSIMISTIC)
6.4.2 KEY USE CASES: HEALTHCARE
6.4.3 MNM VIEWPOINT (VERTICAL’S RESPONSE TO COVID-19)
6.5 IMPACT OF COVID-19 ON THE MANUFACTURING INDUSTRY VERTICAL
6.5.1 FORECAST 2020–2021 (OPTIMISTIC/AS-IS/PESSIMISTIC)
6.5.2 KEY USE CASES: MANUFACTURING
6.5.3 MNM VIEWPOINT (VERTICAL’S RESPONSE TO COVID-19)
6.6 IMPACT OF COVID-19 ON THE RETAIL INDUSTRY VERTICAL
6.6.1 FORECAST 2020–2021 (OPTIMISTIC/AS-IS/PESSIMISTIC)
6.6.2 KEY USE CASES: RETAIL
6.6.3 MNM VIEWPOINT (VERTICAL’S RESPONSE TO COVID-19)
6.7 IMPACT OF COVID-19 ON THE TRANSPORTATION INDUSTRY VERTICAL
6.7.1 FORECAST 2020–2021 (OPTIMISTIC/AS-IS/PESSIMISTIC)
6.7.2 KEY USE CASES: TRANSPORTATION
6.7.3 MNM VIEWPOINT (VERTICAL’S RESPONSE TO COVID-19)
6.8 IMPACT OF COVID-19 ON THE ENERGY AND UTILITIES INDUSTRY VERTICAL
6.8.1 FORECAST 2020–2021 (OPTIMISTIC/AS-IS/PESSIMISTIC)
6.8.2 KEY USE CASES: ENERGY AND UTILITIES
6.8.3 MNM VIEWPOINT (VERTICAL’S RESPONSE TO COVID-19)
6.9 IMPACT OF COVID-19 ON THE MEDIA AND ENTERTAINMENT INDUSTRY VERTICAL
6.9.1 FORECAST 2020–2021 (OPTIMISTIC/AS-IS/PESSIMISTIC)
6.9.2 KEY USE CASES: MEDIA AND ENTERTAINMENT
6.9.3 MNM VIEWPOINT (VERTICAL’S RESPONSE TO COVID-19)
6.10 IMPACT OF COVID-19 ON THE GOVERNMENT AND DEFENSE INDUSTRY VERTICAL
6.10.1 FORECAST 2020–2021 (OPTIMISTIC/AS-IS/PESSIMISTIC)
6.10.2 KEY USE CASES: GOVERNMENT AND DEFENSE
6.10.3 MNM VIEWPOINT (VERTICAL’S RESPONSE TO COVID-19)
6.11 IMPACT OF COVID-19 ON OTHERS
6.11.1 FORECAST 2020–2021 (OPTIMISTIC/AS-IS/PESSIMISTIC)
6.11.2 KEY USE CASES: OTHERS
6.11.3 MNM VIEWPOINT (VERTICAL’S RESPONSE TO COVID-19)
7 IMPACT OF COVID-19 ON REGION (Page No. - 58)
7.1 INTRODUCTION
7.2 NORTH AMERICA
7.2.1 FORECAST 2020–2021 (OPTIMISTIC/AS-IS/PESSIMISTIC)
7.3 EUROPE
7.3.1 FORECAST 2020–2021 (OPTIMISTIC/AS-IS/PESSIMISTIC)
7.4 ASIA PACIFIC
7.4.1 FORECAST 2020–2021 (OPTIMISTIC/AS-IS/PESSIMISTIC)
7.5 MIDDLE EAST AND AFRICA
7.5.1 FORECAST 2020–2021 (OPTIMISTIC/AS-IS/PESSIMISTIC)
7.6 LATIN AMERICA
7.6.1 FORECAST 2020–2021 (OPTIMISTIC/AS-IS/PESSIMISTIC)
8 COVID-19-FOCUSED PROFILES OF KEY VENDORS (Page No. - 65)
8.1 INTRODUCTION
8.2 COMPANY PROFILES
9 APPENDIX (Page No. - 81)
9.1 KNOWLEDGE STORE: MARKETSANDMARKETS’ SUBSCRIPTION PORTAL
9.2 AUTHOR DETAILS
LIST OF TABLES (11 TABLES)
TABLE 1 COVID-19 RELATED BFSI USE CASES
TABLE 2 COVID-19 RELATED TELECOMMUNICATIONS AND IT USE CASES
TABLE 3 COVID-19 RELATED HEALTHCARE USE CASES
TABLE 4 COVID-19 RELATED MANUFACTURING USE CASES
TABLE 5 COVID-19 RELATED RETAIL USE CASES
TABLE 6 COVID-19 RELATED TRANSPORTATION USE CASES
TABLE 7 COVID-19 RELATED ENERGY AND UTILITIES USE CASES
TABLE 8 COVID-19 RELATED MEDIA AND ENTERTAINMENT USE CASES
TABLE 9 COVID-19 RELATED GOVERNMENT AND DEFENSE USE CASES
TABLE 10 COVID-19 RELATED OTHERS USE CASES
TABLE 11 COVID-19-ORIENTED PROFILES OF KEY ANALYTICS VENDORS
LIST OF FIGURES (40 FIGURES)
FIGURE 1 COVID-19: THE GLOBAL PROPAGATION
FIGURE 2 COVID-19 PROPAGATION: SELECT COUNTRIES
FIGURE 3 COUNTRIES BEGIN WITH SIMILAR TRAJECTORIES BUT CURVES DEVIATE BASED ON MEASURES TAKEN
FIGURE 4 REVISED GDP FORECAST FOR SELECT G20 COUNTRIES IN 2020
FIGURE 5 CRITERIA IMPACTING THE GLOBAL ECONOMY
FIGURE 6 SCENARIOS IN TERMS OF RECOVERY OF THE GLOBAL ECONOMY
FIGURE 7 BREAKUP OF PRIMARY RESPONDENT PROFILES
FIGURE 8 ANALYTICS ECOSYSTEM
FIGURE 9 ANALYTICS SEGMENTS COMPRISING THE ECOSYSTEM
FIGURE 10 IMPACT OF COVID-19 ON ANALYTICS MARKET, 2019-2021 (USD MILLION)
FIGURE 11 IMPACT OF COVID-19 ON THE ANALYTICS SOLUTIONS MARKET, 2019–2021 (USD MILLION)
FIGURE 12 IMPACT OF COVID-19 ON THE ANALYTICS SERVICES MARKET, 2019–2021 (USD MILLION)
FIGURE 13 IMPACT OF COVID-19 ON THE ANALYTICS CATEGORIES VERSUS INDUSTRY VERTICALS
FIGURE 14 ANALYTICS KEY APPLICATIONS: INDUSTRY VERTICAL
FIGURE 15 BFSI: ANALYTICS MARKET, 2019–2021 (USD MILLION)
FIGURE 16 KEY DRIVERS AND OPPORTUNITIES IN BFSI
FIGURE 17 TELECOMMUNICATIONS AND IT: MARKET, 2019–2021 (USD MILLION)
FIGURE 18 KEY DRIVERS AND OPPORTUNITIES IN TELECOMMUNICATIONS AND IT
FIGURE 19 HEALTHCARE: MARKET, 2019–2021 (USD MILLION)
FIGURE 20 KEY DRIVERS AND OPPORTUNITIES IN HEALTHCARE
FIGURE 21 MANUFACTURING: MARKET, 2019–2021 (USD MILLION)
FIGURE 22 KEY DRIVERS AND OPPORTUNITIES IN MANUFACTURING
FIGURE 23 RETAIL: MARKET, 2019–2021 (USD MILLION)
FIGURE 24 KEY DRIVERS AND OPPORTUNITIES IN RETAIL
FIGURE 25 TRANSPORTATION: MARKET, 2019–2021 (USD MILLION)
FIGURE 26 KEY DRIVERS AND OPPORTUNITIES IN TRANSPORTATION
FIGURE 27 ENERGY AND UTILITIES: ANALYTICS MARKET, 2019–2021 (USD MILLION)
FIGURE 28 KEY DRIVERS AND OPPORTUNITIES IN ENERGY AND UTILITIES
FIGURE 29 MEDIA AND ENTERTAINMENT: MARKET, 2019–2021 (USD MILLION)
FIGURE 30 KEY DRIVERS AND OPPORTUNITIES IN MEDIA AND ENTERTAINMENT
FIGURE 31 GOVERNMENT AND DEFENSE: MARKET, 2019–2021 (USD MILLION)
FIGURE 32 KEY DRIVERS AND OPPORTUNITIES IN GOVERNMENT AND DEFENSE
FIGURE 33 OTHERS: MARKET, 2019–2021 (USD MILLION)
FIGURE 34 KEY DRIVERS AND OPPORTUNITIES IN OTHERS
FIGURE 35 KEY DEVELOPMENTS ACROSS REGIONS
FIGURE 36 NORTH AMERICA: MARKET, 2019–2021 (USD MILLION)
FIGURE 37 EUROPE: MARKET, 2019–2021 (USD MILLION)
FIGURE 38 ASIA PACIFIC: MARKET, 2019–2021 (USD MILLION)
FIGURE 39 MIDDLE EAST AND AFRICA: MARKET, 2019–2021 (USD MILLION)
FIGURE 40 LATIN AMERICA: ANALYTICS MARKET, 2019–2021 (USD MILLION)
The study involved four major activities in estimating the current market size for the COVID-19 impact on the global analytics market. Extensive secondary research was done to collect information on the market, peer market, and the parent market. The next step was to validate these findings, assumptions, and sizing with industry experts across the value chain through primary research. Both top-down and bottom-up approaches were used to estimate the total market size. After that, the market breakup and data triangulation procedures were used to estimate the market size of the segments and subsegments of the big data market.
Secondary Research
In the secondary research process, various secondary sources, such as European Journal of Information Systems, International Journal of Big Data Intelligence and Applications (IJBDIA), Computational Statistics & Data Analysis by International Association for Statistical Computing (IASC), International Journal of Business Intelligence and Data Mining, have been referred to, for identifying and collecting information for this study. Secondary sources included annual reports; press releases, and investor presentations of companies; whitepapers, certified publications, and articles by recognized authors; Research and Development (R&D) organizations; regulatory bodies; and databases. Journals, repositories, and resources from the International Journal of Data Warehousing and Mining were referred to understand the integration of big data.
Primary Research
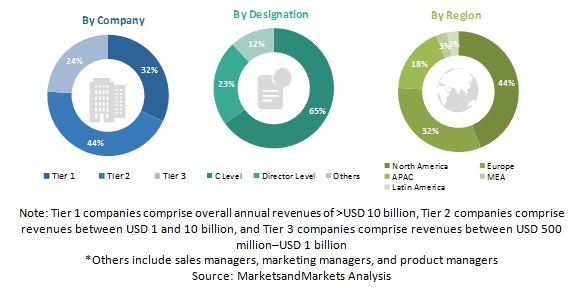
Various primary sources from both supply and demand sides were interviewed to obtain qualitative and quantitative information on the analytics market. The primary sources from the supply side included various industry experts, such as Chief X Officers (CXOs), Vice Presidents (VPs), directors, from business development, marketing, product development/innovation teams, and related key executives from analytics solution vendors, system integrators, professional service providers, industry associations, and analytics consultants and key opinion leaders. All possible parameters that affect the market covered in this research study have been accounted for, viewed in extensive detail, verified through primary research, and analyzed to get the final quantitative and qualitative data. The following is the breakup of primary profiles:

Market Size Estimation
Both top-down and bottom-up approaches were used to estimate and validate the total size of the big data market. The top-down approach was used to derive the revenue contribution of top vendors and their offerings in the big data market. The bottom-up approach was used to arrive at the overall market size of the global big data market using key companies’ revenue and their offerings in the market. The research methodology used to estimate the market size includes the following:
- The key players in the market were identified through extensive secondary research.
- The market size, in terms of value, was determined through primary and secondary research processes.
- All percentages, shares split, and breakups were determined using secondary sources and verified through primary sources.
Data Triangulation
After arriving at the overall market size using the market size estimation processes as explained above, the analytics market was split into several segments and subsegments. To complete the overall market engineering process and arrive at the exact statistics of each market segment and subsegment, data triangulation, and market breakup procedures were employed, wherever applicable. The overall market size was then used in the top-down procedure to estimate the size of other individual markets via percentage splits of the market segmentation.
Report Objectives
- To analyze the impact of COVID-19 on the analytics market by solution, service, industry vertical, and region
- To provide detailed information about the COVID-19 related major factors (drivers, restraints, opportunities, and challenges) influencing the trends in the analytics market
- To study the impact of COVID-19 on key industries that are impacted severely due to this health and economic pandemic
- To examine the shift in revenue patterns of analytics vendors in 2020 and their capabilities to address the demand emerging from the industry verticals during the global lockdown due to the COVID-19 outbreak
- To analyze the change in short-term strategies of companies, such as goodwill offerings to instill relevance and confidence among their customers
- To track key developments, such as new product launches; and partnerships, agreements, and collaborations in the context of COVID-19 in the global analytics market
Available customizations
With the given market data, MarketsandMarkets offers customizations as per the company’s specific needs. The following customization options are available for the report:
Geographic analysis
- Further breakup of the North American COVID-19 impact on the analytics market
- Further breakup of the European COVID-19 impact on the market
- Further breakup of the APAC COVID-19 impact on the market
- Further breakup of the Latin American COVID-19 impact on the market
- Further breakup of the MEA COVID-19 impact on the market
Company information
- Detailed analysis and profiling of additional market players up to 5


Growth opportunities and latent adjacency in COVID-19 Impact on Analytics Market