[204 Pages Report] The global digital therapeutics market is projected to reach USD 13.1 billion by 2026, at a CAGR of 31.4% during the forecast period. Growth in this market is primarily driven by the rising focus on preventive healthcare, significant increase in venture capital investments and benefits of digital therapeutics.
However, patient data privacy concern, reluctance among patients to adopt digital therapeutics are some of the factors hampering the market growth at certain extent.
To know about the assumptions considered for the study, Request for Free Sample Report
The impact of the coronavirus pandemic and the subsequent establishment of nationwide lockdowns is visible in various industries. The overall growth of various sectors has been heavily impacted, especially in countries with a high incidence rate of COVID-19, such as India, China, Brazil, the US, and several European countries (including Russia, Italy, and Spain). While industries such as oil and petroleum, aeronautics, and mining are experiencing a steep fall in revenues, the healthcare, biotechnology, and pharmaceutical industries are optimizing this situation to serve a maximum number of patients and healthcare professionals.
As of June 28, 2021, there have been 179,686071 confirmed COVID-19 cases worldwide, with 3,899,172 deaths (WHO). As the pandemic continues to spread, healthcare professionals are being stretched to combat the outbreak, but an ever-increasing number of cases is causing severe complications. As a result, patients are increasingly turning to digital therapeutics for disease evaluation and treatment. The COVID-19 outbreak has also prompted healthcare providers to explore alternatives to standard procedures. The COVID-19 outbreak has prompted healthcare providers to seek out alternatives to standard systems and processes. As a result, both providers and consumers are adopting digital therapeutics increasingly.
Chronic diseases have increased the burden on healthcare systems across the globe. For example, as per a reportHeart Diseases and Stroke Statistics at a Glance (2016, published by the American Heart Association)cardiovascular disease (CVD) is the leading cause of death globally. CVD accounts for 17.3 million deaths per year, and this figure is expected to cross 23.6 million by 2030.
The high prevalence and incidence rate of chronic diseases is a major concern for healthcare systems across the globe. The treatment of patients with chronic diseases is a significant challenge, as psychosomatic or biopsychic factors very often influence these patients. As chronic diseases are often associated with high levels of uncertainty, patients need to change their behavior as part of a new self-care lifestyle. Furthermore, many chronic disorders and conditions are progressive, and their incidence increases with age. As a result, with significant growth in the global geriatric population, chronic disorders are expected to rise further in the coming years.
In many countries, various health apps are deprived of appropriate approvals, leading to concerns of product & data quality, reliability in treatment decisions, patient privacy, security, and the responsible use of data. Digital therapeutics providers have access to patient information and are forbidden from sharing the information with anyone not involved in treating that patient. However, with the integration of data using digital tools, the patients data is at risk of being accessed by any healthcare professional not related to the patients treatment program.
Some countries, such as the US (with its Health Insurance Portability and Accountability Act (HIPAA) and the Health Information Technology for Economic and Clinical Health (HITECH) Act), have legislation focusing on the issue of data security. However, despite such federal initiatives, digital therapeutics users are subject to infringement and data breaching, which may restrain the growth of the digital therapeutics market.
Emerging economies such as India, China, and the Middle East present growth opportunities for digital therapeutics. In most geographies, the market is still in its infancy due to a lack of awareness, the minimum availability of these solutions, lack of IT infrastructure, and financial and social constraints. On the other hand, most emerging economies show high rates of chronic disease incidence. According to WHO estimates, by 2020, chronic diseases will be responsible for 70% of the total deaths in developing countries. On the global level, by 2025, ~60% of the burden of chronic conditions will be in developing countries.
In addition, the lack of skilled medical practitioners in developing regions highlights the importance of connected healthcare. Furthermore, developing countries like India and China lack proper standards and government regulations for digital health solutions, which offer huge potential to providers who cannot meet stringent standards set by the federal government in the US. The patient-doctor ratio in these regions is also significantly high, necessitating alternative healthcare solutions.
These countries have also registered widespread adoption of smartphones and related technologies due to their growing affordability. Globally, China and India are the top two countries in terms of smartphone ownership. Furthermore, the increasing access to smart devices and the Internet has encouraged the development of health apps. In addition, government bodies in these regions are taking initiatives to improve HCIT infrastructure. For instance, in its five-year plan from 2015 to 2020, China aimed to improve healthcare quality by implementing HCIT solutions.
Motivating people to use digital therapeutics and building their confidence is a major challenge faced by digital therapeutics providers. While older and underserved populations show maximum susceptibility to diseases and the highest occurrence rates, they are the least likely to use digital therapeutics products due to low technology literacy levels. Furthermore, the limit of how much behavioral change will be observed with digital therapeutics is still undefined.
The clinical validation and deployment of digital therapeutics are carried out on self-selected or volunteer patients; however, their effect on patients showing resistance is still unknown. Furthermore, it is unknown whether digital therapeutics can be sustained over longer periods; there is little information on total patient retention and long-term outcomes. Many patients still rely on traditional means of diagnosis and treatment and thus show reluctance to adopt these novel therapies. This poses a major challenge to the digital therapeutics market.
Based on the sales channel, the digital therapeutics market is segmented into business-to-customer (B2C) and business-to-business (B2B). This is attributed to growing awareness among providers, payers, and employers about the benefits of digital therapeutics and the inclination of pharmaceutical companies to integrate digital therapeutics with their drug products
Based on the type of buyer, the B2C sales channel market is further segmented into patients and caregivers. The caregivers segment dominated the market and is expected to register the highest CAGR of 17.2% during the forecast period. The high growth of this segment is attributed to company initiatives for the development of products specifically for caregivers and the benefits of digital therapeutics in patient management applications.
The digital therapeutics market is segmented into North America, Europe, the Asia Pacific, and the RoW. In 2020, The market in North America is expected to grow at the highest CAGR. Factors such as the influx of new startups, increasing investments in digital therapeutics, improvements in the reimbursement structure for digital therapeutics, and government initiatives to support technological advancements drive market growth in this region. North America also held the largest share of the market, followed by Europe.
To know about the assumptions considered for the study, download the pdf brochure
Prominent players in the digital therapeutics market include Omada Health (US), WellDoc (US), Pear Therapeutics (US), Better Therapeutics (US), Happify (US), Proteus Digital Health (US), Propeller Health (US), Noom (US), Livongo Health (US), Akili Interactive Labs (US), Kaia Health (Germany), Mango Health (US), Click Therapeutics (US), Canary Health (US), CogniFit (US), Ayogo Health (Canada), Mindstrong Health (US), 2Morrow (US), Wellthy Therapeutics (India), Cognoa (US), and Ginger (US).
Report Metric |
Details |
Market Size Available for Years |
20192026 |
Base Year Considered |
2020 |
Forecast Period |
20222026 |
Forecast Units |
Value (USD Billion) |
Segments Covered |
Sales Channel, Application, and Region |
Geographies Covered |
North America (US and Canada), Europe (Germany, UK, France, Spain, Italy, and the RoE), Asia Pacific (Japan, China, India, and the RoAPAC), and the Rest of the World |
Companies Covered |
Noom (US), Livongo Health (US), Omada Health (US), WellDoc (US), Pear Therapeutics (US), Proteus Digital Health (US), Propeller Health (US), Akili Interactive Labs (US), Better Therapeutics (US), Happify (US), Kaia Health (Germany), Mango Health (US), Click Therapeutics (US), Canary Health (US), Wellthy Therapeutics (India), Cognoa (US), Ayogo Health (Canada), Mindstrong Health (US), 2Morrow (US), Ginger (US) BehaVR (US), Mindable Health (Germany), Virta Health (US), Hinge Health (US), and Doktor.se (Sweden) |
The research report categorizes the digital therapeutics market into the following segments and subsegments:
Which application segment will dominate the Digital therapeutics market in the future?
The treatment/care related applications will dominate the market in the future.
Emerging countries have immense opportunities for the growth and adoption Digital therapeutics market; will this scenario continue in the next five years?
Asia Pacific is expected to register the highest CAGR during the forecast period, emerging markets such as China and India are witnessing growth due to the increasing healthcare expenditure. This has resulted in the increasing acceptance of advanced systems in the Asia Pacific region.
In addition, the lack of skilled medical practitioners in developing regions highlights the importance of connected healthcare. Furthermore, developing countries like India and China lack proper standards and government regulations for digital health solutions, which offer huge potential to providers who cannot meet stringent standards set by the federal government in the US. The patient-doctor ratio in these regions is also significantly high, necessitating alternative healthcare solutions.
Who are the leading players in the Digital therapeutics market?
Prominent players in the market include Noom (US), Livongo Health (US), Omada Health (US), WellDoc (US), Pear Therapeutics (US), Proteus Digital Health (US), Propeller Health (US), Akili Interactive Labs (US), Better Therapeutics (US), Happify (US), Kaia Health (Germany), Mango Health (US), Click Therapeutics (US), Canary Health (US), Wellthy Therapeutics (India), Cognoa (US), CogniFit (US), Ayogo Health (Canada), Mindstrong Health (US), 2Morrow (US), and Ginger (US
What are the major Application in the Digital therapeutics market?
The digital therapeutics market is segmented into preventive and treatment/care-related applications. The largest share is the treatment/care related applications. .
To speak to our analyst for a discussion on the above findings, click Speak to Analyst
TABLE OF CONTENTS
1 INTRODUCTION (Page No. - 28)
1.1 OBJECTIVES OF THE STUDY
1.2 MARKET DEFINITION
1.2.1 INCLUSIONS & EXCLUSIONS
1.2.2 MARKETS COVERED
1.2.3 YEARS CONSIDERED FOR THE STUDY
1.3 CURRENCY
1.4 LIMITATIONS
1.5 STAKEHOLDERS
1.6 LIMITATIONS
1.7 SUMMARY OF CHANGES
2 RESEARCH METHODOLOGY (Page No. - 33)
2.1 RESEARCH DATA
FIGURE 1 RESEARCH DESIGN
2.1.1 SECONDARY DATA
2.1.1.1 Key data from secondary sources
2.1.2 PRIMARY DATA
FIGURE 2 PRIMARY SOURCES
2.1.2.1 Key data from primary sources
FIGURE 3 KEY INDUSTRY INSIGHTS
FIGURE 4 BREAKDOWN OF PRIMARY INTERVIEWS (SUPPLY SIDE): BY COMPANY TYPE, DESIGNATION, AND REGION
FIGURE 5 BREAKDOWN OF PRIMARY INTERVIEWS (DEMAND SIDE): BY TYPE OF BUYER AND REGION
2.2 MARKET SIZE ESTIMATION
2.2.1 BOTTOM-UP APPROACH
2.2.1.1 Approach one: revenue mapping-based estimation
FIGURE 6 ESTIMATION OF THE DIGITAL THERAPEUTICS MARKET: REVENUE MAPPING-BASED ESTIMATION
2.2.1.2 Approach two: Buyer adoption-based estimation
FIGURE 7 MARKET SIZE ESTIMATION: BUYER ADOPTION-BASED
2.2.2 TOP-DOWN APPROACH: PENETRATION RATE-BASED MARKET SIZE ESTIMATION
FIGURE 8 PENETRATION RATE-BASED MARKET ESTIMATION
2.2.3 GROWTH FORECAST
TABLE 1 FACTOR ANALYSIS
2.3 MARKET BREAKDOWN AND DATA TRIANGULATION
FIGURE 9 DATA TRIANGULATION METHODOLOGY
2.4 MARKET PLAYER RANKING
2.5 ASSUMPTIONS FOR THE STUDY
3 EXECUTIVE SUMMARY (Page No. - 45)
FIGURE 10 DIGITAL THERAPEUTICS MARKET, BY SALES CHANNEL, 2021 VS. 2026 (USD MILLION)
FIGURE 11 GLOBAL MARKET FOR B2C SALES CHANNEL, 2021 VS. 2026 (USD MILLION)
FIGURE 12 GLOBAL MARKET FOR B2B SALES CHANNEL: PAYERS HOLD THE LARGEST MARKET SHARE
FIGURE 13 GLOBAL MARKET, BY APPLICATION (20212026)
FIGURE 14 GLOBAL MARKET FOR TREATMENT/CARE-RELATED APPLICATIONS, 2021 VS. 2026 (USD MILLION)
FIGURE 15 GEOGRAPHICAL SNAPSHOT OF THE DIGITAL THERAPEUTICS MARKET
4 PREMIUM INSIGHTS (Page No. - 50)
4.1 DIGITAL THERAPEUTICS MARKET OVERVIEW
FIGURE 16 INCREASING INCIDENCE OF CHRONIC DISEASES & TECHNOLOGICAL ADVANCEMENTS ARE DRIVING THE ADOPTION OF DIGITAL THERAPEUTICS
4.2 GLOBAL MARKET, BY SALES CHANNEL, 20192026
FIGURE 17 B2B SALES DOMINATE THE GLOBAL MARKET
4.3 GLOBAL MARKET: GEOGRAPHIC GROWTH OPPORTUNITIES
FIGURE 18 NORTH AMERICA IS THE FASTEST-GROWING MARKET FOR DIGITAL THERAPEUTICS
5 MARKET OVERVIEW (Page No. - 53)
5.1 INTRODUCTION
5.2 MARKET DYNAMICS
FIGURE 19 DIGITAL THERAPEUTICS MARKET: DRIVERS, RESTRAINTS, OPPORTUNITIES, AND CHALLENGES
5.2.1 DRIVERS
5.2.1.1 Increasing incidence of preventable chronic diseases
5.2.1.2 Rising focus on preventive healthcare
5.2.1.3 Need to control healthcare costs
5.2.1.4 Significant increase in venture capital investments
5.2.1.5 Benefits of digital therapeutics
5.2.1.5.1 Ability to induce behavioral change
5.2.1.5.2 Improved drug adherence
5.2.1.5.3 Patient convenience and user-friendliness
5.2.2 RESTRAINTS
5.2.2.1 Patient data privacy concerns
5.2.3 OPPORTUNITIES
5.2.3.1 Emerging markets
5.2.3.2 Large undiagnosed and untreated population
5.2.3.3 Unexplored therapeutic applications
5.2.4 CHALLENGES
5.2.4.1 Unstable payment models
5.2.4.2 Reluctance among patients to adopt digital therapeutics
5.2.4.3 Lack of awareness and access to digital therapeutics programs in developing countries
5.2.4.4 Resistance from traditional healthcare providers
5.3 PORTERS FIVE FORCES ANALYSIS
5.3.1 THREAT OF NEW ENTRANTS
5.3.2 BARGAINING POWER OF SUPPLIERS
5.3.3 BARGAINING POWER OF BUYERS
5.3.4 THREAT OF SUBSTITUTES
5.3.5 INTENSITY OF COMPETITIVE RIVALRY
5.4 VALUE CHAIN ANALYSIS
FIGURE 20 VALUE CHAIN ANALYSIS
5.5 ECOSYSTEM ANALYSIS
FIGURE 21 ECOSYSTEM ANALYSIS
5.6 PIPELINE PRODUCTS
5.7 TECHNOLOGY TRENDS
5.8 CASE STUDIES
5.9 REGULATORY LANDSCAPE
TABLE 2 DIGITAL THERAPEUTICS MARKET: REGULATORY DATA NEEDED FOR CLASS II DEVICES
5.10 IMPACT OF COVID-19 ON THE GLOBAL MARKET
6 DIGITAL THERAPEUTICS MARKET, BY APPLICATION (Page No. - 68)
6.1 INTRODUCTION
TABLE 3 GLOBAL MARKET, BY APPLICATION, 20192026 (USD MILLION)
6.2 TREATMENT/CARE-RELATED APPLICATIONS
TABLE 4 GLOBAL MARKET FOR TREATMENT/CARE-RELATED APPLICATIONS, BY TYPE, 20192026 (USD MILLION)
TABLE 5 GLOBAL MARKET FOR TREATMENT/CARE-RELATED APPLICATIONS, BY REGION, 20192026 (USD MILLION)
6.2.1 DIABETES
6.2.1.1 Rising prevalence of diabetes to drive market growth
TABLE 6 DIGITAL THERAPEUTICS MARKET FOR DIABETES, BY REGION, 20192026 (USD MILLION)
6.2.2 CENTRAL NERVOUS SYSTEM DISORDERS
TABLE 7 GLOBAL MARKET FOR CNS DISORDERS, BY TYPE, 20192026 (USD MILLION)
TABLE 8 GLOBAL MARKET FOR CNS DISORDERS, BY REGION, 20192026 (USD MILLION)
6.2.2.1 Mental health disorders
6.2.2.1.1 Potential benefits of digital therapeutics in mental health disorder management have driven the development of these solutions
TABLE 9 GLOBAL MARKET FOR MENTAL HEALTH DISORDERS, BY REGION, 20192026 (USD MILLION)
6.2.2.2 Other CNS disorders
TABLE 10 DIGITAL THERAPEUTICS MARKET FOR OTHER CNS DISORDERS, BY REGION, 20192026 (USD MILLION)
6.2.3 SMOKING CESSATION
6.2.3.1 Focus on providing clinically validated, effective mobile applications to help quit smoking to aid market growth
TABLE 11 GLOBAL MARKET FOR SMOKING CESSATION, BY REGION, 20192026 (USD MILLION)
6.2.4 CHRONIC RESPIRATORY DISEASES
6.2.4.1 Growing prevalence of COPD and asthma to drive market growth
TABLE 12 GLOBAL MARKET FOR CHRONIC RESPIRATORY DISEASES, BY REGION, 20192026 (USD MILLION)
6.2.5 MUSCULOSKELETAL DISORDERS
6.2.5.1 Dearth of physiotherapists to support market growth
TABLE 13 GLOBAL MARKET FOR MUSCULOSKELETAL DISORDERS, BY REGION, 20192026 (USD MILLION)
6.2.6 CARDIOVASCULAR DISEASE
6.2.6.1 High burden of CVD across the globe is the major factor driving the demand for digital therapeutics solutions
TABLE 14 DIGITAL THERAPEUTICS MARKET FOR CARDIOVASCULAR DISEASE, BY REGION, 20192026 (USD MILLION)
6.2.7 MEDICATION ADHERENCE
6.2.7.1 Growing number of medication non-adherence cases to propel market growth
TABLE 15 GLOBAL MARKET FOR MEDICATION ADHERENCE, BY REGION, 20192026 (USD MILLION)
6.2.8 GASTROINTESTINAL DISORDERS
6.2.8.1 High prevalence of gastrointestinal disorders has attracted many startups in the space of digital health
TABLE 16 GLOBAL MARKET FOR GASTROINTESTINAL DISORDERS, BY REGION, 20192026 (USD MILLION)
6.2.9 REHABILITATION & PATIENT CARE
6.2.9.1 Benefits of digital therapeutics have induced startups to develop platforms for patient care
TABLE 17 GLOBAL MARKET FOR REHABILITATION & PATIENT CARE, BY REGION, 20192026 (USD MILLION)
6.2.10 SUBSTANCE USE DISORDERS & ADDICTION MANAGEMENT
6.2.10.1 Potential to improve the efficiency of behavioral interventions to drive market growth
TABLE 18 DIGITAL THERAPEUTICS MARKET FOR SUBSTANCE USE DISORDERS & ADDICTION MANAGEMENT, BY REGION, 20192026 (USD MILLION)
6.2.11 OTHER TREATMENT/CARE-RELATED APPLICATIONS
TABLE 19 GLOBAL MARKET FOR OTHER TREATMENT/CARE-RELATED APPLICATIONS, BY REGION, 20192026 (USD MILLION)
6.3 PREVENTIVE APPLICATIONS
TABLE 20 GLOBAL MARKET FOR PREVENTIVE APPLICATIONS, BY TYPE, 20192026 (USD MILLION)
TABLE 21 GLOBAL MARKET FOR PREVENTIVE APPLICATIONS, BY REGION, 20192026 (USD MILLION)
6.3.1 PREDIABETES
6.3.1.1 Influx of startups to provide effective prevention against prediabetes will support market growth
TABLE 22 GLOBAL MARKET FOR PREDIABETES, BY REGION, 20192026 (USD MILLION)
6.3.2 OBESITY
6.3.2.1 Availability of cost-effective solutions for obesity management to propel market growth
TABLE 23 DIGITAL THERAPEUTICS MARKET FOR OBESITY, BY REGION, 20192026 (USD MILLION)
6.3.3 NUTRITION
6.3.3.1 Importance of nutrition in preventing a wide range of ailments has driven the demand for digital therapeutic solutions
TABLE 24 GLOBAL MARKET FOR NUTRITION, BY REGION, 20192026 (USD MILLION)
6.3.4 LIFESTYLE MANAGEMENT
6.3.4.1 Ability of digital therapeutics solutions to induce positive behavioral changes has contributed to the rising demand
TABLE 25 GLOBAL MARKET FOR LIFESTYLE MANAGEMENT, BY REGION, 20192026 (USD MILLION)
6.3.5 OTHER PREVENTIVE APPLICATIONS
TABLE 26 GLOBAL MARKET FOR OTHER PREVENTIVE APPLICATIONS, BY REGION, 20192026 (USD MILLION)
7 DIGITAL THERAPEUTICS MARKET, BY SALES CHANNEL (Page No. - 87)
7.1 INTRODUCTION
TABLE 27 DIGITAL THERAPEUTICS MARKET, BY SALES CHANNEL, 20192026 (USD MILLION)
7.2 B2B
TABLE 28 GLOBAL MARKET FOR B2B SALES CHANNEL, BY BUYER, 20192026 (USD MILLION)
TABLE 29 GLOBAL MARKET FOR B2B SALES CHANNEL, BY REGION, 20192026 (USD MILLION)
7.2.1 PAYERS
7.2.1.1 Payers held the largest market share
TABLE 30 GLOBAL MARKET FOR PAYERS, BY REGION, 20192026 (USD MILLION)
7.2.2 EMPLOYERS
7.2.2.1 Importance of employee health management has increased the adoption of digital therapeutics among employers
TABLE 31 GLOBAL MARKET FOR EMPLOYERS, BY REGION, 20192026 (USD MILLION)
7.2.3 PHARMACEUTICAL COMPANIES
7.2.3.1 Growing cross-industry collaborations between digital therapeutics start-ups and pharmaceutical companies to drive market growth
TABLE 32 DIGITAL THERAPEUTICS MARKET FOR PHARMACEUTICAL COMPANIES, BY REGION, 20192026 (USD MILLION)
7.2.4 PROVIDERS
7.2.4.1 Potential for better patient management and cost-reductions are driving the demand for digital therapeutics among providers
TABLE 33 GLOBAL MARKET FOR PROVIDERS, BY REGION, 20192026 (USD MILLION)
7.2.5 OTHER BUYERS
TABLE 34 GLOBAL MARKET FOR OTHER BUYERS, BY REGION, 20192026 (USD MILLION)
7.3 B2C
TABLE 35 GLOBAL MARKET FOR B2C SALES CHANNEL, BY BUYER, 20192026 (USD MILLION)
TABLE 36 GLOBAL MARKET FOR B2C SALES CHANNEL, BY REGION, 20192026 (USD MILLION)
7.3.1 CAREGIVERS
7.3.1.1 Ease of managing health conditions has driven the demand for solutions among caregivers
TABLE 37 GLOBAL MARKET FOR CAREGIVERS, BY REGION, 20192026 (USD MILLION)
7.3.2 PATIENTS
7.3.2.1 Awareness about preventive health among patients to support the growth of this segment
TABLE 38 DIGITAL THERAPEUTICS MARKET FOR PATIENTS, BY REGION, 20192026 (USD MILLION)
8 DIGITAL THERAPEUTICS MARKET, BY REGION (Page No. - 97)
8.1 INTRODUCTION
TABLE 39 DIGITAL THERAPEUTICS MARKET, BY REGION, 20192026 (USD MILLION)
8.2 NORTH AMERICA
FIGURE 22 NORTH AMERICA: DIGITAL THERAPEUTICS MARKET SNAPSHOT
TABLE 40 NORTH AMERICA: MARKET, BY COUNTRY, 20192026 (USD MILLION)
TABLE 41 NORTH AMERICA: MARKET, BY APPLICATION, 20192026 (USD MILLION)
TABLE 42 NORTH AMERICA: MARKET FOR TREATMENT/CARE-RELATED APPLICATIONS, BY TYPE, 20192026 (USD MILLION)
TABLE 43 NORTH AMERICA: MARKET FOR PREVENTIVE APPLICATIONS, BY TYPE, 20192026 (USD MILLION)
TABLE 44 NORTH AMERICA: DIGITAL THERAPEUTICS MARKET FOR CNS DISORDERS, BY TYPE, 20192026 (USD MILLION)
TABLE 45 NORTH AMERICA: MARKET, BY SALES CHANNEL, 20192026 (USD MILLION)
TABLE 46 NORTH AMERICA: MARKET FOR B2C SALES CHANNEL, BY BUYER, 20192026 (USD MILLION)
TABLE 47 NORTH AMERICA: MARKET FOR B2B SALES CHANNEL, BY BUYER, 20192026 (USD MILLION)
8.2.1 US
8.2.1.1 Major digital therapeutics start-ups are based out of the US, which has greatly supported access to solutions
TABLE 48 US: DIGITAL THERAPEUTICS MARKET, BY APPLICATION, 20192026 (USD MILLION)
TABLE 49 US: MARKET FOR TREATMENT/CARE-RELATED APPLICATIONS, BY TYPE, 20192026 (USD MILLION)
TABLE 50 US: MARKET FOR PREVENTIVE APPLICATIONS, BY TYPE, 20192026 (USD MILLION)
TABLE 51 US: MARKET FOR CNS DISORDERS, BY TYPE, 20192026 (USD MILLION)
TABLE 52 US: DIGITAL THERAPEUTICS MARKET, BY SALES CHANNEL, 20192026 (USD MILLION)
TABLE 53 US: MARKET FOR B2C SALES CHANNEL, BY BUYER, 20192026 (USD MILLION)
TABLE 54 US: MARKET FOR B2B SALES CHANNEL, BY BUYER, 20192026 (USD MILLION)
8.2.2 CANADA
8.2.2.1 Government initiatives to support digital therapeutics to drive market growth in Canada
TABLE 55 CANADA: DIGITAL THERAPEUTICS MARKET, BY APPLICATION, 20192026 (USD MILLION)
TABLE 56 CANADA: MARKET FOR TREATMENT/CARE-RELATED APPLICATIONS, BY TYPE, 20192026 (USD MILLION)
TABLE 57 CANADA: MARKET FOR PREVENTIVE APPLICATIONS, BY TYPE, 20192026 (USD MILLION)
TABLE 58 CANADA: MARKET FOR CNS DISORDERS, BY TYPE, 20192026 (USD MILLION)
TABLE 59 CANADA: DIGITAL THERAPEUTICS MARKET, BY SALES CHANNEL, 20192026 (USD MILLION)
TABLE 60 CANADA: MARKET FOR B2C SALES CHANNEL, BY BUYER, 20192026 (USD MILLION)
TABLE 61 CANADA: MARKET FOR B2B SALES CHANNEL, BY BUYER, 20192026 (USD MILLION)
8.3 EUROPE
FIGURE 23 EUROPE: DIGITAL THERAPEUTICS MARKET SNAPSHOT
TABLE 62 EUROPE: MARKET, BY COUNTRY, 20192026 (USD MILLION)
TABLE 63 EUROPE: MARKET, BY APPLICATION, 20192026 (USD MILLION)
TABLE 64 EUROPE: MARKET FOR TREATMENT/CARE-RELATED APPLICATIONS, BY TYPE, 20192026 (USD MILLION)
TABLE 65 EUROPE: MARKET FOR PREVENTIVE APPLICATIONS, BY TYPE, 20192026 (USD MILLION)
TABLE 66 EUROPE: MARKET FOR CNS DISORDERS, BY TYPE, 20192026 (USD MILLION)
TABLE 67 EUROPE: MARKET, BY SALES CHANNEL, 20192026 (USD MILLION)
TABLE 68 EUROPE: MARKET FOR B2C SALES CHANNEL, BY BUYER, 20192026 (USD MILLION)
TABLE 69 EUROPE: DIGITAL THERAPEUTICS MARKET FOR B2B SALES CHANNEL, BY BUYER, 20192026 (USD MILLION)
8.3.1 GERMANY
8.3.1.1 Germany is the largest market for digital therapeutics market in Europe due to increasing government initiatives
TABLE 70 GERMANY: DIGITAL THERAPEUTICS MARKET, BY APPLICATION, 20192026 (USD MILLION)
TABLE 71 GERMANY: MARKET FOR TREATMENT/CARE-RELATED APPLICATIONS, BY TYPE, 20192026 (USD MILLION)
TABLE 72 GERMANY: MARKET FOR PREVENTIVE APPLICATIONS, BY TYPE, 20192026 (USD MILLION)
TABLE 73 GERMANY: MARKET FOR CNS DISORDERS, BY TYPE, 20192026 (USD MILLION)
TABLE 74 GERMANY: DIGITAL THERAPEUTICS MARKET, BY SALES CHANNEL, 20192026 (USD MILLION)
TABLE 75 GERMANY: MARKET FOR B2C SALES CHANNEL, BY BUYER, 20192026 (USD MILLION)
TABLE 76 GERMANY: MARKET FOR B2B SALES CHANNEL, BY BUYER, 20192026 (USD MILLION)
8.3.2 UK
8.3.2.1 Well-established healthcare system and government support will propel the growth of the market
TABLE 77 UK: DIGITAL THERAPEUTICS MARKET, BY APPLICATION, 20192026 (USD MILLION)
TABLE 78 UK: MARKET FOR TREATMENT/CARE-RELATED APPLICATIONS, BY TYPE, 20192026 (USD MILLION)
TABLE 79 UK: MARKET FOR PREVENTIVE APPLICATIONS, BY TYPE, 20192026 (USD MILLION)
TABLE 80 UK: MARKET FOR CNS DISORDERS, BY TYPE, 20192026 (USD MILLION)
TABLE 81 UK: MARKET, BY SALES CHANNEL, 20192026 (USD MILLION)
TABLE 82 UK: MARKET FOR B2C SALES CHANNEL, BY BUYER, 20192026 (USD MILLION)
TABLE 83 UK: DIGITAL THERAPEUTICS MARKET FOR B2B SALES CHANNEL, BY BUYER, 20192026 (USD MILLION)
8.3.3 FRANCE
8.3.3.1 Growing healthcare expenditure and favorable health insurance system to support market growth in France
TABLE 84 FRANCE: DIGITAL THERAPEUTICS MARKET, BY APPLICATION, 20192026 (USD MILLION)
TABLE 85 FRANCE: MARKET FOR TREATMENT/CARE-RELATED APPLICATIONS, BY TYPE, 20192026 (USD MILLION)
TABLE 86 FRANCE: MARKET FOR PREVENTIVE APPLICATIONS, BY TYPE, 20192026 (USD MILLION)
TABLE 87 FRANCE: MARKET FOR CNS DISORDERS, BY TYPE, 20192026 (USD MILLION)
TABLE 88 FRANCE: MARKET, BY SALES CHANNEL, 20192026 (USD MILLION)
TABLE 89 FRANCE: MARKET FOR B2C SALES CHANNEL, BY BUYER, 20192026 (USD MILLION)
TABLE 90 FRANCE: DIGITAL THERAPEUTICS MARKET FOR B2B SALES CHANNEL, BY BUYER, 20192026 (USD MILLION)
8.3.4 SPAIN
8.3.4.1 Initiatives by emerging digital therapeutics startups are supporting market growth
TABLE 91 SPAIN: DIGITAL THERAPEUTICS MARKET, BY APPLICATION, 20192026 (USD MILLION)
TABLE 92 SPAIN: MARKET FOR TREATMENT/CARE-RELATED APPLICATIONS, BY TYPE, 20192026 (USD MILLION)
TABLE 93 SPAIN: MARKET FOR PREVENTIVE APPLICATIONS, BY TYPE, 20192026 (USD MILLION)
TABLE 94 SPAIN: MARKET FOR CNS DISORDERS, BY TYPE, 20192026 (USD MILLION)
TABLE 95 SPAIN: MARKET, BY SALES CHANNEL, 20192026 (USD MILLION)
TABLE 96 SPAIN: MARKET FOR B2C SALES CHANNEL, BY BUYER, 20192026 (USD MILLION)
TABLE 97 SPAIN: DIGITAL THERAPEUTICS MARKET FOR B2B SALES CHANNEL, BY BUYER, 20192026 (USD MILLION)
8.3.5 ITALY
8.3.5.1 Need for alternative and effective treatment to drive the market growth in the coming years
TABLE 98 ITALY: DIGITAL THERAPEUTICS MARKET, BY APPLICATION, 20192026 (USD MILLION)
TABLE 99 ITALY: MARKET FOR TREATMENT/CARE-RELATED APPLICATIONS, BY TYPE, 20192026 (USD MILLION)
TABLE 100 ITALY: MARKET FOR PREVENTIVE APPLICATIONS, BY TYPE, 20192026 (USD MILLION)
TABLE 101 ITALY: MARKET FOR CNS DISORDERS, BY TYPE, 20192026 (USD MILLION)
TABLE 102 ITALY: MARKET, BY SALES CHANNEL,20192026 (USD MILLION)
TABLE 103 ITALY: MARKET FOR B2C SALES CHANNEL, BY BUYER, 20192026 (USD MILLION)
TABLE 104 ITALY: DIGITAL THERAPEUTICS MARKET FOR B2B SALES CHANNEL, BY BUYER, 20192026 (USD MILLION)
8.3.6 REST OF EUROPE
TABLE 105 ROE: DIGITAL THERAPEUTICS MARKET, BY APPLICATION, 20192026 (USD MILLION)
TABLE 106 ROE: MARKET FOR TREATMENT/CARE-RELATED APPLICATIONS, BY TYPE, 20192026 (USD MILLION)
TABLE 107 ROE: MARKET FOR PREVENTIVE APPLICATIONS, BY TYPE, 20192026 (USD MILLION)
TABLE 108 ROE: MARKET FOR CNS DISORDERS, BY TYPE, 20192026 (USD MILLION)
TABLE 109 ROE: MARKET, BY SALES CHANNEL, 20192026 (USD MILLION)
TABLE 110 ROE: MARKET FOR B2C SALES CHANNEL, BY BUYER, 20192026 (USD MILLION)
TABLE 111 ROE: DIGITAL THERAPEUTICS MARKET FOR B2B SALES CHANNEL, BY BUYER, 20192026 (USD MILLION)
8.4 ASIA PACIFIC
TABLE 112 APAC: DIGITAL THERAPEUTICS MARKET, BY COUNTRY, 20192026 (USD MILLION)
TABLE 113 APAC: MARKET, BY APPLICATION, 20192026 (USD MILLION)
TABLE 114 APAC: MARKET FOR TREATMENT/CARE-RELATED APPLICATIONS, BY TYPE, 20192026 (USD MILLION)
TABLE 115 APAC: MARKET FOR PREVENTIVE APPLICATIONS, BY TYPE, 20192026 (USD MILLION)
TABLE 116 APAC: MARKET FOR CNS DISORDERS, BY TYPE, 20192026 (USD MILLION)
TABLE 117 APAC: MARKET, BY SALES CHANNEL, 20192026 (USD MILLION)
TABLE 118 APAC: DIGITAL THERAPEUTICS MARKET FOR B2C SALES CHANNEL, BY BUYER, 20192026 (USD MILLION)
TABLE 119 APAC: MARKET FOR B2B SALES CHANNEL, BY BUYER, 20192026 (USD MILLION)
8.4.1 JAPAN
8.4.1.1 Rising diabetes incidence and collaborations between stakeholders are indicators of market growth in Japan
TABLE 120 JAPAN: DIGITAL THERAPEUTICS MARKET, BY APPLICATION, 20192026 (USD MILLION)
TABLE 121 JAPAN: MARKET FOR TREATMENT/CARE-RELATED APPLICATIONS, BY TYPE, 20192026 (USD MILLION)
TABLE 122 JAPAN: MARKET FOR PREVENTIVE APPLICATIONS, BY TYPE, 20192026 (USD MILLION)
TABLE 123 JAPAN: MARKET FOR CNS DISORDERS, BY TYPE, 20192026 (USD MILLION)
TABLE 124 JAPAN: MARKET, BY SALES CHANNEL, 20192026 (USD MILLION)
TABLE 125 JAPAN: MARKET FOR B2C SALES CHANNEL, BY BUYER, 20192026 (USD MILLION)
TABLE 126 JAPAN: DIGITAL THERAPEUTICS MARKET FOR B2B SALES CHANNEL, BY BUYER, 20192026 (USD MILLION)
8.4.2 CHINA
8.4.2.1 The growing geriatric population and incidence of chronic conditions will drive demand for digital therapeutics in China
TABLE 127 CHINA: DIGITAL THERAPEUTICS MARKET, BY APPLICATION, 20192026 (USD MILLION)
TABLE 128 CHINA: MARKET FOR TREATMENT/CARE-RELATED APPLICATIONS, BY TYPE, 20192026 (USD MILLION)
TABLE 129 CHINA: MARKET FOR PREVENTIVE APPLICATIONS, BY TYPE, 20192026 (USD MILLION)
TABLE 130 CHINA: MARKET FOR CNS DISORDERS, BY TYPE, 20192026 (USD MILLION)
TABLE 131 CHINA: MARKET, BY SALES CHANNEL, 20192026 (USD MILLION)
TABLE 132 CHINA: MARKET FOR B2C SALES CHANNEL, BY BUYER, 20192026 (USD MILLION)
TABLE 133 CHINA: DIGITAL THERAPEUTICS MARKET FOR B2B SALES CHANNEL, BY BUYER, 20192026 (USD MILLION)
8.4.3 INDIA
8.4.3.1 Rising chronic disease incidence and the need for better disease management drive market growth
TABLE 134 INDIA: DIGITAL THERAPEUTICS MARKET, BY APPLICATION, 20192026 (USD MILLION)
TABLE 135 INDIA: MARKET FOR TREATMENT/CARE-RELATED APPLICATIONS, BY TYPE, 20192026 (USD MILLION)
TABLE 136 INDIA: MARKET FOR PREVENTIVE APPLICATIONS, BY TYPE, 20192026 (USD MILLION)
TABLE 137 INDIA: MARKET FOR CNS DISORDERS, BY TYPE, 20192026 (USD MILLION)
TABLE 138 INDIA: DIGITAL THERAPEUTICS MARKET, BY SALES CHANNEL, 20192026 (USD MILLION)
TABLE 139 INDIA: MARKET FOR B2C SALES CHANNEL, BY BUYER, 20192026 (USD MILLION)
TABLE 140 INDIA: MARKET FOR B2B SALES CHANNEL, BY BUYER, 20192026 (USD MILLION)
8.4.4 REST OF APAC
TABLE 141 ROAPAC: DIGITAL THERAPEUTICS MARKET, BY APPLICATION, 20192026 (USD MILLION)
TABLE 142 ROAPAC: MARKET FOR TREATMENT/CARE-RELATED APPLICATIONS, BY TYPE, 20192026 (USD MILLION)
TABLE 143 ROAPAC: MARKET FOR PREVENTIVE APPLICATIONS, BY TYPE, 20192026 (USD MILLION)
TABLE 144 ROAPAC: MARKET FOR CNS DISORDERS, BY TYPE, 20192026 (USD MILLION)
TABLE 145 ROAPAC: MARKET, BY SALES CHANNEL, 20192026 (USD MILLION)
TABLE 146 ROAPAC: MARKET FOR B2C SALES CHANNEL, BY BUYER, 20192026 (USD MILLION)
TABLE 147 ROAPAC: DIGITAL THERAPEUTICS MARKET FOR B2B SALES CHANNEL, BY BUYER, 20192026 (USD MILLION)
8.5 REST OF THE WORLD
TABLE 148 ROW: DIGITAL THERAPEUTICS MARKET, BY APPLICATION, 20192026 (USD MILLION)
TABLE 149 ROW: MARKET FOR TREATMENT/CARE-RELATED APPLICATIONS, BY TYPE, 20192026 (USD MILLION)
TABLE 150 ROW: MARKET FOR PREVENTIVE APPLICATIONS, BY TYPE, 20192026 (USD MILLION)
TABLE 151 ROW: MARKET FOR CNS DISORDERS, BY TYPE, 20192026 (USD MILLION)
TABLE 152 ROW: MARKET, BY SALES CHANNEL, 20192026 (USD MILLION)
TABLE 153 ROW: MARKET FOR B2C SALES CHANNEL, BY BUYER, 20192026 (USD MILLION)
TABLE 154 ROW: DIGITAL THERAPEUTICS MARKET FOR B2B SALES CHANNEL, BY BUYER, 20192026 (USD MILLION)
9 COMPETITIVE LANDSCAPE (Page No. - 153)
9.1 OVERVIEW
FIGURE 24 KEY PLAYERS ADOPTED ORGANIC AS WELL AS INORGANIC GROWTH STRATEGIES BETWEEN 2016 AND 2021
9.2 MARKET RANKING ANALYSIS, 2021
FIGURE 25 DIGITAL THERAPEUTICS MARKET RANKING ANALYSIS, 2021
9.3 COMPANY EVALUATION MATRIX
9.3.1 INTRODUCTION
9.3.2 COMPANY EVALUATION MATRIX: DEFINITIONS AND METHODOLOGY
9.3.2.1 Stars
9.3.2.2 Emerging leaders
9.3.2.3 Pervasive players
9.3.2.4 Emerging companies
FIGURE 26 DIGITAL THERAPEUTICS MARKET: GLOBAL COMPETITIVE LEADERSHIP MAPPING, 2021
9.3.3 COMPETITIVE LEADERSHIP MAPPING: START-UPS/SMES (2021)
9.3.3.1 Progressive companies
9.3.3.2 Starting blocks
9.3.3.3 Responsive companies
9.3.3.4 Dynamic companies
FIGURE 27 DIGITAL THERAPEUTICS MARKET: COMPETITIVE LEADERSHIP MAPPING FOR START-UPS/SMES, 2021
9.4 COMPETITIVE SCENARIO
9.4.1 DEALS
TABLE 155 DIGITAL THERAPEUTICS MARKET: DEALS, JANUARY 2016 TO JUNE 2021
9.4.2 PRODUCT LAUNCHES
TABLE 156 GLOBAL MARKET: PRODUCT LAUNCHES, JANUARY 2016 TO JUNE 2021
9.4.3 EXPANSIONS
TABLE 157 DIGITAL THERAPEUTICS MARKET: EXPANSIONS, JANUARY 2016 TO JUNE 2021
10 COMPANY PROFILES (Page No. - 163)
(Business Overview, Products Offered, Recent Developments, MnM View)*
10.1 NOOM, INC.
10.2 LIVONGO HEALTH
10.3 OMADA HEALTH
10.4 COGNIFIT
10.5 WELLDOC
10.6 GINGER
10.7 PROPELLER HEALTH
10.8 2MORROW, INC.
10.9 CANARY HEALTH
10.10 MANGO HEALTH, INC.
10.11 CLICK THERAPEUTICS
10.12 PEAR THERAPEUTICS
10.13 AKILI INTERACTIVE LABS, INC.
10.14 WELLTHY THERAPEUTICS
10.15 COGNOA, INC.
10.16 HAPPIFY
10.17 KAIA HEALTH
10.18 AYOGO HEALTH
10.19 BETTER THERAPEUTICS
10.20 MINDSTRONG HEALTH
10.21 BEHAVR INC.
10.22 MINDABLE HEALTH
10.23 VIRTA HEALTH
10.24 HINGE HEALTH
10.25 DOKTOR.SE
*Business Overview, Products Offered, Recent Developments, MnM View might not be captured in case of unlisted companies.
11 APPENDIX (Page No. - 197)
11.1 DISCUSSION GUIDE
11.2 KNOWLEDGE STORE: MARKETSANDMARKETS SUBSCRIPTION PORTAL
11.3 AVAILABLE CUSTOMIZATIONS
11.4 RELATED REPORTS
11.5 AUTHOR DETAILS
The study involved four major activities in estimating the current size of the global digital therapeutics market. Exhaustive secondary research was conducted to collect information on the market, its peer markets, and its parent market. The next step was to validate these findings, assumptions, and sizing values with industry experts across the value chain through primary research. Both top-down and bottom-up approaches were employed to estimate the total market size. After that, market breakdown and data triangulation procedures were used to estimate the market size of segments and subsegments.
Secondary research was mainly used to identify and collect information for the extensive, technical, market-oriented, and commercial study of the digital therapeutics market. Secondary sources include directories; databases such as Bloomberg Businessweek, Factiva, and Wall Street Journal; white papers; and annual reports that were used to obtain key information about major players, market classification, and segmentation according to industry trends, regional/country-level markets, market developments, and technology perspectives.
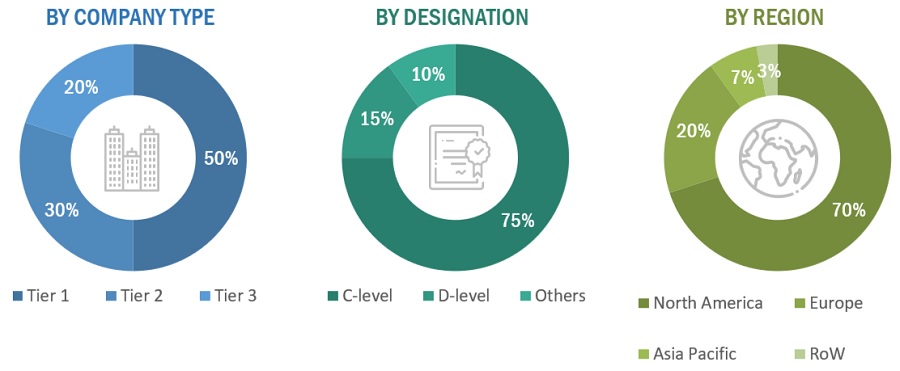
In-depth interviews were conducted with various primary respondents, including key industry participants, subject-matter experts (SMEs), C-level executives of key market players, and industry consultants, among other experts, to obtain and verify the critical qualitative and quantitative information as well as assess the prospects of the market. Various primary sources from both the supply and demand sides of the market were interviewed to obtain qualitative and quantitative information. The following is a breakdown of primary respondents:
To know about the assumptions considered for the study, download the pdf brochure
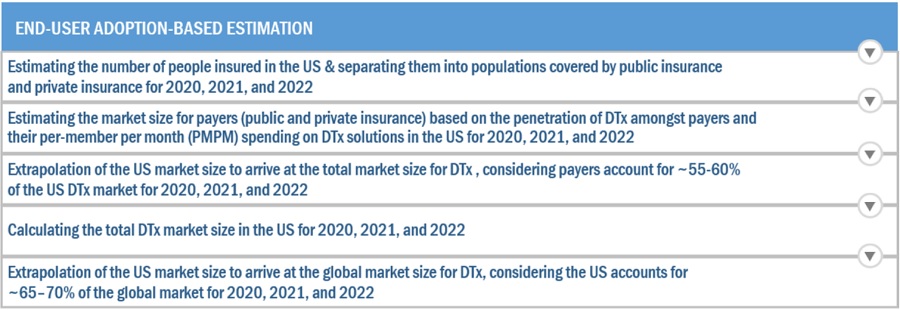
Both top-down and bottom-up approaches were used to estimate and validate the total size of the digital therapeutics market. These methods were also used extensively to determine the size of various subsegments in the market. The research methodology used to estimate the market size includes the following:
After arriving at the overall market size from the market size estimation process, the total market was split into several segments and subsegments. To complete the overall market engineering process and arrive at the exact statistics for all segments and subsegments, data triangulation and market breakdown procedures were employed, wherever applicable. The data was triangulated by studying various factors and trends from both the demand and supply sides.
With the given market data, MarketsandMarkets offers customizations as per the companys specific needs. The following customization options are available for this report.
Growth opportunities and latent adjacency in Digital Therapeutics (DTx) Market
What are the growth estimates for Digital Therapeutics Market till 2026?
Which are the key factors driving the growth of the Global Digital Therapeutics Market?
Which is the fastest growing market of Digital Therapeutics Market?