
Doors Market

Doors Market by Material, Product Type, Mode of Application, Mechanism (Sliding Doors, Swinging Doors, Folding Doors, and Overhead Doors), Application (Residential and Non-residential), and Region - Global Forecast to 2030


OVERVIEW
Source: Secondary Research, Interviews with Experts, MarketsandMarkets Analysis
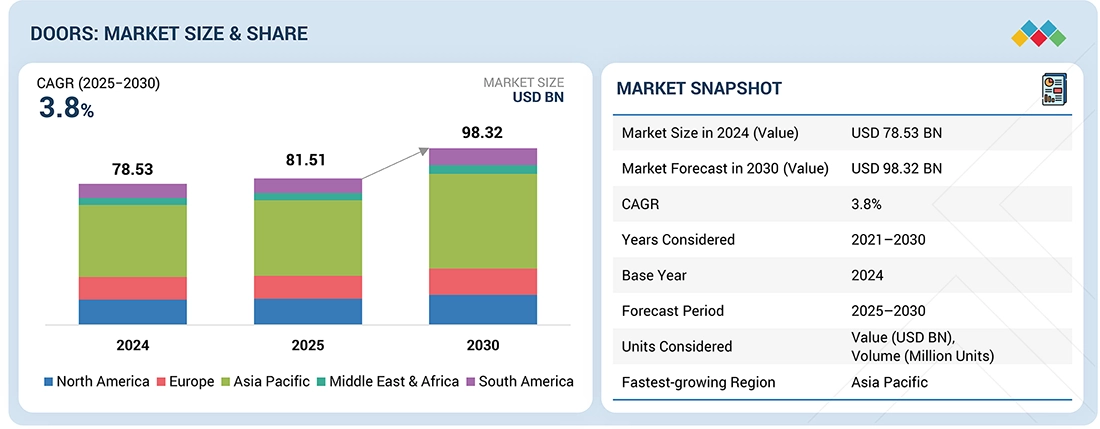
The doors market is expected to reach USD 98.32 billion by 2030 from USD 81.51 billion in 2025, at a CAGR of 3.8% during the forecast period. With the increasing urbanization, population growth, and growth in building activities, the global doors market is experiencing a steady growth rate. The United Nations forecasts that the global population will increase from 8.2 billion in 2024 to 9.7 billion by 2050, with the Asia Pacific region expected to reach 4.84 billion, of whom 64% would reside in metropolitan areas. This urbanization stimulates the need for residential, commercial, and public infrastructure, necessitating high-performance doors that offer access, thermal insulation, fire safety, soundproofing, and automation. Increased construction codes, environment, and government initiatives for affordable housing and smart infrastructure will also factor into demand. Various standards and certifications around safety and quality such as ANSI, CE Marking, NFPA and UL are critical components that will help to further boost market growth while increasing consumer confidence in obtaining product performance.
KEY TAKEAWAYS
-
BY MATERIALThe market is segmented into wood, metal, glass, plastics, and composites. Each material offers unique benefits—wood for aesthetics and durability, metal for strength and fire resistance, glass for design appeal, and composites for low maintenance—driving adoption across residential, commercial, and industrial applications.
-
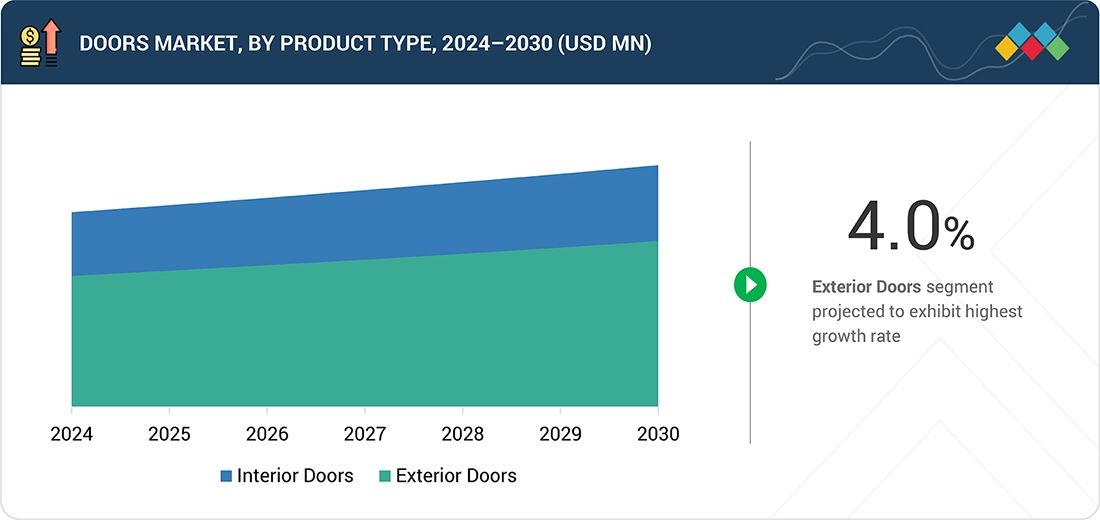
BY PRODUCT TYPEInterior doors are gaining traction with rising demand for privacy, sound insulation, and space optimization, while exterior doors dominate with strong replacement demand driven by security, thermal insulation, and architectural enhancement requirements.
-
BY MECHANISMSwinging doors remain the leading mechanism due to their cost efficiency and wide usability. However, sliding and automatic door systems are witnessing increasing adoption in modern infrastructure projects, particularly in urban and commercial environments.
-
BY MODE OF APPLICATIONNew construction continues to lead demand, supported by rapid residential and infrastructure development worldwide. Meanwhile, the aftermarket is expanding steadily, with upgrades and retrofits focused on energy efficiency, safety compliance, and aesthetic improvements.
-
BY APPLICATIONThe residential segment dominates the market, driven by robust housing demand and renovation trends. Non-residential applications—including offices, retail outlets, healthcare facilities, and infrastructure projects—are also contributing significantly to market expansion.
-
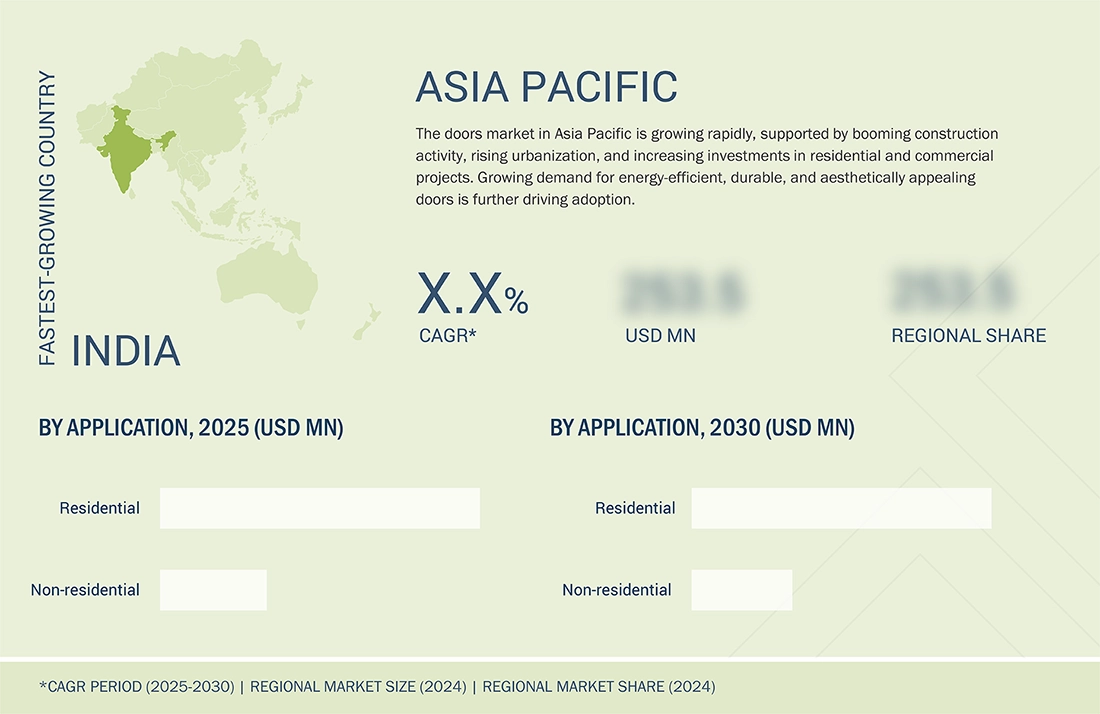
BY REGIONThe Asia Pacific region is expected to record the fastest growth, backed by urbanization, disposable income growth, and government-supported construction initiatives. North America and Europe continue to emphasize energy-efficient and sustainable door solutions, while the Middle East is seeing demand from large-scale infrastructure investments.
-
COMPETITIVE LANDSCAPEKey players such as ASSA ABLOY, LIXIL Corporation, JELD-WEN Inc., and Cornerstone Building Brands are strengthening their positions through innovation, collaborations, acquisitions, and regional expansions. Investments in smart and compliant door systems are central to maintaining competitive advantage.
The market for doors is likely to grow robustly in the next few years, spurred by growth in residential and commercial construction, renovation work, and demand for energy-efficient, intelligent door systems. High-performance doors, valued for their durability, security, and style, are found in residential, commercial, retail, and industrial settings. Their reliability and versatility make them vital to today’s architectural designs that increase safety, energy efficiency, access, and code. Consequently, doors are critical in maintaining long-term building performance, occupant comfort, and property value for both new buildings and refurbishment schemes.
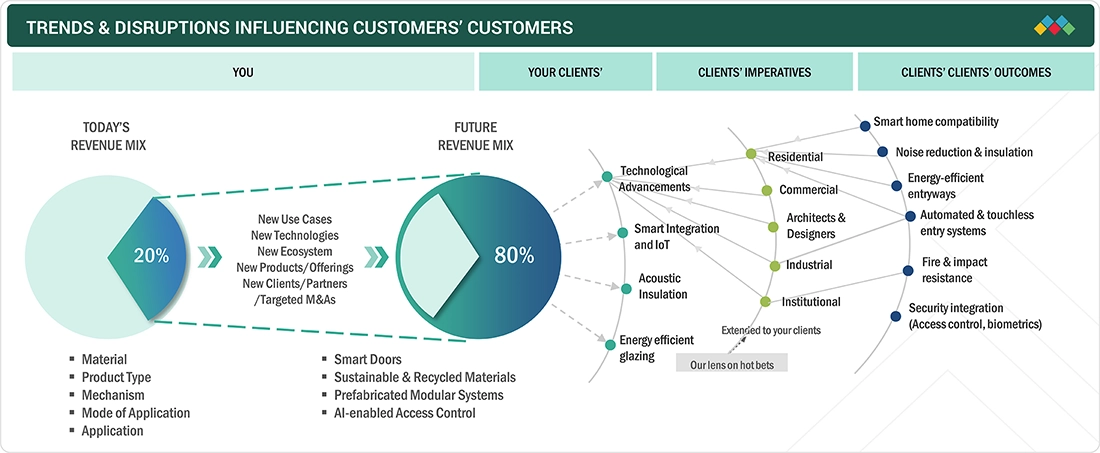
TRENDS & DISRUPTIONS IMPACTING CUSTOMERS' CUSTOMERS
Customer demand in the doors industry is intricately linked to development, remodeling, and infrastructure endeavors. Primary clientele comprises homeowners, housing developers, commercial property proprietors, and operators of public facilities, with applications extending across the residential, commercial, and industrial sectors. Sales are directly affected by new construction projects, renovation efforts, and changing building standards. Moreover, trends like smart-home integration, energy efficiency, and sustainable materials influence consumer preferences. Consequently, the income, product programs, and innovation activities of door manufacturers are largely dependent on the market, government policies, and technological changes.
Source: Secondary Research, Interviews with Experts, MarketsandMarkets Analysis
MARKET DYNAMICS
Level
-
Surging construction activity and energy-efficient upgrades

-
Increasing urban population

Level
-
Environmental concerns and regulatory pressure on PVC and other materials

-
High installation and lifecycle costs of eco-friendly doors

Level
-
Renovation surge and infrastructure investment fuel demand for advanced door solutions

-
Leveraging smart technologies and sustainable innovations

Level
-
Meeting environmental expectations and regulatory requirements

-
Vulnerability to global supply chain disruptions

Source: Secondary Research, Interviews with Experts, MarketsandMarkets Analysis
Driver: Surging construction activity and energy-efficient upgrades fuel market growth
The doors market is seeing significant expansion, due to global development, favorable laws, and increasing demand for energy-efficient and intelligent doors. Oxford Economics forecasts that the global construction industry will reach USD 8 trillion by 2030, stimulating demand for residential and commercial doors. In the US, 1.53 million housing completions and 1.26 million housing starts in May 2025 signify continuous expansion, although aging infrastructure, with over 50% of dwellings constructed prior to 1980, enhances replacement demand. Incentives such as the Energy Efficient Home Improvement Credit and the Inflation Reduction Act, in conjunction with the more stringent 2021 IECC energy requirements, promote ENERGY STAR-rated, thermally efficient doors. Globally, efforts like India's "Make in India" and IoT-enabled smart doors significantly enhance market expansion.
Restraint: Environmental concerns and regulatory pressure on PVC and other materials
Materials for doors, including PVC (polyvinyl chloride), are facing increased attention due to ecological issues. PVC is frequently used for cost-effective uPVC doors and frames due to its durability and insulating properties; however, typical PVC may release volatile compounds during manufacturing and disposal. Mismanagement in discarding general PVC can result in landfill buildup and toxic fume release. Regulatory actions are tightening across the world, India's Bureau of Indian Standards (BIS) issued a Quality Control Order dated 24 June 2025, mandating adherence to IS 17658:2021. Manufacturers have to implement safer materials, reformulate, and spend more on testing and documentation, which adds to production expenses and timelines while meeting regulatory and sustainability requirements in the doors market.
Opportunity: Renovation surge and infrastructure investment fuel demand for advanced door solutions
The global doors market is seeing growth due to residential renovations and expenditures in both public and private infrastructure. In 2024, 54% of US homeowners made renovations, with median expenditure increasing from USD 18,000 in 2021 to USD 20,000 in 2024, specifically on bathrooms, kitchens, and front doors. Residential homeowners increasingly demand fashionable, long-lasting, and energy-efficient doors, such as soundproofed and insulated sliding and bifold types. Owners of non-residential properties are also upgrading to safety, hygiene, and accessibility code requirements. Increased infrastructure investments also contribute to rising demand for sustainable, customizable, and innovative door solutions.
Challenge: Meeting environmental expectations and regulatory requirements
The increasing demand for environmentally sustainable doors presents a significant challenge for the global market. Consumers are progressively favoring energy-efficient products that comply with ENERGY STAR standards in the US and Canada, which establish rigorous performance criteria, including U-factor and energy rating specifications. Manufacturers must improve thermal insulation, minimize air leakage, and adhere to standards such as CSA A440.2, NFRC, and AAMA/WDMA/CSA. These constraints elevate R&D, supply chain, and compliance expenses, compelling firms to innovate while maintaining affordability and prompt market entry.
Doors Market: COMMERCIAL USE CASES ACROSS INDUSTRIES
| COMPANY | USE CASE DESCRIPTION | BENEFITS |
|---|---|---|
 |
A rural stone property in Yorkshire faced frequent door jamming and sill damage due to seasonal weather changes. It required a durable, low-maintenance front door that matched traditional architecture. | The Tavole front door in Honey Oak with engineered oak frame, PU foam insulation, and double-rebated edges provided weather resistance, eliminated maintenance issues, and enhanced the home’s exterior with a blend of contemporary design and rustic charm. |
 |
A FedEx distribution facility in Michigan faced frequent collisions and high maintenance costs with old roll-up steel doors, causing downtime and operational disruptions. | MaxSpeed high-performance rubber doors with breakaway system and fast opening speeds reduced downtime, enhanced safety, and delivered annual maintenance savings of USD 50,000, providing long-term operational efficiency with minimal intervention. |
 |
A Covent Garden parking facility in London experienced slow, unreliable roller shutter doors, causing security issues and service disruptions in a high-traffic environment. | PS Series fast-action doors improved operational flow, enhanced security, reduced unauthorized access, minimized litter and vermin ingress, and increased customer satisfaction with high-speed, reliable performance. |
Logos and trademarks shown above are the property of their respective owners. Their use here is for informational and illustrative purposes only.
MARKET ECOSYSTEM
The doors market ecosystem includes raw material suppliers, door manufacturers, distributors, and end users. Raw material suppliers offer major components, such as wood, steel, aluminum, fiberglass, glass, composites, PVC, and other components. Door manufacturers produce doors of different types to meet the needs of numerous end-use industries without compromising regulatory requirements. Distributors bring market access through a proper supply chain. The residential and non-residential industries employ doors for applications requiring durability, insulation, security, weather resistance, and design versatility.
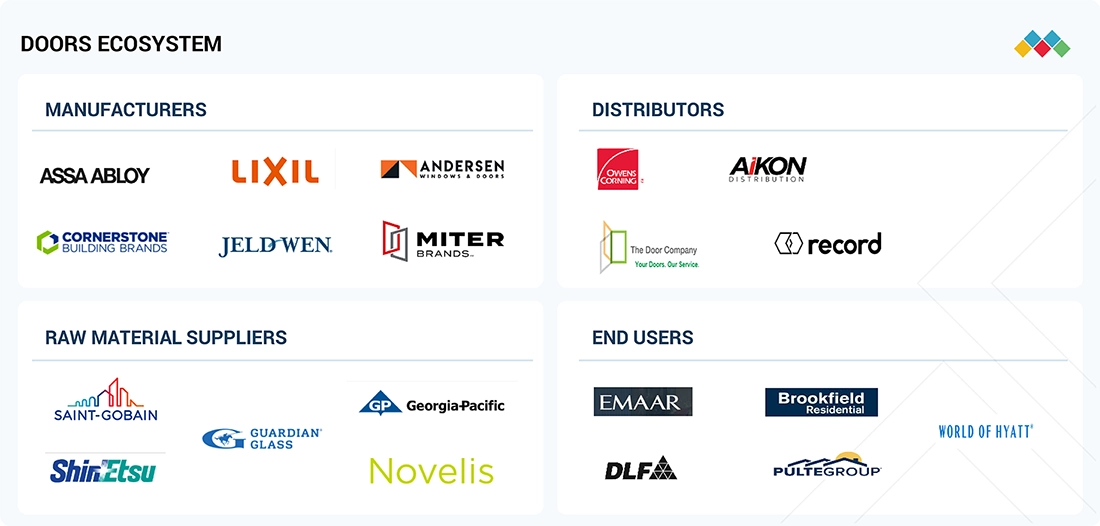
Logos and trademarks shown above are the property of their respective owners. Their use here is for informational and illustrative purposes only.
MARKET SEGMENTS
Source: Secondary Research, Interviews with Experts, MarketsandMarkets Analysis
Doors Market, By Material
The wood segment constitutes the major share of the doors market in 2024, due to its aesthetics, adaptability, and resilience. Adhering to international standards such as ICC/NFPA for fire resistance and IECC for thermal performance, it is suitable for both interior and exterior applications. Its renewable characteristics conform to sustainability standards like LEED and BREEAM.
Doors Market, By Product Type
In 2024, the interior doors category was the leader of the doors market, with the main drivers being the construction and renovation of residential and commercial buildings. The demand for aesthetically attractive and practical doors has risen due to the increasing urbanization, higher disposable incomes, and changing lifestyles. Development of composite wood, glass, and PVC, together with the trend of smart homes and environmental friendliness, has not only retained but also strengthened the segment's dominance in the doors market globally.
Doors Market, By Mechanism
In 2024, swinging doors was the predominant sector in the doors market, esteemed for their adaptability, dependability, and appropriateness for various residential and commercial applications. They offer efficient access control, privacy, and security while accommodating various design aesthetics. The increasing demand for robust, energy-efficient, and visually appealing doors, coupled with advancements in materials, intelligent hardware, and coatings, has solidified the supremacy of swinging doors.
Doors Market, By Mode of Application
New construction accounted for the largest portion of the doors market in 2024, driven by a rise in residential, commercial, and infrastructure development worldwide. Urbanization, a robust housing market, and governmental incentives for affordable housing enhance both public and private construction activities. Contemporary designs increasingly prioritize energy efficiency, fire safety, accessibility, and sustainability, fostering the use of novel materials and technologies. The aforementioned causes, along with vigorous global construction activity, perpetuate the supremacy of the new construction segment within the doors industry.
Doors Market, By Application
In 2024, the residential sector was the predominant application in the doors market, propelled by an increase in home and housing development building. Residential doors are crucial for privacy, security, energy efficiency, and visual appeal. The rise in urbanization, greater disposable incomes, and contemporary lifestyle trends have heightened the demand for durable, aesthetically pleasing, and practical doors. Advancements in materials, smart-home integration, and sustainable practices enhance the segment's expansion, positioning residential applications as the foremost catalyst of the worldwide doors market.
REGION
Asia Pacific to be the fastest-growing region in the global doors market during the forecast period
The Asia Pacific doors market is the fastest-growing and is expanding due to the large-scale residential and non-residential construction in China, India, Japan, and Other countries. The recent Five-Year Plan in China prioritizes energy-efficient and secure doors for urban development, healthcare facilities, and public edifices. The "Make in India" initiative, Production Linked Incentive (PLI) schemes, and affordable housing initiatives such as PMAY are driving the demand for durable, economical doors in urban and rural regions. Japan's construction regulations and MLIT energy efficiency standards promote the use of high-performance doors in residential and public buildings. These measures together are raising the product standards while promoting sustainability, conformity to the regulations, and construction development in the region.
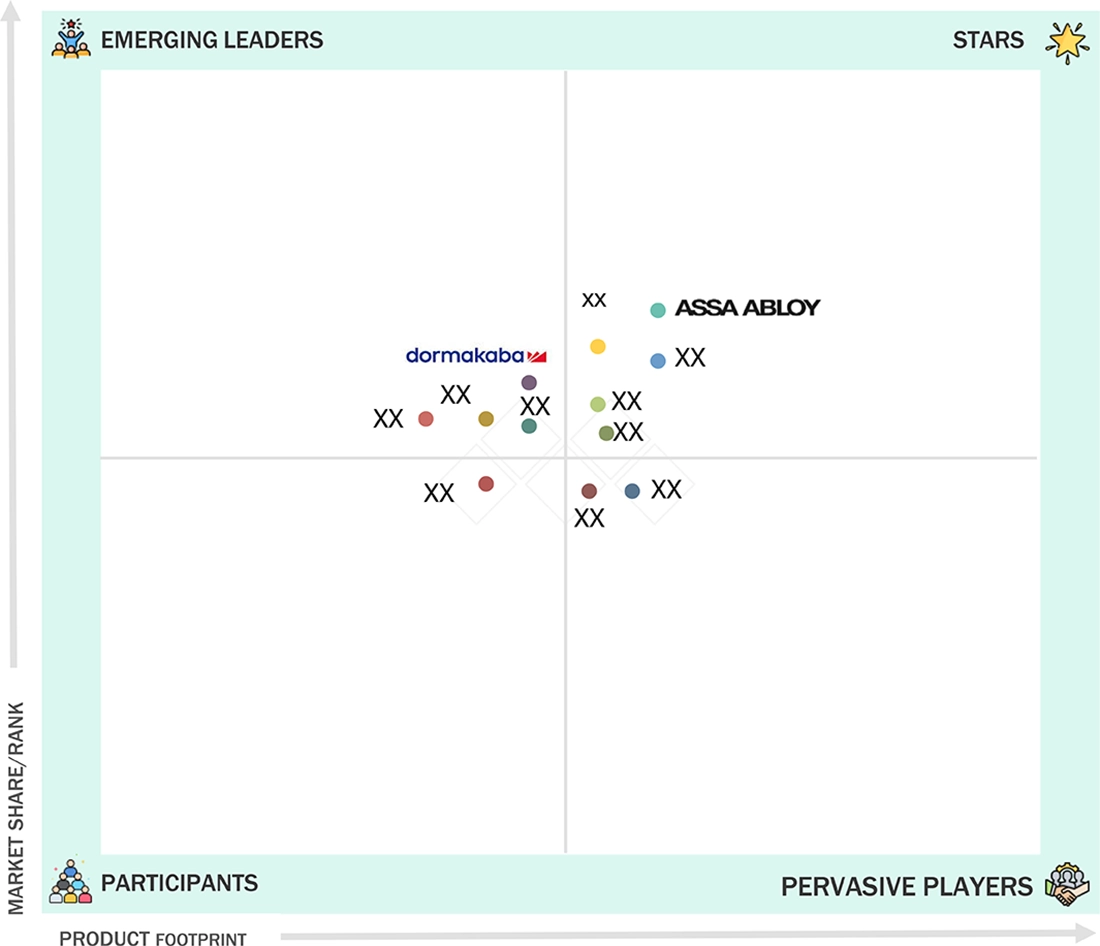
Doors Market: COMPANY EVALUATION MATRIX
The leader of the global doors market is ASSA ABLOY (Star), which has been able to maintain such a position mainly due to its strong international presence, varied product portfolio, and development in technology that covers the whole range of applications in security, access control, and doors for the residential and industrial sectors. The Dormakaba Group (Emerging Leader) is growing its presence in the market by supplying innovative, affordable, and versatile products that can be used in the residential, commercial, and industrial sectors, thus making a gradual but steady progress towards the leader’s quadrant in terms of market influence and technological capabilities.
Source: Secondary Research, Interviews with Experts, MarketsandMarkets Analysis
KEY MARKET PLAYERS
MARKET SCOPE
| REPORT METRIC | DETAILS |
|---|---|
| Market Size in 2024 (Value) | USD 78.53 BILLION |
| Market Forecast in 2030 (value) | USD 98.32 BILION |
| Growth Rate | 3.8% |
| Years Considered | 2021-2030 |
| Base Year | 2024 |
| Forecast Period | 2025-2030 |
| Units Considered | Value (USD Billion), Volume (Million Units) |
| Report Coverage | Revenue forecast, company ranking, competitive landscape, growth factors, and trends |
| Segments Covered |
|
| Regions Covered | North America, Europe, Asia Pacific, Middle East & Africa, and South America |
WHAT IS IN IT FOR YOU: Doors Market REPORT CONTENT GUIDE
DELIVERED CUSTOMIZATIONS
We have successfully delivered the following deep-dive customizations:
| CLIENT REQUEST | CUSTOMIZATION DELIVERED | VALUE ADDS |
|---|---|---|
| U.S.-based Doors Manufacturer |
|
|
| Sliding Doors Manufacturer |
|
|
| Swinging Doors Manufacturer |
|
|
RECENT DEVELOPMENTS
- June 2025 : ASSA ABLOY acquired Kingspan Door Components, a leading manufacturer of high-quality door panels for sectional doors used in residential and industrial applications.
- June 2025 : Cornerstone Building Brands, Inc. introduced its Ply Gem 1500 Vinyl Patio Door Collection with new black interior and exterior options.
- April 2025 : LIXIL Corporation and Schuco International KG strengthened their strategic partnership to accelerate efforts in reducing the whole-life carbon footprint of buildings.
- February 2025 : Allegion acquired Next Door Company, a US-based manufacturer of stainless steel and hollow metal doors, to strengthen its specialty door solutions portfolio.
- December 2024 : ASSA ABLOY acquired Premier Steel Doors and Frames, a manufacturer of hollow metal doors, frames, and aluminum windows.
Table of Contents
 Exclusive indicates content/data unique to MarketsandMarkets and not available with any competitors.
Methodology
The study involved four major activities to estimate the current size of the global doors market. Exhaustive secondary research was carried out to collect information on the market, the peer product market, and the parent product group market. The next step was to validate these findings, assumptions, and sizes with the industry experts across the value chain of doors through primary research. The top-down and bottom-up approaches were employed to estimate the overall size of the doors market. After that, market breakdown and data triangulation procedures were used to determine the size of different segments and sub-segments of the market.
Secondary Research
The market for the companies offering doors is arrived at by secondary data available through paid and unpaid sources, analyzing the product portfolios of the major companies in the ecosystem, and rating the companies by their performance and quality. Various secondary sources, such as Business Standard, Bloomberg, World Bank, and Factiva, were referred to identify and collect information for this study on the doors market. In the secondary research process, various secondary sources were referred to identify and collect information related to the study. Secondary sources included annual reports, press releases, and investor presentations of door vendors, forums, certified publications, and whitepapers. The secondary research was used to obtain critical information on the industry’s value chain, the total pool of key players, market classification, and segmentation from the market and technology-oriented perspectives.
Primary Research
In the primary research process, various primary sources from both the supply and demand sides were interviewed to obtain qualitative and quantitative information for this report. The primary sources from the supply side included industry experts, such as Chief Executive Officers (CEOs), Vice Presidents (VPs), marketing directors, technology and innovation directors, and related key executives from several key companies and organizations operating in the doors market. After the complete market engineering (calculations for market statistics, market breakdown, market size estimations, market forecasting, and data triangulation), extensive primary research was conducted to gather information and verify and validate the critical numbers arrived at. Primary research was also conducted to identify the segmentation types, industry trends, competitive landscape of doors offered by various market players, and key market dynamics, such as drivers, restraints, opportunities, challenges, industry trends, and key player strategies. In the complete market engineering process, the top-down and bottom-up approaches and several data triangulation methods were extensively used to perform the market estimation and market forecasting for the overall market segments and subsegments listed in this report. Extensive qualitative and quantitative analysis was performed on the complete market engineering process to list the key information/insights throughout the report.
The following is the breakdown of primary respondents:

Notes: Other designations include sales, marketing, and product managers.
Tier 1: >USD 1 Billion; Tier 2: USD 500 million–1 Billion; and Tier 3: < USD 500 million.
To know about the assumptions considered for the study, download the pdf brochure
Market Size Estimation
The top-down and bottom-up approaches were used to estimate and validate the size of the global doors market. These approaches were also used extensively to estimate the size of various dependent market segments. The research methodology used to estimate the market size included the following:

Data Triangulation
After arriving at the overall market size using the market size estimation processes, the market was split into several segments and subsegments. The data triangulation and market breakup procedures were employed, wherever applicable, to complete the overall market engineering process and arrive at the exact statistics of each market segment and subsegment. The data was triangulated by studying various factors and trends from both the demand and supply sides.
Market Definition
A door is a movable structure intended to facilitate entry and departure to enclosed areas while regulating access, ensuring privacy, and safeguarding interiors from external factors such as weather, noise, and dust. Doors are typically made from wood, metal, glass, plastic, or composite materials and are available in various types, swinging, sliding, folding, or overhead, to suit residential and non-residential applications. Organizations such as the Window & Door Manufacturers Association (WDMA) and Builders Hardware Manufacturers Association (BHMA) define a door system as a complete assembly including one or more panels (or leaves), a supporting frame, and other accessories and necessary hardware, i.e., hinges, locks, and handles. It might also include accessories, glass, and seals intended to improve security, acoustics, and thermal performance.
Stakeholders
- Door manufacturers
- Raw material suppliers
- Converters & processors
- Distributors and traders
- Industry associations and regulatory bodies
- End users
Report Objectives
- To define, describe, and forecast the size of the global doors market based on material, product type, mechanism, mode of application, application, and region in terms of value and volume
- To provide detailed information on the significant drivers, restraints, opportunities, and challenges influencing the market
- To strategically analyze micromarkets concerning individual growth trends, prospects, and their contribution to the market
- To assess the growth opportunities in the market for stakeholders and provide details on the competitive landscape for market leaders
- To forecast the market size of segments and subsegments for North America, Europe, Asia Pacific, South America, and the Middle East & Africa
- To strategically profile key players and comprehensively analyze their market shares and core competencies
- To analyze competitive developments such as product launches, mergers, acquisitions, expansions, collaborations, and partnerships in the doors market
- To provide the impact of AI/Gen AI on the market
Key Questions Addressed by the Report
Which factors are propelling the growth of the doors market?
Surging construction activity and energy-efficient upgrades fuel market growth, increasing urban population accelerates demand for doors, and energy-efficient building codes drive demand for high-performance doors.
What are the major challenges to the growth of the doors market?
Environmental concerns and regulatory pressure on PVC and other materials, high installation and lifecycle costs of eco-friendly doors, and high cost of advanced and energy-efficient doors are the significant challenges.
What are the major opportunities in the doors market?
Renovation surge and infrastructure investment fuel demand for advanced door solutions, and leveraging smart technologies and sustainable innovations to shape the future of doors is expected to create lucrative opportunities.
What are the major factors restraining the growth of the doors market?
The major factors restraining the growth of the doors market are meeting environmental expectations and regulatory requirements, as well as vulnerability to global supply chain disruptions.
Who are the major players in the doors market?
Major players in the doors market include ASSA ABLOY (Sweden), LIXIL Corporation (Japan), Cornerstone Building Brands, Inc. (US), JELD-WEN, Inc. (US), and Allegion plc (Ireland).
Need a Tailored Report?
Customize this report to your needs
Get 10% FREE Customization
Customize This ReportPersonalize This Research
- Triangulate with your Own Data
- Get Data as per your Format and Definition
- Gain a Deeper Dive on a Specific Application, Geography, Customer or Competitor
- Any level of Personalization
Let Us Help You
- What are the Known and Unknown Adjacencies Impacting the Doors Market
- What will your New Revenue Sources be?
- Who will be your Top Customer; what will make them switch?
- Defend your Market Share or Win Competitors
- Get a Scorecard for Target Partners

Custom Market Research Services
We Will Customise The Research For You, In Case The Report Listed Above Does Not Meet With Your Requirements
Get 10% Free CustomisationTESTIMONIALS

We at Nissan Chemicals Corporation have been clients of MarketsandMarkets for more than a year now. We recently consulted MarketsandMarkets for a study, the team at MarketsandMarkets was extremely professional and organized. The business insights were very detailed and aligned well with our expectations that really helped us formulate the Business Plans and device new strategies for development themes. MarketsandMarkets offers a unique combination of expertise and dedicated engagement model. Their research findings have helped us in designing our Pricing Strategy which will make it easier for us to predict the future sales and profits for the next ten years. We look forward to working with MarketsandMarkets in the future.
VP of Strategy & New Business Development
Leading Specialty Chemical Company
The MarketsandMarkets Engagement Model, composed of both the Knowledge Store and advisory custom research, has greatly helped us in understanding our markets and making strategic decisions. The Knowledge Store is a fast way to allow everyone in our organization to understand more about most any market they are interested in. The ability to then get custom research done and get answers to specific strategic questions and market insight has been spectacular. The Markets and Markets team feel more like colleagues than vendors and their services have helped us change our culture where statements of things like growth opportunities and competitive position are always backed by industry research.

Rich Gibson,
Director, Corporate Strategy
Milliken & Company,
Leading Industrial Manufacturer of specialty chemical, floor covering, performance and protective textile materials, and healthcaremilliken.com
MarketsandMarkets is a trusted resource that helps us to better understand markets that are near-adjacencies-whether its technology, value chain or geography. Their Knowledge Store platform provides a dashboard of markets and their characteristics which is easy to use and saves us time.
Adam Shaw,
Market Development and Strategy Manager
AdvanSix Inc. USA,
An American Leader in Chemicalswww.advansix.com
The Knowledge Store from MarketsandMarkets is a valuable tool which has helped my team acquire greater insight in to the end markets that our business serves. This has enabled us to help our company build stronger strategies throughout our planning process.
TOSHIO KINOSHITA
Senior Chif Consultion Research & Consulting Division
Mitsubishi Chemical Research Corporation,
Leading Manufacturer of Chemical Productswww.mitsubishichem-res.co.jp/en/

We recently engaged with MarketsandMarkets for a study, the team not only clearly understood our business objectives but was also extremely professional in the way they handled the entire project. The study was efficiently conducted in a phase-wise manner, and the engagement model furnished us with high-quality business insights that far exceeded our expectations at each phase. We were especially happy that MarketsandMarkets could provide us with both, an English as well as a Japanese version of the study. A special thanks to the Analyst Team and Client Services Team, whose fluency in Japanese enhanced our comfort level, as we could converse with them in our preferred language.
Independent entrepreneurs
Arrow Precision
We approached MarketsandMarkets for study on Proppants Market, and their work exceeded our expectations. The study conducted was comprehensive and enabled us to view the market through the various dimensions. In addition, the team was extraordinarily responsive throughout the process and resolved our queries on time. I strongly recommend MarketsandMarkets and will certainly consider them for additional market assessments we will need in the future.
Global engineering company, Japan
Deputy Manager,
Strategic Planning OfficeThe high-quality insights shared by the MarketsandMarkets team helped us understand the pharmaceutical plant designers in a specific geography. It also captured the risks that we may likely face in communicating with our potential partners. The study would enable us identify partners, which would impact our future growth.


Growth opportunities and latent adjacency in Doors Market