Dosing Systems Market by Pump Type (Diaphragm, Piston, and Others), by Application (Water and wastewater treatment, Oil & Gas, Chemical Processing, Pharmaceuticals, Paper & Pulp, Food & Beverages, and Others), & Region - Global Trends and Forecasts to 2019


[149 Pages Report] Growing importance to water and wastewater treatment by national governments and increased production from pharmaceuticals and chemical processing industries are expected to drive the global dosing systems market. It is estimated to reach $5.3 Billion by 2019, at a CAGR of 5.0% from 2014 to 2019. The African and Middle East markets are expected to have high growth due to the diversification of economies and reduced dependence on oil; these regions are expected to witness high growth during the forecast period.
The major players in this market include IDEX Corp. (U.S.), Grundfos GmbH (Denmark), Seko S.p.A (Italy), SPX Corp. (U.S.), and Prominent GmbH (Germany).
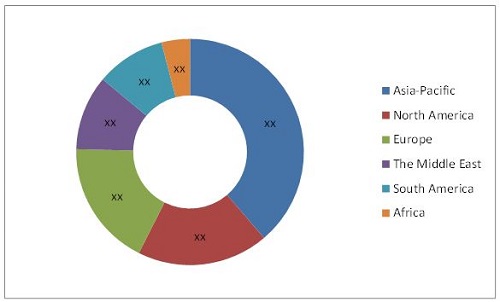
Asia-Pacific accounts for the largest dosing system market due to the presence of manufacturing facilities of large chemical, food & beverages, paper & pulp, and pharmaceutical companies. While the North American and European markets are reaching their maturity, but, other regions are exhibiting a decent growth given the emergence of new industrial sectors.
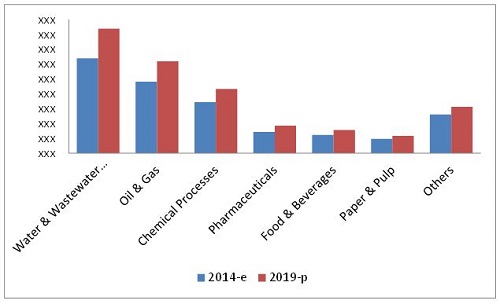
Diaphragm pumps are most widely used in dosing system, and are expected to occupy the majority share in the market during the forecast period. The water and wastewater treatment sector is the largest end-user segment of dosing systems. With national governments emphasizing on the need for treatment of wastewater, the demand for dosing pumps in the sector has increased substantially.
The lack of greenfield investments and maturing European markets are major restraints for the players of the dosing system market. Most companies are based in Europe, which has slowed down. To counter this situation, the companies have been trying to increase their geographic presence and market penetration is other regions through the launch of new and advanced products & technologies.
Dosing Systems Market Share (by Value), 2014-2019
Source: MarketsandMarkets Analysis
For this report, the major players in the market have been identified through secondary and primary research, based on which, their market shares have been evaluated. This includes a study of the annual reports of the top market players and interviews with key opinion leaders such as CEOs, directors, and marketing personnel.
The size of the overall market has been determined by forecast techniques based on the demand for dosing system in different regions, which has been validated through primary sources. The market size for various types of dosing systems has been determined and evaluated using primary and secondary researches. The market data is available from 2012 to 2019 with a CAGR from 2014 to 2019.
This report also analyzes various marketing trends and establishes the most effective growth strategy. It identifies market dynamics such as drivers, opportunities, burning issues, and winning imperatives. Major companies such as IDEX Corp. (U.S.), Grundfos GmbH (Germany), Seko S.p.A (Italy), SPX Corp. (U.S.), and Prominent GmbH (Germany) have also been profiled in this report.
Scope of the Report:
On the Basis of Pump Type:
- Diaphragm
- Piston
- Others
On the Basis of Application:
- Water and Wastewater Treatment
- Oil & Gas
- Pharmaceuticals
- Chemical Processes
- Food & Beverages
- Paper & Pulp
- Offshore
On the Basis of Region:
- Asia-Pacific
- Europe
- Middle East
- Africa
- North America
- South America
Dosing systems market: $5.3 Billion market by 2019 signifies a firm annualized growth rate of 5.0% from 2014 to 2019.
In this report, the market has been analyzed on the basis of revenue generated by dosing systems supplied by companies to end-users. Major value generation activities have been recorded in Asia-Pacific, and the remaining regions are growing at a high growth rate due to industrialization, which is creating growth prospects for the dosing system market. However, the North American market is reaching a stage of maturity.
Dosing is the process of injecting a substance into a process. It is extensively used in various manufacturing and processing industry verticals for precision, effectiveness, and faster outputs. This market has exhibited strong demand over the last few years. The increase in demand from pharmaceuticals, food & beverages, and water & chemical industries in emerging economies such as China and India are driving the growth of this market. Companies are investing in R&D to develop new and improved dosing system to meet customized demands of end-users.
Diaphragm pumps are most widely used in dosing system and occupied the major market share in 2014. The water and wastewater treatment sector is the largest end-user segment of dosing systems. With national governments emphasizing on the need for treatment of wastewater, the demand for dosing pumps in the sector has increased substantially.
The lack of greenfield investments and maturing European markets are the major restraints for the players of the dosing systems market. Most companies are based in Europe, where the market has slowed down. To counter this situation, companies have been trying to increase their geographic presence and market penetration in other regions through the launch of new and advanced products & technologies.
This market has great opportunities outside North America; however, its growth depends on various reasons, including environment, which are the major hurdles for the growth of this market.
Dosing Systems Market Size, by Region, 2012-2019
Source: MarketsandMarkets Analysis
Currently, Asia-Pacific dominates the dosing systems market due to continuous and large increment in industrialization in the region. Asia-Pacific had the highest market share in 2014 because of favorable regulations in the region.
 Exclusive indicates content/data unique to MarketsandMarkets and not available with any competitors.
Table of Contents
1 Introduction (Page No. - 14)
1.1 Objectives of the Study
1.2 Market Definition
1.3 Study Scope
1.3.1 Markets Covered
1.3.2 Years Considered for the Study
1.4 Currency
1.5 Limitations
1.6 Stakeholders
2 Research Methodology (Page No. - 17)
2.1 Research Data
2.1.1 Secondary Data
2.1.1.1 Key Data From Secondary Sources
2.1.2 Primary Data
2.1.2.1 Key Data From Primary Sources
2.1.2.2 Key Industry Insights
2.1.2.3 Breakdown of Primaries
2.2 Factor Analysis
2.2.1 Introduction
2.2.2 Demand Side Analysis
2.2.2.1 Rise in Demand for Water and Wastewater Treatment
2.2.3 Supply Side Analysis
2.3 Market Size Estimation
2.3.1 Bottom-Up Approach
2.3.2 Top-Down Approach
2.4 Market Breakdown & Data Triangulation
2.5 Assumptions & Limitations
2.5.1 Assumptions
2.5.2 Limitations
3 Executive Summary (Page No. - 27)
4 Premium Insights (Page No. - 32)
4.1 Asia-Pacific is Expected to Dominate the Market in the Next Five Years
4.2 Dosing Systems Market is Equally Dispersed, Globally
4.3 Dosing Systems, By Pump Type
4.4 Diaphragm Pump Driven Dosing Systems are Projected to Dominate the Market During the Forecast Period
4.5 By Application
4.6 Life Cycle Analysis, By Region
5 Market Overview (Page No. - 39)
5.1 Introduction
5.2 Market Segmentation
5.2.1 By Pump Type
5.2.1.1 Diaphragm Pump
5.2.1.2 Piston Pump
5.2.1.3 Peristaltic Pump
5.2.1.4 Others
5.2.2 By Application
5.2.2.1 Water and Wastewater Treatment
5.2.2.2 Oil & Gas
5.2.2.3 Pharmaceuticals
5.2.2.4 Others
5.3 Market Dynamics
5.3.1 Drivers
5.3.1.1 Governments Encouragement in Using Energy Efficient Products
5.3.1.2 Rapid Urbanization and Industrialization
5.3.1.3 Growing Need for Wastewater Treatment Applications
5.3.1.4 Increasing Demand for Pharmaceutical Products
5.3.2 Restraints
5.3.2.1 Lack of Green Field Investments
5.3.2.2 Slowing Economies in Europe
5.3.3 Opportunity
5.3.3.1 Significant Demand for Coal Bed Methane Reserves
5.3.4 Challenges
5.3.4.1 Growing Customization Demands From Consumers
5.3.4.2 Increasing Raw Material Prices
6 Industry Trends (Page No. - 47)
6.1 Introduction
6.2 Supply-Chain Analysis
6.2.1 Key Influencers
6.3 Porter�s Five Forces Analysis
6.3.1 Threat of New Entrants
6.3.2 Threat of Substitutes
6.3.3 Bargaining Power of Suppliers
6.3.4 Bargaining Power of Buyers
6.3.5 Intensity of Competitive Rivalry
7 Market Analysis, By Pump Type (Page No. - 53)
7.1 Introduction
7.2 Diaphragm Pumps
7.3 Piston Pumps
7.4 Others
8 Market Analysis, By Application (Page No. - 59)
8.1 Introduction
8.2 Water& Wastewater Treatment Continues to Dominate this Market
8.3 Water & Wastewater Treatment
8.4 Oil & Gas
8.5 Chemical Processes
8.6 Pharmaceuticals
8.7 Food & Beverages
8.8 Paper & Pulp
8.9 Other Industries
9 Market Analysis, By Region (Page No. - 72)
9.1 Introduction
9.2 North America
9.2.1 U.S.
9.2.2 Canada
9.2.3 Mexico
9.3 Asia-Pacific
9.3.1 China
9.3.2 Australia
9.3.3 Indonesia
9.3.4 India
9.3.5 Rest of Asia-Pacific
9.4 Europe
9.4.1 Russia
9.4.2 Germany
9.4.3 U.K.
9.4.4 Rest of Europe
9.5 South America
9.5.1 Argentina
9.5.2 Venezuela
9.5.3 Brazil
9.5.4 Rest of South America
9.6 Africa
9.6.1 Angola
9.6.2 Egypt
9.6.3 South Africa
9.6.4 Rest of Africa
9.7 Middle East
9.7.1 Saudi Arabia
9.7.2 UAE
9.7.3 Qatar
9.7.4 Rest of Middle East
10 Competitive Landscape (Page No. - 110)
10.1 Overview
10.2 Market Share Analysis, By Key Players
10.3 Competitive Situation & Trends
10.3.1 Contracts & Agreements
10.3.2 New Product/Technology Launches
10.3.3 Expansions
10.3.4 Mergers & Acquisitions
11 Company Profiles (Page No. - 118)
(Company at A Glance, Recent Financials, Products & Services, Strategies & Insights, & Recent Developments)*
11.1 Introduction
11.2 Grundfos GmbH.
11.3 Idex Corporation.
11.4 Prominent Dosiertechnik GmbH
11.5 Seko Spa.
11.6 SPX Corporation.
11.7 Blue-White Industries, Ltd.
11.8 Emec Srl.
11.9 Gee & Co. Effluent Control & Recovery Ltd.
11.10 Lewa GmbH.
11.11 Netzsch Pumpen & Systeme GmbH
*Details on Company at A Glance, Recent Financials, Products & Services, Strategies & Insights, & Recent Developments Might Not Be Captured in Case of Unlisted Companies.
12 Appendix (Page No. - 143)
12.1 Insights From Industry Experts
12.2 Discussion Guide
12.3 Available Customizations
12.4 Introducing RT: Real Time Market Intelligence
12.5 Related Reports
List of Tables (64 Tables)
Table 1 Dosing Systems Market Size, By Type, 2012-2019 ($Million)
Table 2 Diaphragm Pumps Market Size, By Region, 2012-2019 ($Million)
Table 3 Piston Pumps Market Size, By Region, 2012-2019 ($Million)
Table 4 Other Pumps Market Size, By Region, 2012-2019 ($Million)
Table 5 Dosing Systems Market Size, By Application, 2012-2019 ($Million)
Table 6 Water & Wastewater Treatment Dosing Systems Market Size, By Region, 2012-2019 ($Million)
Table 7 Water & Wastewater Treatment Dosing Systems Market Size, By Country, 2012-2019 ($Million)
Table 8 Oil & Gas Dosing Systems Market Size, By Region, 2012-2019 ($Million)
Table 9 Oil & Gas Dosing Systems Market Size, By Major Country,2012-2019 ($Million)
Table 10 Chemical Processes Dosing Systems Market Size, By Region,2012-2019 ($Million)
Table 11 Chemical Processes Dosing System Market Size, By Country,2012-2019 ($Million)
Table 12 Pharmaceuticals Dosing Systems Market Size, By Region,2012-2019 ($Million)
Table 13 Food & Beverages Dosing Systems Market Size, By Region,2012-2019 ($Million)
Table 14 Paper & Pulp Dosing Systems Market Size, By Region,2012-2019 ($Million)
Table 15 Other Industries Dosing Systems Market Size, By Region,2012-2019 ($Million)
Table 16 Other Industries Dosing System Market Size, By Country,2012-2019 ($Million)
Table 17 Dosing Systems Market Size, By Region, 2012-2019 ($Million)
Table 18 Dosing System Market Size, By Major Country, 2012-2019 ($Million)
Table 19 North America: Dosing Systems Market Size, By Application,2012-2019 ($Million)
Table 20 North America: Market Size, By Pump Type,2012-2019 ($Million)
Table 21 North America: Market Size, By Country,2012-2019 ($Million)
Table 22 U.S.: Dosing Systems Market Size, By Application, 2012-2019 ($Million)
Table 23 Canada: Dosing Systems Market Size, By Application, 2012-2019 ($Million)
Table 24 Mexico: Dosing System Market Size, By Application, 2012-2019 ($Million)
Table 25 Asia-Pacific: Dosing Systems Market Size, By Application,2012-2019 ($Million)
Table 26 Asia-Pacific: Market Size, By Pump Type,2012-2019 ($Million)
Table 27 Asia-Pacific: Market Size, By Country,2012-2019 ($Million)
Table 28 China: Dosing Systems Market Size, By Application, 2012-2019 ($Million)
Table 29 Australia: Dosing Systems Market Size, By Application,2012-2019 ($Million)
Table 30 Indonesia: Dosing System Market Size, By Application,2012-2019 ($Million)
Table 31 India: Dosing Systems Market Size, By Application, 2012-2019 ($Million)
Table 32 Rest of Asia-Pacific: Dosing Systems Market Size, By Application,2012-2019 ($Million)
Table 33 Europe: Dosing Systems Market Size, By Application, 2012-2019 ($Million)
Table 34 Europe: Market Size, By Pump Type, 2012-2019 ($Million)
Table 35 Europe: Market Size, By Country, 2012-2019 ($Million)
Table 36 Russia: Dosing Systems Market Size, By Application, 2012-2019 ($Million)
Table 37 Germany: Dosing System Market Size, By Application,2012-2019 ($Million)
Table 38 U.K.: Dosing System Market Size, By Application, 2012-2019 ($Million)
Table 39 Rest of Europe: Dosing Systems Market Size, By Application,2012-2019 ($Million)
Table 40 South America: Dosing Systems Market Size, By Application,2012-2019 ($Million)
Table 41 South America: Market Size, By Pump Type,2012-2019 ($Million)
Table 42 South America: Market Size, By Country,2012-2019 ($Million)
Table 43 Argentina: Dosing Systems Market Size, By Application,2012-2019 ($Million)
Table 44 Venezuela: Dosing System Market Size, By Application,2012-2019 ($Million)
Table 45 Brazil: Dosing Systems Market Size, By Application, 2012-2019 ($Million)
Table 46 Rest of South America: Dosing System Market Size, By Application,2012-2019 ($Million)
Table 47 Africa : Dosing Systems Market Size, By Application, 2012-2019 ($Million)
Table 48 Africa: Market Size, By Pump Type, 2012-2019 ($Million)
Table 49 Africa : Market Size, By Country, 2012-2019 ($Million)
Table 50 Angola: Dosing Systems Market Size, By Application, 2012-2019 ($Million)
Table 51 Egypt: Dosing System Market Size, By Application, 2012-2019 ($Million)
Table 52 South Africa: Dosing Systems Market Size, By Application,2012-2019 ($Million)
Table 53 Rest of Africa: Dosing System Market Size, By Application,2012-2019 ($Million)
Table 54 Middle East : Dosing System Market Size, By Application,2012-2019 ($Million)
Table 55 Middle East: Market Size, By Pump Type,2012-2019 ($Million)
Table 56 Middle East: Market Size, By Country,2012-2019 ($Million)
Table 57 Saudi Arabia: Dosing Systems Market Size, By Application,2012-2019 ($Million)
Table 58 UAE: Dosing Systems Market Size, By Application, 2012-2019 ($Million)
Table 59 Qatar: Dosing System Market Size, By Application, 2012-2019 ($Million)
Table 60 Rest of the Middle East: Dosing Systems Market Size, By Application, (2014-2019) ($Million)
Table 61 Contracts & Agreements, 2013-2014
Table 62 New Product/Technology Launches, 2013-2014
Table 63 Expansions, 2011-2013
Table 64 Mergers & Acquisitions, 2012-2014
List of Figures (41 Figures)
Figure 1 Dosing Systems Market: Research Design
Figure 2 Market Size Estimation Methodology: Bottom-Up Approach
Figure 3 Market Size Estimation Methodology: Top-Down Approach
Figure 4 Market Breakdown & Data Triangulation
Figure 5 Assumptions
Figure 6 Limitations of Research Study
Figure 7 Regional Snapshot (2014 vs. 2019),Asia-Pacific Set to Dominate this Market Till 2019
Figure 8 Dosing System Market Size, By Application, 2014-2019 ($Million)
Figure 9 Dosing System Market Size, By Pump Type, 2014 & 2019 ($Million)
Figure 10 China is Expected to Be the Most Attractive Market for Dosing System Manufacturers in 2014
Figure 11 Water & Wastewater Treatment Application to Grow at the Fastest Rate During the Forecast Period in Asia-Pacific
Figure 12 Increasing Importance of Wastewater Treatment Driving This Market
Figure 13 Increasing Production in Industries is Driving the Market Figure 14 Asia-Pacific to Continue to Grow at A High Rate in the Next Five Years
Figure 15 Diaphragm Pumps are Expected to Continue to Dominate This Market During the Forecast Period
Figure 16 Asia-Pacific Held the Majority Share in the Diaphragm Pump Dosing Systems Market, 2014
Figure 17 Water and Wastewater Treatment is Expected to Grow at A Higher Rate During the Forecast Period
Figure 18 Rapid Industrialization to Trigger the Growth of this Market in Asia-Pacific
Figure 19 Market Segmentation: By Application, Type & Region
Figure 20 Drivers, Restraints, Opportunities and Challenges
Figure 21 Dosing System Market: Supply Chain
Figure 22 Porter�s Five Forces Analysis
Figure 23 Dosing Systems Market Size, By Pump Type, 2012-2019 ($Million)
Figure 24 Water & Wastewater Application Dominated this Market Share (Value), (2014 & 2019)
Figure 25 Asia-Pacific is Expected to Dominate the Market in the Next Five Years
Figure 26 North America Dosing System Market: an Overview
Figure 27 Mexico Will Demand Highest Number of the Dosing Systems in The Next Five Years
Figure 28 U.S. is A Major Market for Manufacturers of Dosing Systems
Figure 29 The Manufacturing Sector in Canada is Expected to Witness Growth After A Decline in the Past Decade
Figure 30 Asia-Pacific Market: an Overview
Figure 31 Companies Adopted Mergers & Acquisitions and Expansions as the Key Growth Strategies From 2011 - 2014
Figure 32 Dosing Systems, By Major Market Players, 2013
Figure 33 Market Evaluation Framework
Figure 34 Battle for Market Share: New Product Launches Was the Key Strategy
Figure 35 Grundfos GmbH: SWOT Analysis
Figure 36 Idex Corporation: Company Snapshot
Figure 37 Idex Corporation: SWOT Analysis
Figure 38 Prominent Dosiertechnik GmbH: SWOT Analysis
Figure 39 Seko Spa: SWOT Analysis
Figure 40 SPX Corporation: Company Snapshot
Figure 41 SPX Corporation: SWOT Analysis


Growth opportunities and latent adjacency in Dosing Systems Market