Epichlorohydrin (ECH) Market By Applications (Epoxy Resins, Synthetic Glycerin, Water Treatment Chemicals, Pharmaceuticals) & Feedstock (Propylene, Glycerin) - Global Market Trends & Forecast To 2017


[189 Pages Report] The increasing demand of Epichlorohydrin in China and growth in the end-user segments such as paint and electronic industry are key factors to drive the global market. Epoxy resin is the main application which consumes a large part of ECH. Properties of epoxy resin make it suitable for wide variety of applications such as paints, electrical & electronics, construction, wind turbine, composites, adhesives, and others. Since, epoxies have the largest share in applications; growth of the epoxy resin industry will ultimately contribute to the growth of the industry.
Most of the companies are the captive producers of Epichlorohydrin and utilize entire market produced for epoxy resin manufacturing. Top players such as Dow Chemical Company (U.S.), Formosa Plastics, and Momentive Performance Materials Inc. are captive producers.
The ECH consumption is estimated to be 1,520 kilo tons in 2012 and will grow by 4.8% annually till 2017. It has wide range of applications from epoxy resins, synthetic glycerin, water treatment resins, pharmaceuticals and others (epichlorohydrin-based rubber, textiles, papers, inks, dyes, ion exchange resins, agricultural products such as insecticides, bactericides, and fungicides).
Traditionally, epichlorohydrin (ECH) is being produced through petro-based feedstock, i.e. from propylene. However, companies have started using glycerin which is slowly replacing propylene. Glycerin is a bio-based feedstock and can be obtained easily as byproduct from biodiesel production. The increasing availability of bio-based glycerin from biodiesel production makes it possible to produce bio-based epichlorohydrin.
Highest growth can be seen in China where most of the companies either have already established or planning to set up their manufacturing plants. Growing domestic markets of Asia-Pacific region, low cost of raw material and labor are attracting companies towards China. By 2017, China will become the largest producer as well as exporter of ECH.
The Epichlorohydrin market report studies and forecasts the ECH market till 2017. The market is further segmented and forecasted for major regions such as: Americas, Europe, Asia–Pacific, and Rest of the World that include key growth regions such as China, U.S., and Taiwan. Major countries with the volumes and revenues are covered for each of the region. Market estimations have been provided in terms of consumption volume (kilo tons) and market revenue (USD). The global as well as regional markets have been segmented by applications such as epoxy resins, synthetic glycerin, water treatment resins, pharmaceuticals, and others. The Epichlorohydrin market report also analyzes various manufacturing process and feedstock for ECH production.
Various secondary sources such as chemical magazines, encyclopedia, directories, technical handbooks, company annual reports, industry association, publications, articles, trade websites, and databases have been referred to identify and collect information useful for this extensive commercial study of global ECH market. The primary sources – experts from related industries and suppliers – have been interviewed to obtain and verify critical information as well as to assess the future prospects and market estimations.
We have also profiled leading players of Epichlorohydrin industry with their recent developments and other strategic industry activities. Key participants in the global epichlorohydrin (ECH) market include U.S-based The Dow Chemical Company and Momentive Performance Materials Holdings LLC, Belgium-based Solvay Chemicals SA, China-based Shandong Haili Chemical Industry Co. Ltd, Saudi Arabia’s NAMA Chemicals, Czech Republic-based Spolchemie A.S., and Taiwan-based Formosa Plastics Group.
Scope of the Report
On basis of geography:
- Asia-Pacific
- Europe
- Americas
- ROW
On basis of application:
- Epoxy resins
- Synthetic glycerin
- Water treatment chemicals
- Pharmaceuticals
- Others (elastomers, epichlorohydrin-based rubber, textiles, papers, inks, and dyes, and ion exchange resins)
On basis of end uses:
- Paints & Applications
- Electrical & Electronics
- Construction
- Wind Turbine
- Composites
- Adhesives
- Others
The manufacturing processes (based on feedstock) identified and included are:
- Propylene-based
- Glycerin-based
The global Epichlorohydrin industry is witnessing high growth on account of increasing applications, technological advancements, and growing end-user segments. ECH is used in various applications such as epoxy resin, synthetic glycerin, pharmaceuticals, water treatment chemicals, and others.
High growth in Asia-Pacific region and high demand from end-user segments are important market drivers which have a high impact on market at present. Increasing demand for bio-based ECH has been identified as the major opportunity which is attracting all the Epichlorohydrin manufacturers.
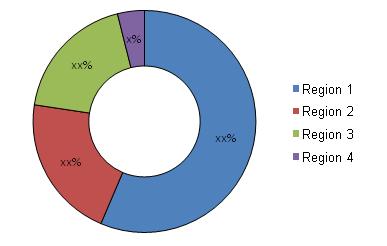
Epichlorohydrin Market Share, by Geography, 2011
Source: Secondary Research, Expert Interviews, MarketsandMarkets Analysis
Asia-Pacific is identified as the largest market as well as the highest growing in the next five years among all regional markets. After Asia-Pacific, Europe and North America regions accounted for the second and third largest market share, respectively for ECH consumption.
Major players of Epichlorohydrin market are Dow Chemical Company (U.S.), Shandong Haili Chemical Industry Co. Ltd (Haili) (China), Solvay SA (Belgium), Momentive Performance Materials Inc. (U.S.), Jiangsu Yangong (China), Formosa Plastics Group (Thailand), Xinyue (China), Daisco (Japan), and Samsung Fine Chemicals (South Korea). The growing demand for ECH globally has prompted most of the companies to expansions, increase production capacities to improve their market share.
Companies in Epichlorohydrin market, whether big or small, are looking for opportunities to penetrate deeper into the existing market and at the same time expand into new and emerging markets to increase their sales volume. Increasing manufacturing capacities in existing and new locations is the preferred key strategy followed by top players in Epichlorohydrin market. The new markets where companies are expanding their presence are Asia-Pacific, particularly China, Taiwan, and Thailand.
 Exclusive indicates content/data unique to MarketsandMarkets and not available with any competitors.
Table Of Contents
1 Introduction (Page No. - 17)
1.1 Key Take-Aways
1.2 REPORT DESCRIPTION
1.3 Markets COVERED
1.4 STAKEHOLDERS
1.5 Research Methodology
1.5.1 MARKET SIZE
1.5.2 KEY DATA POINTS TAKEN FROM SECONDARY SOURCES
1.5.3 MAJOR SECONDARY SOURCES USED
1.5.4 KEY DATA POINTS Collected Through Expert Interviews
1.5.5 ASSUMPTIONS MADE FOR THIS REPORT
2 EXECUTIVE SUMMARY (Page No. - 23)
3 Market Overview (Page No. - 25)
3.1 Introduction
3.2 Value Chain Analysis
3.3 Market Dynamics
3.3.1 Drivers
3.3.1.1 High Growth Will Spur In Asia-Pacific
3.3.1.2 Growing Consumption Of Epoxy Resins In End-User Industries
3.3.2 Restraint
3.3.2.1 Concerns For Environmental And Human Exposure
3.3.2.1.1 Human Exposure
3.3.2.1.2 Environmental
3.3.2.1.3 Water
3.3.3 Opportunities
3.3.3.1 Increasing Demand For Bio-Based Epichlorohydrin
3.4 Burning Issues
3.4.1 Volatile Prices Of Raw Materials
3.4.2 Declining Profit Margins
3.5 WINNING IMPERATIVES
3.6 Regulations
3.7 Porter’s Five Forces
3.7.1 SUPPLIERS’ POWER
3.7.2 BUYERS’ POWER
3.7.3 THREAT OF NEW ENTRANTS
3.7.4 THREAT OF SUBSTITUTES
3.7.5 DEGREE OF COMPETITION
3.8 Price Analysis
3.9 Patent Analysis
4 Epichlorohydrin Market, By Raw Materials & Manufacturing Processes (Page No. - 49)
4.1 Introduction
4.2 Lucrative Growth In Glycerin-Based Epichlorohydrin
4.3 PRODUCTION PROCESS
4.3.1 Allyl Chloride Route
4.3.2 Allyl Alcohol Route
4.3.3 Glycerin Route
5 Epichlorohydrin (ECH) Market, By Applications (Page No. - 55)
5.1 Introduction
5.2 Epoxy Resins
5.2.1 High Production Of Epoxy Resins In Asia-Pacific Leading To Increasing Consumption Of Epichlorohydrin
5.2.2 END USES OF EPOXY RESINS
5.2.2.1 Paints & Coatings
5.2.2.2 Electrical & Electronics
5.2.2.3 Construction
5.2.2.4 Wind Turbines
5.2.2.5 Composites
5.2.2.6 Adhesives
5.2.3 Synthetic Glycerin
5.2.3.1 Epichlorohydrin To Synthetic Glycerin: Uneconomical Process
5.2.3.2 Europe Alone Uses Epichlorohydrin For Synthetic Glycerin Production
5.2.4 Water Treatment Chemicals
5.2.4.1 Significant Consumption In Americas
5.2.5 Pharmaceutical Industry
5.2.5.1 Significant Consumption In Asia-Pacific
5.2.6 OTHERS
6 Epichlorohydrin (Ech) Market, By Geography (Page No. - 79)
6.1 Introduction
6.1.1 Moderate Growth In Ech Consumption
6.1.2 Revenue Affected By Decline In Prices
6.2 Asia-Pacific
6.2.1 China Is The Leading Consumer
6.2.2 Maximum Ech Goes For Epoxy Resin Production
6.2.3 End Use Epoxy Resin Applications To Drive Ech Market
6.2.4 Import-Export Analysis
6.2.4.1 Import To China Declined Drastically
6.2.4.2 With Establishment Of New Plants, China Becoming The Export Center
6.2.4.3 China Ech Market
6.2.4.3.1 China Is The Largest Producer Of Ech
6.2.4.3.2 Increasing Manufacturing Capacity Of Epoxy Resin - Main Growth Driver
6.2.4.4 Taiwan
6.2.4.4.1 Ech Consumption Estimates
6.2.4.4.2 Ech Revenue Estimates
6.3 Americas
6.3.1 Consumption Lies In U.S.
6.3.2 Water Treatment Chemicals Have Significant Consumption Of Ech In Americas
6.3.3 Import-Export Analysis
6.3.3.1 Most Countries In Americas Depend On Import
6.3.3.2 U.S. Is The Only Significant Exporter
6.3.4 U.S.
6.4 Europe
6.4.1 Modest Growth Experienced By European Countries
6.4.2 Sole Region With Ech Consumption In Synthetic Glycerin
6.4.3 Import-Export Analysis
6.4.3.1 Western Europe
6.4.3.2 Eastern Europe
6.4.4 Germany Dominates The European Market
7 Competitive Landscape (Page No. - 126)
7.1 MARKET SHARE ANALYSIS
7.1.1 Propylene-Based Epichlorohydrin : Market Share Analysis
7.1.2 Glycerin-Based Epichlorohydrin : Market Share Analysis
7.1.3 Epoxy Resin: Market Share Analysis
7.2 Strategic Development
7.2.1 Expansion At New Locations: MOST POPULAR GROWTH STRATEGY
7.2.2 MAXIMUM DEVELOPMENTS IN 2011
7.2.3 ASIA-PACIFIC: REGION WITH MAXIMUM DEVELOPMENTS
7.2.4 Expansion At New Locations
7.2.5 Expansion At Current Location
7.2.6 Change In Technology
7.2.7 Mergers & Acquisitions
8 COMPANY PROFILES (Page No. - 144)
(Overview, Financials, Products & Services, Strategy, And Developments)*
8.1 Aditya Birla Chemicals (Thailand)
8.2 DAISO Co. Ltd
8.3 FORMOSA PLASTIC CORPORATION
8.4 Hanwha Chemical
8.5 Jiangsu Yangnong Chemical Group Co. Ltd
8.6 KASHIMA CHEMICAL CO. LTD
8.7 Momentive Speciality Chemicals
8.8 NAMA Chemicals
8.9 Samsung Fine Chemicals Co. Ltd
8.10 Shandong Haili Chemical Industry Co. Ltd
8.11 SOLVAY
8.12 Spolchemie A.S
8.13 Sumitomo Chemical
8.14 Tamilnadu Petroproducts Ltd
8.15 The Dow Chemical Company
8.16 ZAK£ADY Chemiczne Zachem SA
*Details On Overview, Financials, Product & Services, Strategy, And Developments Might Not Be Captured In Case Of Unlisted Companies.
List Of Tables (102 Tables)
Table 1 Company Expansion Plans For Epichlorohydrin In Asia-Pacific
Table 2 ECH & Its Maximum Contaminant Levels (Mcls)
Table 3 Existing & Planned Epichlorohydrin Plants
Table 4 Propylene & Glycerin PRICES, 2010 - 2012 ($/Mtons)
Table 5 ORGANIC EXPANSION STRATEGY, BY MAJOR PLAYERS
Table 6 Regulations For Epichlorohydrin Market
Table 7 Regulatory Occupational Exposure Limits For Ech, By Countries
Table 8 BASIC ECH AVERAGE PRICES, BY GEOGRAPHY, 2010 – 2017 ($/TON)
Table 9 Number Of Patents Published, By Country/Region, 2005 – 2012
Table 10 PATENT ANALYSIS, BY COMPANY, 2005 – 2012
Table 11 Epichlorohydrin Market Consumption, By Raw Materials, 2010 – 2017 (Ktons)
Table 12 Epichlorohydrin Market Consumption, By Raw Materials, 2010 – 2017 ($Million)
Table 13 Global Epichlorohydrin Market Consumption, By Applications, 2010 – 2017 (Ktons)
Table 14 Global Epichlorohydrin Market Revenue, By Applications, 2010 – 2017 ($Million)
Table 15 KEY MANUFACTURERS OF EPOXY RESINS
Table 16 Epoxy Resin: Epichlorohydrin Market Consumption, By Geography, 2010 – 2017 (Ktons)
Table 17 Epoxy Resin: Epichlorohydrin Market Revenue, By Geography, 2010 – 2017 ($Million)
Table 18 Epoxy Resins: Epichlorohydrin Market Consumption, By End Use Segments, 2010 – 2017 (Ktons)
Table 19 Epoxy Resins: Epichlorohydrin Market Revenue, By End Use Segments, 2010 – 2017 ($Million)
Table 20 ECH Consumption In Paints & Applications Segment, By Geography, 2010 – 2017 (Ktons)
Table 21 Epichlorohydrin Consumption In Electrical & Electronics Segment, By Geography, 2010 – 2017 (Ktons)
Table 22 Epichlorohydrin Consumption In Construction Segment, By Geography, 2010 – 2017 (Ktons)
Table 23 Epichlorohydrin Consumption In Wind Turbines Segment, By Geography, 2010 – 2017 (Ktons)
Table 24 ECH Consumption In Composites Segment, By Geography, 2010 – 2017 (Ktons)
Table 25 Epichlorohydrin Consumption In Adhesives Segment, By Geography, 2010 – 2017 (Ktons)
Table 26 ECH APPLICATIONS & THEIR USES
Table 27 Others: ECH Market Consumption, By Geography, 2010 – 2017 (Ktons)
Table 28 Others: Epichlorohydrin Consumption, By Geography, 2010 – 2017 ($Million)
Table 29 ECH Market Consumption, By Geography, 2010 – 2017 (Ktons)
Table 30 ECH Market Revenue, By Geography, 2010 – 2017 ($Million)
Table 31 Asia-Pacific: Epichlorohydrin Market Consumption, By Countries, 2010 – 2017 (Ktons)
Table 32 Asia-Pacific: ECH Market Revenue, By Countries, 2010 – 2017 ($Million)
Table 33 Asia-Pacific: Epichlorohydrin Market Consumption, By Applications, 2010 – 2017 (Ktons)
Table 34 Asia-Pacific: ECH Market Revenue, By Applications, 2010 – 2017 ($Million)
Table 35 Asia-Pacific: Epichlorohydrin Market Consumption Through Epoxy Resins, By End Uses, 2010 – 2017 (Ktons)
Table 36 Asia-Pacific: Epichlorohydrin Market Revenue, Through Epoxy Resins, By End Uses, 2010 – 2017 ($Million)
Table 37 Asia-Pacific: ECH Imports Volume, By Countries, 2008 – 2011 (Ktons)
Table 38 Asia-Pacific: Epichlorohydrin Imports Revenue, By Countries, 2008 – 2011 ($Million)
Table 39 Asia-Pacific: Epichlorohydrin Exports Volume, By Countries, 2008 – 2011 (Ktons)
Table 40 Asia-Pacific: Epichlorohydrin Exports Revenue, By Countries, 2008 – 2011 ($Million)
Table 41 ECH Producers In China, 2012 (Ktons/Yr)
Table 42 China: ECH Market Consumption, By Applications, 2010 – 2017 (Ktons)
Table 43 China: ECH Market Revenue, By Applications, 2010 – 2017 ($Million)
Table 44 Taiwan: Epichlorohydrin Market Consumption, By Applications, 2010 – 2017 (Ktons)
Table 45 Taiwan: ECH Market Revenue, By Applications, 2010 – 2017 ($Million)
Table 46 Americas: Epichlorohydrin Market Consumption, By Countries, 2010 – 2017 (Ktons)
Table 47 Americas: ECH Market Revenue, By Countries, 2010 – 2017 ($Million)
Table 48 Americas: ECH Market Consumption, By Applications, 2010 – 2017 (Ktons)
Table 49 Americas: Epichlorohydrin Market Revenue, By Applications, 2010 – 2017 ($Million)
Table 50 Americas: Ech Market Consumption Through Epoxy Resins, By End Uses, 2010 – 2017 (Ktons)
Table 51 Americas: Ech Market Consumption Through Epoxy Resins, By End Uses, 2010 – 2017 ($Million)
Table 52 Americas: Epichlorohydrin Imports Volume, By Countries, 2008 – 2011 (Ktons)
Table 53 Americas: Epichlorohydrin Imports Revenue, By Country, 2008 – 2011 ($Million)
Table 54 U.S: ECH Market Consumption, By Applications, 2010 – 2017 (Ktons)
Table 55 U.S: Epichlorohydrin Market Revenue, By Applications, 2010 – 2017 ($Million)
Table 56 Europe: Epichlorohydrin Market Consumption, By Countries, 2010 – 2017 (Ktons)
Table 57 Europe: ECH Market Revenue, By Countries, 2010 – 2017 ($Million)
Table 58 Europe: Epichlorohydrin Market Consumption, By Applications, 2010 – 2017 (Ktons)
Table 59 Europe: ECH Market Revenue, By Applications, 2010 – 2017 ($Million)
Table 60 Europe: Epichlorohydrin Market Consumption Through Epoxy Resins, By End Uses, 2010 – 2017 (Ktons)
Table 61 Europe: ECH Market Consumption Through Epoxy Resins, By End Uses, 2010 – 2017 ($Million)
Table 62 Western Europe: Epichlorohydrin Imports Volume, By Countries, 2007 – 2010 (Ktons)
Table 63 Western Europe: Epichlorohydrin Imports Revenue, By Countries, 2007 – 2010 ($Million)
Table 64 Western Europe: ECH Exports Volume, By Countries, 2007 – 2010 (Ktons)
Table 65 Western Europe: Epichlorohydrin Exports Revenue, By Countries, 2007 – 2010 ($Million)
Table 66 Eastern Europe: ECH Imports Volume, By Countries, 2007 – 2010 (Ktons)
Table 67 Eastern Europe: Epichlorohydrin Imports Revenue, By Countries, 2007 – 2010 ($Million)
Table 68 Eastern Europe: Epichlorohydrin Exports, By Countries, 2007 – 2010 (Ktons)
Table 69 Eastern Europe: ECH Exports Revenue, By Countries, 2007 – 2010 ($Million)
Table 70 Germany: Epichlorohydrin Market Consumption, By Applications, 2010 – 2017 (Ktons)
Table 71 Germany: Epichlorohydrin Market Revenue, By Applications, 2010 – 2017 ($Million)
Table 72 Expansion At New Locations, 2009 – 2012
Table 73 Expansion At Current Location, 2010 – 2012
Table 74 Change In Technology, 2011
Table 75 Mergers & Acquisitions, 2012
Table 76 Aditya Birla Chemicals: PRODUCT & ITS APPLICATIONS
Table 77 Daisco: Epichlorohydrin Production Facilities & Capacity
Table 78 Daiso: TOTAL REVENUE, BY BUSINESS SEGMENTS, 2011 – 2012 ($Million)
Table 79 Daiso: Product & ITS APPLICATIONS
Table 80 FORMOSA PLASTIC: Ech Sales REVENUE & Volume, 2009 – 2010
Table 81 Product & Its Applications
Table 82 Hanwha Chemical: Product & Its Applications
Table 83 Jiangsu Yangnong: Product & Its Applications
Table 84 KASHIMA CHEMICAL: Product & Its Application
Table 85 Momentive: Total Revenue, By Business Segments, 2010 – 2011 ($Million)
Table 86 Momentive: Product & Its Applications
Table 87 NAMA CHEMICALS: PRODUCT & ITS APPLICATIONS
Table 88 Samsung Fine Chemicals: Total Revenue, By Business Segments 2010 – 2011 ($Million)
Table 89 Samsung Fine Chemicals: Product & Its Applications
Table 90 Shandong Haili Chemical: Product & Its Applications
Table 91 Solvay: Epichloride Production Facilities
Table 92 SOLVAY: PRODUCT & ITS APPLICATIONS
Table 93 SPOLCHEMIE: TOTAL REVENUE, BY BUSINESS SEGMENTS, 2010 – 2011 ($Million)
Table 94 SPOLCHEMIE: Product & Its Applications
Table 95 Sumitomo: TOTAL REVENUE, BY BUSINESS SEGMENTS, 2011 – 2012 ($Million)
Table 96 Tamilnadu Petroproducts: Epichlorohydrin Plant Capacity & Production
Table 97 Tamilnadu Petroproducts: Total Revenue, By Types, 2011 – 2012
Table 98 Tamilnadu Petroproducts: Product & Its Applications
Table 99 The Dow Chemical Company: Total Revenue, By Business Segments, 2010 – 2011 ($Million)
Table 100 The Dow Chemical Company: Product & Its Applications
Table 101 Zachem: ECH Sales Revenue & Volume, 2009 – 2011
Table 102 Zachem: Products & Its Applications
List Of Figures (22 Figures)
Figure 1 Epichlorohydrin (ECH) Market Consumption, By Applications, Feedstocks & Geography – 2012
Figure 2 Value Chain Analysis
Figure 3 Impact Analysis Of Major Drivers On Global Epichlorohydrin Market
Figure 4 Impact Analysis Of Restraints On Global Epichlorohydrin Market
Figure 5 Porter’s Five Forces Analysis
Figure 6 Published Patents Market Share, By Country/Region, 2005 – 2012
Figure 7 Epichlorohydrin Production Process
Figure 8 Europe: Epichlorohydrin Consumption For Synthetic Glycerin, 2010 – 2017 (Ktons)
Figure 9 Europe: Epichlorohydrin Market Revenue For Synthetic Glycerin, 2010 – 2017 ($Million)
Figure 10 ECH Consumption Share, By Geography, 2011
Figure 11 U.S. Export Of Epichlorohydrin, 2008 – 2011 (Ktons)
Figure 12 U.S. Export Of Epichlorohydrin, 2008 – 2011 ($Million)
Figure 13 Europe: Epichlorohydrin Market Consumption Share, By Countries, 2011
Figure 14 Global Epichlorohydrin Market Share, By Companies, 2012
Figure 15 Propylene-Based Epichlorohydrin : Market Share Analysis, By Companies, 2012
Figure 16 Existing & Planned: Epichlorohydrin Production Using Glycerin, By Companies
Figure 17 Global Epoxy Resin Market Share, By Companies, 2011
Figure 18 Strategic Development, 2009 – 2012
Figure 19 Major Growth Strategies In The Global Epichlorohydrin Market, 2009 – 2012
Figure 20 Developments In The Global Epichlorohydrin Market, 2009 – 2012
Figure 21 Epichlorohydrin Market Growth Strategies, By Geography, 2009 – 2012
Figure 22 Zachem: Epichlorohydrin Sales, By Geography, 2011


Growth opportunities and latent adjacency in Epichlorohydrin (ECH) Market