The study involved four major activities for estimating the current size of the global epoxidized soybean oil market. Exhaustive secondary research was carried out to collect information on the market, the peer product market, and the parent product group market. The next step was to validate these findings, assumptions, and sizes with the industry experts across the value chain of epoxidized soybean oil through primary research. Both the top-down and bottom-up approaches were employed to estimate the overall size of the epoxidized soybean oil market. After that, market breakdown and data triangulation procedures were used to determine the size of different segments and sub-segments of the market.
Secondary Research
In the secondary research process, various secondary sources such as Hoovers, Factiva, Bloomberg BusinessWeek, and Dun & Bradstreet were referred to, to identify and collect information for this study on the epoxidized soybean oil market. These secondary sources included annual reports, press releases & investor presentations of companies; white papers; certified publications; articles by recognized authors; regulatory bodies, trade directories, and databases.
Primary Research
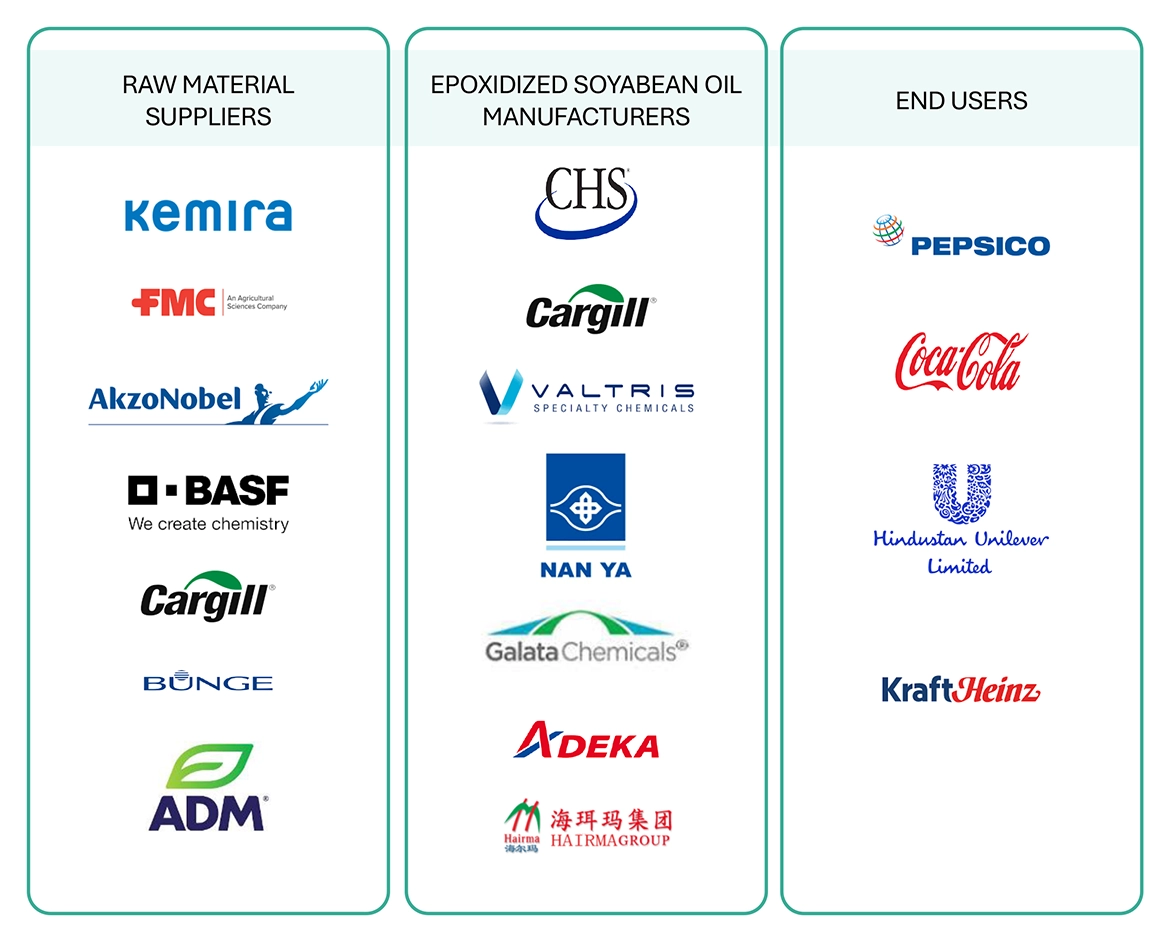
The epoxidized soybean oil market comprises several stakeholders in the supply chain, which include raw material suppliers, processors, end-product manufacturers, buyers, and regulatory organizations. Various primary sources from the supply and demand sides of the markets have been interviewed to obtain qualitative and quantitative information. The primary participants from the demand side include key opinion leaders, executives, vice presidents, and CEOs of companies in the epoxidized soybean oil market. Primary sources from the supply side include associations and institutions involved in the epoxidized soybean oil industry, key opinion leaders, and processing players.
Following is the breakdown of primary respondents

Notes: Other designations include product, sales, and marketing managers.
Tiers of the companies are classified based on their annual revenues as of 2022: Tier 1 = >USD 5 Billion, Tier 2 = USD 1 Billion to USD 5 Billion, and Tier 3= <USD 1 Billion.
To know about the assumptions considered for the study, download the pdf brochure
Market Size Estimation
Both the top-down and bottom-up approaches were used to estimate and validate the size of the global epoxidized soybean oil market. These approaches were also used extensively to estimate the size of various segments of the market. The research methodology used to estimate the market size included the following details:
-
The key players in the industry were identified through extensive secondary research.
-
The supply chain of the industry and market size, in terms of value and volume, were determined through primary and secondary research.
-
All percentage share splits and breakdowns were determined using secondary sources and verified through primary sources.
-
All possible parameters that affect the markets covered in this research study were accounted for, viewed in extensive detail, verified through primary research, and analyzed to obtain the final quantitative and qualitative data.
-
The research includes the study of reports, reviews, and newsletters of key industry players, along with extensive interviews with key officials, such as directors and marketing executives.

To know about the assumptions considered for the study, Request for Free Sample Report

Data Triangulation
After arriving at the overall market size from the estimation process explained above, the total market was split into several segments and sub-segments. The data triangulation and market breakdown procedures were employed, wherever applicable, to complete the overall market engineering process and arrive at the exact statistics for all the segments and sub-segments of the epoxidized soybean oil market. The data was triangulated by studying various factors and trends from both the demand- and supply-side.
In addition, the market size was validated by using both the top-down and bottom-up approaches. Then, it was verified through primary interviews. Hence, for every data segment, there are three sources—top-down approach, bottom-up approach, and expert interviews. The data were assumed to be correct when the values arrived at from the three sources matched.
Market Definition
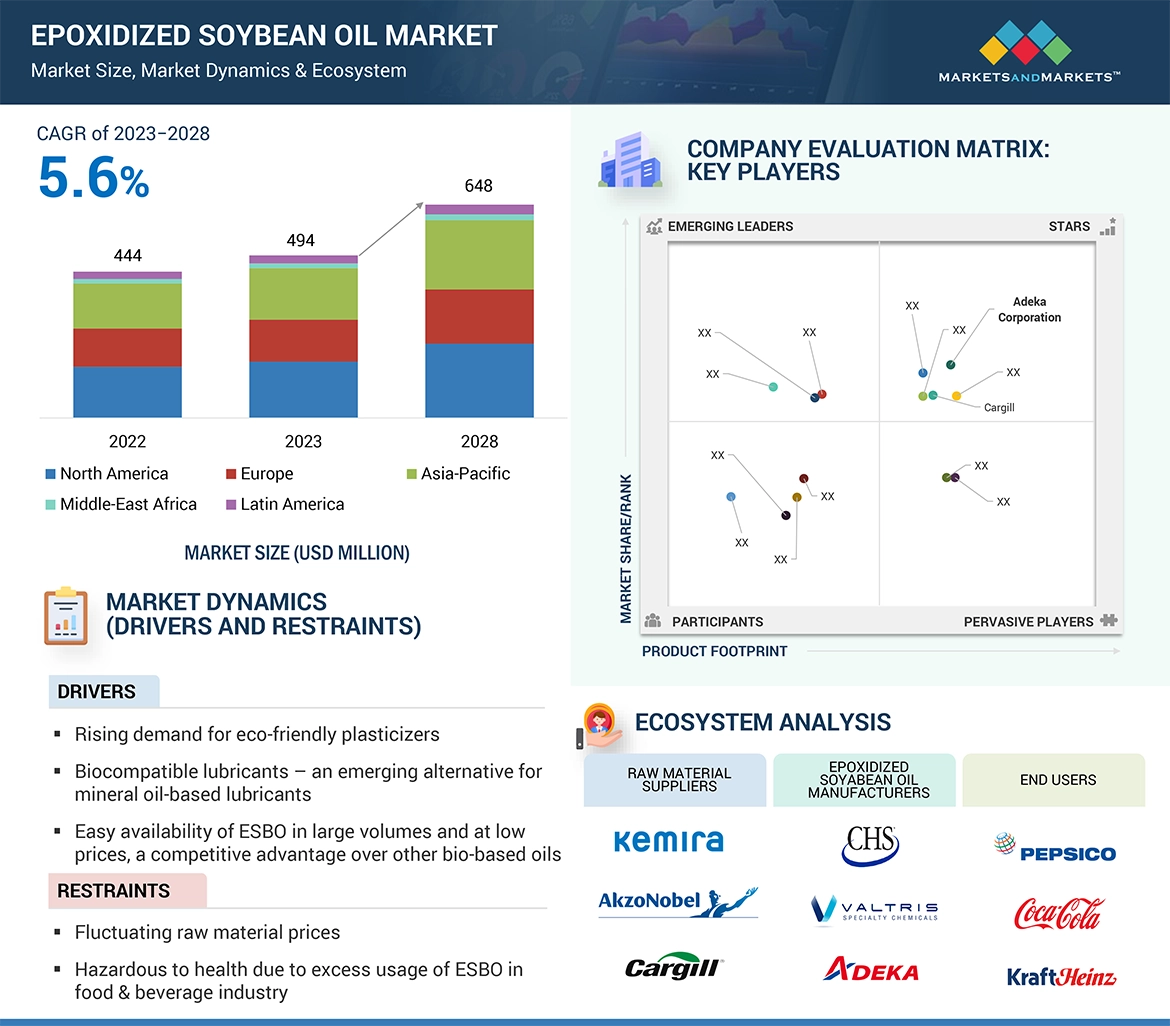
Epoxidized Soybean Oil (ESBO), also known as ESBO or ESO, is a group of organic compounds derived from the epoxidation process of soybean oil. This yellow, viscous fluid serves a dual purpose as a plasticizer and stabilizer in the manufacture of Polyvinyl Chloride (PVC) plastics. The primary purpose of ESBO in PVC compounds and other plastic materials is to enhance and maintain their softness and flexibility. The production of ESBO involves the epoxidation of soybean oil, a process where hydrogen peroxide is used as an oxygen donor, and formic acid or acetic acid is used as a catalyst. This chemical transformation results in a versatile and eco-friendly product that finds widespread use in the plastics industry.
Beyond its role as a plasticizer and stabilizer, ESBO finds alternative uses as a pigment dissipating agent, an acid/mercaptan scavenging agent, and an epoxy reactive diluent. These diverse applications demonstrate the versatility of ESBO in enhancing different characteristics of plastic compounds.
One of the distinctive advantages of epoxidized soybean oil is its cost-effectiveness and biodegradability in comparison to conventional phthalate plasticizers. This has led to a preference for ESBO over dioctyl phthalate in specific applications, highlighting its significance as a sustainable and environmentally conscious choice in the area of plastic materials. The synthesis and application of ESBO highlight its crucial role in promoting both functional and ecological aspects of plastic formulation.
Micromarkets are defined as the segments and subsegments of the epoxidized soybean oil market included in the report.
Key Stakeholders
-
Component manufacturer and suppliers
-
Environmental associations
-
Consulting companies in the epoxidized soybean oil industry
-
Epoxidized soybean oil manufacturers
-
Traders and distributors of epoxidized soybean oil
-
NGOs, governments, research organizations, investment banks, venture capitalists, and private equity firms
Report Objectives
-
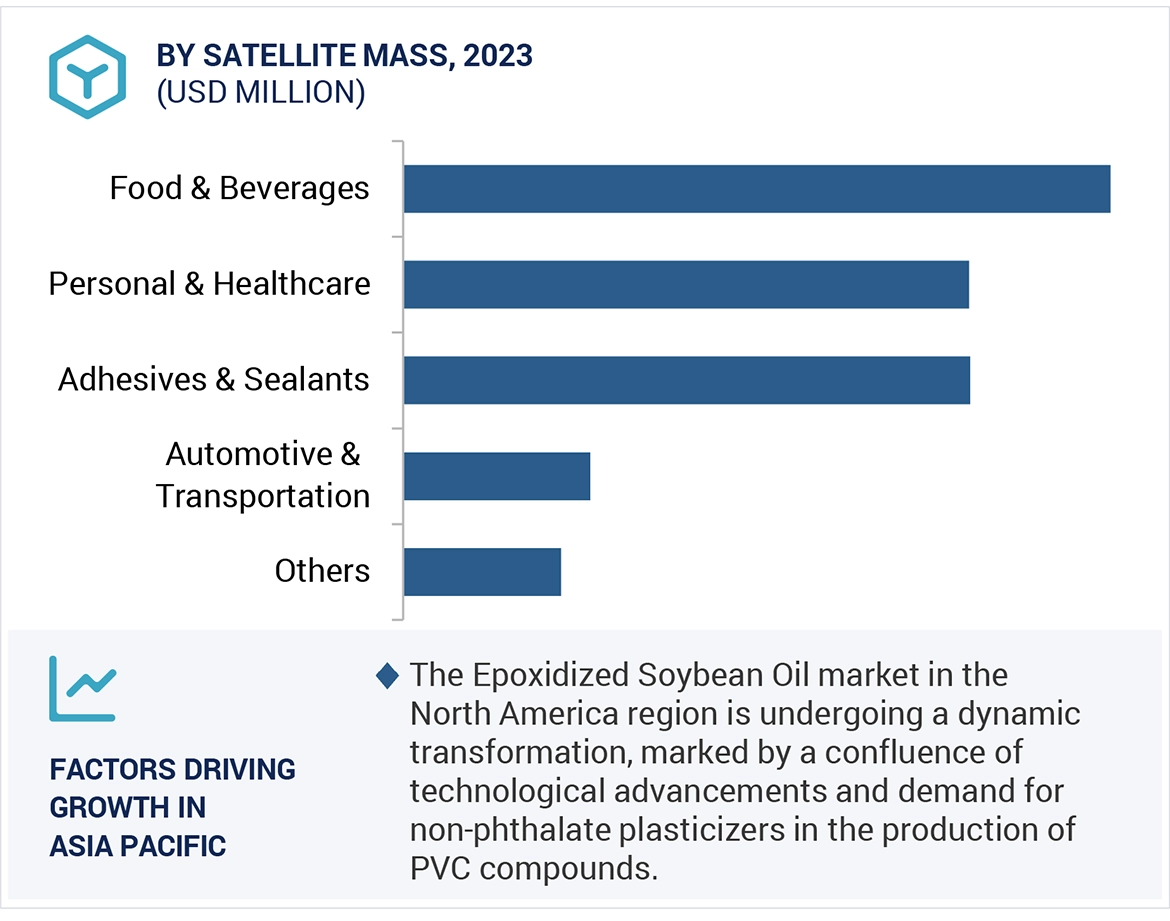
To define, analyze, and project the size of the epoxidized soybean oil market in terms of value based on raw material, application, End-use Industry, and Region.
-
To project the size of the market and its segments with respect to the five main regions, namely, North America, Europe, Asia Pacific, Middle East & Africa, and South America
-
To provide detailed information about the key factors, such as drivers, restraints, opportunities, and challenges, influencing the growth of the market
-
To analyze the opportunities in the market for stakeholders and provide a detailed competitive landscape of the market leaders.
-
To analyze the competitive developments, such as new product launches, expansions, and acquisitions, in the epoxidized soybean oil market
-
To strategically profile the key players operating in the market and comprehensively analyze their market shares and core competencies.
Available Customizations
Along with the given market data, MarketsandMarkets offers customizations as per the specific needs of the companies. The following customization options are available for the report:
Product Analysis:
-
Product Matrix which gives a detailed comparison of the product portfolio of each company
Regional Analysis:
-
Further breakdown of the Rest of Asia Pacific market
-
Further breakdown of Rest of Europe market
Company Information:
-
Detailed analysis and profiling of additional market players (up to 5)


praveen
Jun, 2021
Process for sharing report.
Chanakya
Nov, 2017
Information on Food Grade Label Glue market.