Acidity Regulators Market By Type (Acetic Acid, Citric Acid, Lactic Acid, Malic Acid, Phosphoric Acid), Application (Beverages, Sauces, Dressings & Condiments, Processed Foods, Bakery & Confectionery) & Geography - Global Trends & Forecasts to 2018


Food acidity regulators form an integral part of the global food additives industry as these provide an acidic medium, and flavor to food and beverage items. These regulate the acidity of the food and help to increase shelf life. These also prevent the microbial activity and play a major role in food preservation. This research report provides a comprehensive analysis of the global market, which is witnessing steady growth in diverse applications such as beverages, confectionary items, bakery items, processed foods, sauces, dressings, condiments, and so on. Food acidity regulators such as acetic acid, citric acid, lactic acid, malic acid, and phosphoric acid have preservative, stabilizing, antimicrobial, and pH-regulating properties that increase the shelf life of food and beverages. The advent of many such versatile functions has escalated its use in application-specific ingredients and new end-use products. The market has been analyzed in terms of value and volume at a regional and country level. The changing trends in the consumption of food acidity regulators reflect the increased product penetration and purchasing power of the global population in the emerging economies, as well as shift towards exotic and novel flavors in the developed nations.
This report also shows an overview of key players in food acidity regulators business across the globe. The regions covered include North America (U.S., Canada, Mexico), Europe (U.K., Germany, France, Italy, Spain), Asia-Pacific (China, Japan, India), and Rest of the World (Brazil, South Africa). The growth strategies of market players have been identified and analyzed. The manufacturers are aware of the emerging Asian and Latin American markets as potential drivers of the food acidity regulators business. The market is expected to continue witness growth in both, developed and developing regions. The growth is also attributed to growing demand for healthy food products with high nutritional value, and major increase in trading activities due to globalization. Citric acid's domination in the food acidity regulators market is because of its key application in the beverages industry, which has also witnessed growth on account of introduction of energy drinks and exotic fruit-flavored blends across the globe. Almost all of the phosphoric acid consumed in the food additives industry goes into soft drinks. Lactic acid has seen its share grow in the global market due to its application in the manufacture of sauces, dressings and condiments, the growth of which is attributed to evolving palates of a globalized consumer population. The multi-functional properties offered by malic acid have ensued in its emergence as a fast-growing segment. It has seen growing applications in the beverages and bakery confectionary sub-segments because of its prolonged sourness and taste-masking functions.
Global food acidity regulators market is expected to reach $5.2 billion by 2018 growing at a CAGR of 7.7%. Asia-Pacific is expected to lead the market, followed by North America and Europe. Asia-Pacific is the fastest growing market followed by RoW.
China is one of the largest players in food acidulant business followed by U.S. This is because of excessive demand for processed food products. In terms of beverage applications of acidity regulators, although the soft drinks industry in the U.S. has seen meager growth, the increasing share of bottled water and fruit beverages has driven the market forward in the country. In Europe, Germany is one of the largest markets due to its increased consumption of processed foods. The ROW market is driven by Latin America as the potential for market growth in this region is immense. The developing countries in Asia-Pacific and ROW have witnessed a surge in the middle class population's income levels; that coupled with growing need for convenience foods for the working class has triggered an upward trend in food acidity regulators consumption in these regions.
Scope of the report
This report focuses on global market. This research categorizes the global food acidity regulators market based on types, applications, and geography:
Based on geography:
- North America
- Europe
- Asia-Pacific
- ROW
Based on types:
- Acetic acid
- Citric acid
- Lactic acid
- Malic acid
- Phosphoric acid
- Others
Based on applications:
- Beverages
- Sauces, dressings, and condiments
- Processed foods
- Bakery and confectionary
- Others
Acidity regulators are an important and integral part of food additive industry. These regulate the acidity and provide sourness or tartness to the finished food item. Organic acidity regulators such as citric, malic, and acetic acid are usually added to food and beverage products, but few inorganic acids such as phosphoric acid are also used in the manufacturing of soft drinks. The role and function vary from product to product. As an example, citric acid is used in many food products to add flavor and in other food products to regulate the acidity of the product. The salts of acidity regulators increase the resistance of food products to the change in pH. These are generally used to control pH during processing in order to preserve flavor, color, and texture of the product. It is also act as gelling agent and texture modifier.
Global Acidity Regulators Market Revenue Volume, 2011 - 2018
Source: Expert Interviews, MarketsandMarkets Analysis
In 2011, global market was at 2,610.4 KMT, valued at $3,132.5 million. Increased focus on health nutrition and food safety, introduction of value-added products, increasing demand for processed foods, and introduction of modern technology are key drivers for market. Citric acid leads consumption of global market, followed by phosphoric acid. There is a huge demand for citric acid worldwide because of its low toxicity as compared with other. New and increasing number of applications creates market opportunity for growth.
Food Acidity Regulators Market Share, By Geography, 2012 ($Million)
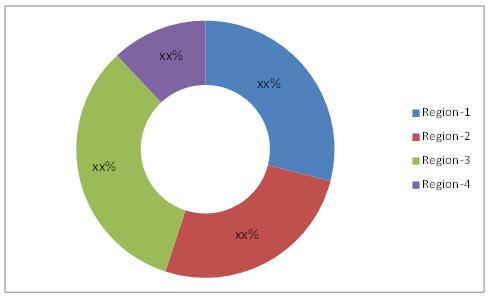
Source: MarketsandMarkets Analysis
Asia-Pacific holds the largest revenue market share, followed by North America. Followed by Asia-Pacific, ROW market is expected to witness second highest growth from 2013 to 2018. Asia-Pacific market is mainly driven by the Chinese market, especially in case of citric acid.
Citric acid alone contributes half of the market. More than 60% of citric acid is consumed by food and beverage industry. Phosphoric acid is the second laresgt market due to its large applications in beverage industry. Beverages receive the largest share followed by sauces, dressings, and condiments. Acidity regulators in processed foods is the fastest growing application market.
Companies like Tate & Lyle, Cargill, Univar are exhibiting steady developments in market due to the increasing demand from food and beverages industry. Introduction of value added products, healthier eating habits are some of the influencing factors for the growing market.
 Exclusive indicates content/data unique to MarketsandMarkets and not available with any competitors.
Table Of Contents
1 Introduction (Page No. - 19)
1.1 Key Take-Aways
1.2 Report Description
1.3 Stakeholders
1.4 Research Methodology
1.4.1 Markets Covered
1.4.2 Market Size
1.4.3 Secondary Sources
1.4.4 Assumptions Made For This Report
1.4.5 Key Data Points Validated From Primary & Secondary Sources
1.4.6 Key Questions Answered
2 Executive Summary (Page No. - 25)
3 Premium Insights (Page No. - 28)
3.1 Market Segmentation
3.2 Market Size, By Geography
3.3 Global Market Size, By Types
3.4 Acetic Acid Market Size, By Geography
3.5 Citric Acid Market Size, By Geography
3.6 Lactic Acid Market Size, By Geography
3.7 Malic Acid Market Size, By Geography
3.8 Phosphoric Acid Market Size, By Geography
3.9 Market, By Geography
3.10 Global Market Size, By Applications
3.11 Application Market Size, By Geography
3.12 Manufacturers & Their Product Matrix
3.13 Benchmarking Key Players By Developments
4 Market Overview (Page No. - 51)
4.1 Introduction
4.2 Burning Issue
4.2.1 Instances Of Anti-Dumping By China
4.3 Winning Imperative
4.3.1 Expansions & Investments
4.4 Impact Analysis
4.5 Market Dynamics
4.5.1 Drivers
4.5.1.1 Increased Focus On Health, Nutrition, And Food Safety
4.5.1.2 Emergence Of Value Added Products
4.5.1.3 Increasing Consumer Demand For Food & Beverages And Processed Foods
4.5.1.4 Shift Towards Sauces, Dressings, And Condiments Market
4.5.1.5 Influx Of Modern Technology
4.5.2 Restraints
4.5.2.1 Controversies Related To Its Ill-Effect On Health
4.5.2.2 Low-Cost Suppliers Flooding The Market
4.5.3 Opportunity
4.5.3.1 New Product Applications
4.6 Porter�s Five Forces Analysis
4.6.1 Degree Of Competition
4.6.2 Bargaining Power Of Suppliers
4.6.3 Bargaining Power Of Buyers
4.6.4 Threat Of Substitutes
4.6.5 Threat Of New Entrants
4.7 Patent Analysis
4.7.1 By Region
4.7.2 By Year
4.7.3 By Companies
5 By Types (Page No. - 67)
5.1 Introduction
5.2 Acetic Acid
5.3 Citric Acid
5.4 Lactic Acid
5.5 Malic Acid
5.6 Phosphoric Acid
5.7 Others
5.8 North America (U.S., Canada & Mexico)
5.9 Europe (U.K., Germany, France, Italy & Spain)
5.10 Apac (China, Japan & India)
5.11 Row (Brazil & South Africa)
6 By Applications (Page No. - 118)
6.1 Introduction
6.2 Beverages
6.3 Sauces, Dressings & Condiments
6.4 Processed Food
6.5 Bakery & Confectionery
6.6 Others
6.7 North America (U.S., Canada & Mexico)
6.8 Europe (U.K., Germany, France, Italy & Spain)
6.9 Apac (China, Japan & India)
6.10 Row (Brazil & South Africa)
7 By Geography (Page No. - 170)
7.1 Introduction
7.2 North America (U.S., Canada & Mexico)
7.3 Europe (U.K., Germany, France, Italy & Spain)
7.4 Apac (China, Japan & India)
7.5 Row (Brazil & South Africa)
8 Competitive Landscape (Page No. - 184)
8.1 Introduction
8.2 Expansions & Investments - Most Preferred Strategic Approach
8.3 Mergers & Acquisitions
8.4 Agreements, Partnerships, Collaborations & Joint Ventures
8.5 New Products Launch/Developments
8.6 Expansions & Investments
9 Company Profiles (Overview, Financials, Products & Services, Strategy, And Developments)* (Page No. - 192)
9.1 American Tartaric Products Inc.
9.2 Archer Daniels Midland Co.
9.3 Bartek Ingredients Inc.
9.4 Brenntag Pacific Inc.
9.5 Caremoli S.P.A.
9.6 Cargill Incorporated
9.7 Celrich Products
9.8 Chemelco International B.V.
9.9 Fbc Industries Inc.
9.10 Fuerst Day Lawson Ltd
9.11 Foodchem International Corporation
9.12 Fosfa Chemicals
9.13 Gremount International Co. Ltd
9.14 Gehring-Montgomery Inc.
9.15 Hawkins Watts Ltd
9.16 H Plus Ltd
9.17 Isegen South Africa (Pty) Ltd
9.18 Jungbunzlauer Ag
9.19 Jones Hamilton Co.
9.20 Merko Group Llc
9.21 Niche Trading N.V.
9.22 Prinova Group L.L.C
9.23 Purac Biochem B.V.
9.24 Parry Enterprises India Ltd
9.25 Tate & Lyle Plc
9.26 Univar Canada Ltd
9.27 Weifang Ensign Industry Co. Ltd
*Details On Overview, Financials, Product & Services, Strategy, And Developments Might Not Be Captured In Case Of Unlisted Companies.
Appendix (Page No. - 253)
U.S. Patents
Europe Patents
Japan Patents
List Of Tables (127 Tables)
Table 1 Global Acidity Regulators Market Revenue ($Million) & Volume, 2011 � 2018 (�000 Mt)
Table 2 Global Market Revenue, By Types, 2011 � 2018 ($Million)
Table 3 Global Market Volume, By Types, 2011 � 2018 ('000 Mt)
Table 4 Citric Acids: Its Forms, Functions, & Dosage Levels
Table 5 North America: Acidity Regulators Market Revenue, By Types, 2011 � 2018 ($Million)
Table 6 North America: Market Volume, By Types, 2011 � 2018 ('000 Mt)
Table 7 U.S: Acidity Regulators Market Revenue, By Types, 2011 � 2018 ($Million)
Table 8 U.S: Market Volume, By Types, 2011 � 2018 ('000 Mt) 80
Table 9 Canada: Acidity Regulators Market Revenue, By Types,2011 � 2018 ($Million)
Table 10 Canada: Market Volume, By Types, 2011 � 2018 ('000 Mt)
Table 11 Mexico: Acidity Regulators Market Revenue, By Types, 2011 � 2018 ($Million)
Table 12 Mexico: Market Volume, By Types, 2011 � 2018 ('000 Mt)
Table 13 Europe: Acidity Regulators Market Revenue, By Types, 2011 � 2018 ($Million)
Table 14 Europe: Market Volume, By Types, 2011 � 2018 ('000 Mt)
Table 15 U.K: Acidity Regulators Market Revenue, By Types,2011 � 2018 ($Million)
Table 16 U.K: Market Volume, By Types, 2011 � 2018 ('000 Mt)
Table 17 Germany: Acidity Regulators Market Revenue, By Types, 2011 � 2018 ($Million)
Table 18 Germany: Market Volume, By Types, 2011 � 2018 ('000 Mt)
Table 19 France: Acidity Regulators Market Revenue, By Types, 2011 � 2018 ($Million)
Table 20 France: Market Volume, By Types, 2011 � 2018 ('000 Mt)
Table 21 Italy: Acidity Regulators Market Revenue, By Types, 2011 � 2018 ($Million)
Table 22 Italy: Market Volume, By Types, 2011 � 2018 ('000 Mt)
Table 23 Spain: Acidity Regulators Market Revenue, By Types, 2011 � 2018 ($Million)
Table 24 Spain: Market Volume, By Types, 2011 � 2018 ('000 Mt)
Table 25 Rest Of Europe: Acidity Regulators Market Revenue, By Types, 2011 � 2018 ($Million)
Table 26 Rest Of Europe: Market Volume, By Types, 2011 � 2018 ('000 Mt)
Table 27 Apac: Acidity Regulators Market Revenue, By Types, 2011 � 2018 ($Million)
Table 28 Apac: Market Volume, By Types, 2011 � 2018 ('000 Mt)
Table 29 China: Acidity Regulators Market Revenue, By Types, 2011 � 2018 ($Million)
Table 30 China: Market Volume, By Types, 2011 � 2018 ('000 Mt)
Table 31 Japan: Acidity Regulators Market Revenue, By Types, 2011 � 2018 ($Million)
Table 32 Japan: Market Volume, By Types, 2011 � 2018 ('000 Mt)
Table 33 India: Market Revenue, By Types, 2011 � 2018 ($Million)
Table 34 India: Market Volume, By Types, 2011 � 2018 ('000 Mt)
Table 35 Rest Of Apac: Market Revenue, By Types,2011 � 2018 ($Million)
Table 36 Rest Of Apac: Market Volume, By Types, 2011 � 2018 ('000 Mt)
Table 37 Row: Market Revenue, By Types, 2011 � 2018 ($Million)
Table 38 Row: Market Volume, By Types,2011 � 2018 ('000 Mt)
Table 39 Brazil: Acidity Regulators Market Revenue, By Types, 2011 � 2018 ($Million)
Table 40 Brazil: Market Volume, By Types, 2011 � 2018 ('000 Mt)
Table 41 South Africa: Acidity Regulators Market Revenue, By Types, 2011 � 2018 ($Million)
Table 42 South Africa: Market Volume, By Types, 2011 � 2018 ('000 Mt)
Table 43 Rest Of Row: Market Revenue, By Types, 2011 � 2018 ($Million)
Table 44 Rest Of Row: Market Volume, By Types, 2011 � 2018 ('000 Mt)
Table 45 Global Acidity Regulators Market Revenue, By Applications, 2011 � 2018 ($Million)
Table 46 Global Market Volume, By Applications,2011 � 2018 ('000 Mt)
Table 47 North America: Acidity Regulators Market Revenue, By Applications, 2011 � 2018 ($Million)
Table 48 North America: Market Volume, By Applications, 2011 � 2018 ('000 Mt)
Table 49 U.S: Acidity Regulators Market Revenue, By Applications, 2011 � 2018 ($Million)
Table 50 U.S: Market Volume, By Applications, 2011 � 2018 ('000 Mt)
Table 51 Canada: Market Revenue, By Applications, 2011 � 2018 ($Million)
Table 52 Canada: Market Volume, By Applications, 2011 � 2018 ('000 Mt)
Table 53 Mexico: Acidity Regulators Market Revenue, By Applications, 2011 � 2018 ($Million)
Table 54 Mexico: Market Volume, By Applications, 2011 � 2018 ('000 Mt)
Table 55 Europe: Acidity Regulators Market Revenue, By Applications, 2011 � 2018 ($Million)
Table 56 Europe: Market Volume, By Applications, 2011 � 2018 ('000 Mt)
Table 57 U.K: Acidity Regulators Market Revenue, By Applications, 2011 � 2018 ($Million)
Table 58 U.K: Market Volume, By Applications, 2011 � 2018 ('000 Mt)
Table 59 Germany: Market Revenue, By Applications, 2011 � 2018 ($Million)
Table 60 Germany: Market Volume, By Applications, 2011 � 2018 ('000 Mt)
Table 61 France: Market Revenue, By Applications, 2011 � 2018 ($Million)
Table 62 France: Market Volume By Applications, 2011 � 2018 ('000 Mt)
Table 63 Italy: Market Revenue, By Applications, 2011 � 2018 ($Million)
Table 64 Italy: Market Volume, By Applications, 2011 � 2018 ('000 Mt)
Table 65 Spain: Market Revenue, By Applications, 2011 � 2018 ($Million)
Table 66 Spain: Market Volume, By Applications, 2011 � 2018 ('000 Mt)
Table 67 Rest Of Europe: Market Revenue, By Applications, 2011 � 2018 ($Million)
Table 68 Rest Of Europe: Market Volume, By Applications, 2011 � 2018 ('000 Mt)
Table 69 Apac: Market Revenue, By Applications, 2011 � 2018 ($Million)
Table 70 Apac: Market Volume, By Applications, 2011 � 2018 ('000 Mt)
Table 71 China: Market Revenue, By Applications, 2011 � 2018 ($Million)
Table 72 China: Market Volume, By Applications, 2011 � 2018 ('000 Mt)
Table 73 Japan: Market Revenue, By Applications, 2011 � 2018 ($Million)
Table 74 Japan: Market Volume, By Applications, 2011 � 2018 ('000 Mt)
Table 75 India: Market Revenue, By Applications, 2011 � 2018 ($Million)
Table 76 India: Market Volume, By Applications, 2011 � 2018 ('000 Mt)
Table 77 Rest Of Apac: Acidity Regulators Market Revenue, By Applications, 2011 � 2018 ($Million)
Table 78 Rest Of Apac: Market Volume, By Applications, 2011 � 2018 ('000 Mt)
Table 79 Row: Market Revenue, By Applications, 2011 � 2018 ($Million)
Table 80 Row: Market Volume, By Applications, 2011 � 2018 ('000 Mt)
Table 81 Brazil: Market Revenue, By Applications, 2011 � 2018 ($Million)
Table 82 Brazil: Market Volume, By Applications, 2011 � 2018 ('000 Mt)
Table 83 South Africa: Market Revenue, By Applications, 2011 � 2018 ($Million)
Table 84 South Africa: Market Volume, By Applications, 2011 � 2018 ('000 Mt)
Table 85 Rest Of Row: Market Revenue, By Applications, 2011 � 2018 ($Million)
Table 86 Rest Of Row: Market Volume, By Applications, 2011 � 2018 ('000 Mt)
Table 87 Acidity Regulators Market Revenue, By Geography, 2011 � 2018 ($Million)
Table 88 Market Volume, By Geography, 2011 � 2018 ('000 Mt)
Table 89 North America: Acidity Regulators Market Revenue, By Countries, 2011 � 2018 ($Million)
Table 90 North America: Market Volume, By Countries, 2011 � 2018 (�000 Mt)
Table 91 Europe: Acidity Regulators Market Revenue, By Countries, 2011 � 2018 ($Million)
Table 92 Europe: Market Volume, By Countries, 2011 � 2018 (�000 Mt)
Table 93 Apac: Market Revenue, By Countries, 2011 � 2018 ($Million)
Table 94 Apac: Market Volume, By Countries, 2011 � 2018 (�000 Mt)
Table 95 Row: Market Revenue, By Countries, 2011 � 2018 ($Million)
Table 96 Row: Market Volume By Countries, 2011 � 2018 (�000 Mt)
Table 97 Mergers & Acquisitions, 2012
Table 98 Agreements, Partnerships, Collaborations & Joint Ventures, 2012
Table 99 New Products Launch/Developments, 2009 � 2013
Table 100 Expansions & Investments, 2008 � 2013
Table 101 Adm: Annual Revenue, By Business Segments, 2011 � 2012 ($Million)
Table 102 Adm: Annual Revenue, By Region/Countries, 2011 � 2012 ($Million)
Table 103 Adm: Products & Its Applications
Table 104 Bartek Ingredients: Products & Its Descriptions
Table 105 Brenntag: Products & Its Descriptions
Table 106 Cargill: Annual Revenue, By Region/Countries,2011 � 2012 ($Million)
Table 107 Cargill: Products & Its Uses/Applications
Table 108 Celrich: Products & Its Descriptions
Table 109 Chemelco: Products & Its Descriptions
Table 110 Foodchem: Products & Its Descriptions
Table 111 Fosfa Chemicals: Products & Its Descriptions
Table 112 Gremount: Products & Its Descriptions
Table 113 Gehring-Montgomery: Products & Its Descriptions
Table 114 Hawkins: Products & Its Applications
Table 115 Isegen: Products & Its Descriptions
Table 116 Jungbunzlauer: Products & Descriptions
Table 117 Jones Hamilton: Products & Its Descriptions
Table 118 Merko Group: Products & Its Descriptions
Table 119 Niche Trading: Products & Its Applications/Descriptions
Table 120 Purac Biochem: Products & Its Applications/Descriptions
Table 121 Parry Enterprises: Products & Its Descriptions
Table 122 Tate & Lyle: Annual Revenue, By Business Segments,2011 � 2012 ($Million)
Table 123 Tate & Lyle: Annual Revenue, Through Bulk Ingredients Sale, 2011 � 2012 ($Million)
Table 124 Tate & Lyle: Annual Revenue, By Region/Countries,2011 � 2012 ($Million)
Table 125 Tate & Lyle: Products & Its Descriptions
Table 126 Univar Canada: Products & Its Descriptions
Table 127 Weifang Ensign: Products & Its Descriptions
List Of Figures (32 Figures)
Figure 1 Acidity Regulators Market Share, By Geography, 2012 ($Million)
Figure 2 Market Consumption Share, By Geography, 2012 (�000 Mt)
Figure 3 Market Segmentation
Figure 4 Market Size, By Geography, 2012 � 2018 ($Million)
Figure 5 Market Size, By Geography, 2012 � 2018 (Kmt)
Figure 6 Global Market Size, By Types, 2012 � 2018 ($Million)
Figure 7 Global Market Size, By Types, 2012 � 2018 (Kmt)
Figure 8 Acetic Acid Market Size, By Geography, 2012 � 2018 ($Million)
Figure 9 Acetic Acid Market Size, By Geography, 2012 � 2018 (Kmt)
Figure 10 Citric Acid Market Size, By Geography, 2012 � 2018 ($Million)
Figure 11 Citric Acid Market Size, By Geography, 2012 � 2018 (Kmt)
Figure 12 Lactic Acid Market Size, By Geography, 2012 � 2018 ($Million)
Figure 13 Lactic Acid Market Size, By Geography, 2012 � 2018 (Kmt)
Figure 14 Malic Acid Market Size, By Geography, 2012 � 2018 ($Million)
Figure 15 Malic Acid Market Size, By Geography, 2012 � 2018 (Kmt)
Figure 16 Phosphoric Acid Market Size, By Geography, 2012 � 2018 ($Million)
Figure 17 Phosphoric Acid Market Size, By Geography, 2012 � 2018 (Kmt)
Figure 18 Acidity Regulators Market, By Geography, 2012 � 2018 (Kmt)
Figure 19 Global Acidity Regulators Market Size, By Applications, 2012 � 2018 ($Million)
Figure 20 Global Market Size, By Applications, 2012 � 2018 (Kmt)
Figure 21 Application Market Size, By Geography, 2012 � 2018 ($Million)
Figure 22 Manufacturers & Their Product Matrix
Figure 23 Benchmarking Key Players By Developments
Figure 24 Market Segmentation
Figure 25 Impact Analysis Of Drivers, Restraints & Opportunities
Figure 26 Porter�s Five Forces Analysis
Figure 27 Patent Analysis, By Regions/Countries, 2010 � 2013
Figure 28 Number Of Patents, By Regions/Countries, 2010 � 2013
Figure 29 Patent Analysis, By Companies, 2010 � 2013
Figure 30 Global Market Share, By Growth Strategies, 2008 � 2013
Figure 31 Developments In Global Acidity Regulators Market, By Growth Strategies, 2008 � 2013
Figure 32 Global Market Growth Strategies,By Companies, 2008 � 2013


Growth opportunities and latent adjacency in Acidity Regulators Market