Future of EV Batteries Market by Type (Li-ion, Na-ion, Solid state, Li- Air), Vehicle Type (Passenger Cars, Commercial Vehicles, Off-Road Vehicles), Battery Form (Prismatic, Pouch, Cylindrical), Packaging (CTM, CTP, CTC, MTC) & Region - Global Forecast 2035
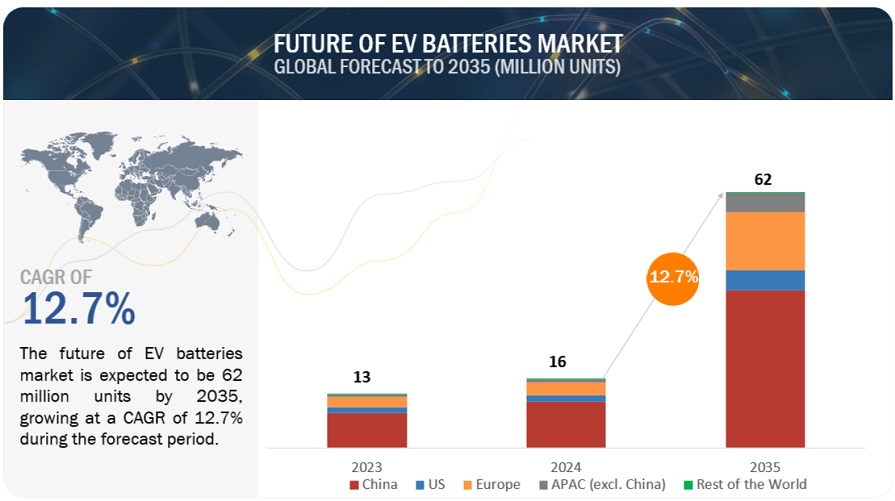
The global EV batteries market size was valued at 16 million units in 2024 and is expected to reach 62 million units by 2035, at a CAGR of 12.7%, during the forecast period 2024-2035. Changes in lithium-ion (Li-ion) battery chemistry are leading to more efficient electric vehicles (EVs) as the industry switches from toxic metals such as nickel-manganese-cobalt (NMC) to lithium-iron-phosphate (LFP). Companies like Tesla, Rivian, and Ford have already changed their standard models from NMC to LFP, while manufacturers like Hyundai, Nissan, and Toyota are developing cheaper LFP variants to make EVs more affordable. Further, research into solid electrolytes is progressing and promising significant advantages over traditional liquid electrolytes, including higher energy density, lighter construction, faster charging, extended range, and longer life cycles. In the past year, researchers have made significant progress in creating solid-state batteries that can charge in minutes and hold a charge for more than 6,000 cycles, using a variety of cheap metals and less lithium. In addition, developing sodium (Na-ion) batteries could provide the best option for shorter-range EVs and plug-in hybrid electric vehicles (PHEVs), as they replace lithium with much cheaper sodium, perform better at low temperatures, and allow for fast charging with a longer lifespan. Thus, the overall future of EV batteries is largely expected to witness newer, cleaner & cheaper battery chemistries and modular designs.
To know about the assumptions considered for the study, Request for Free Sample Report
To know about the assumptions considered for the study, download the pdf brochure
Future of Batteries Market Dynamics:
Driver: Technological advancements in EV battery
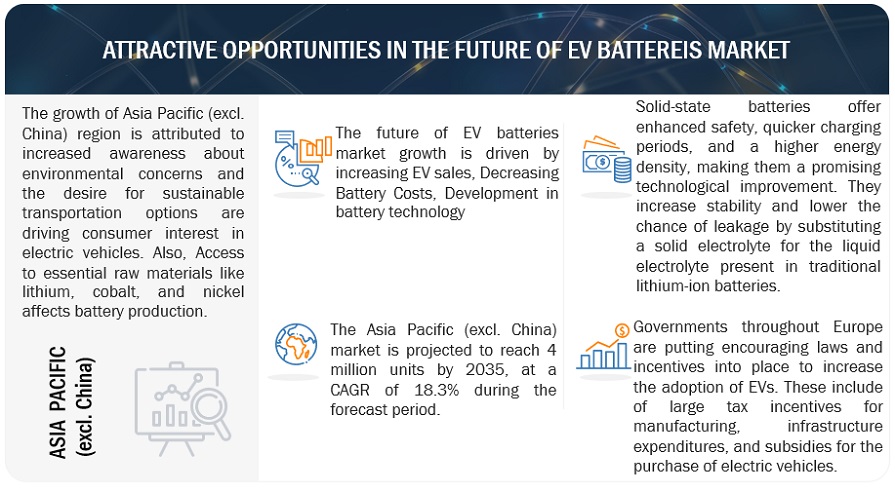
The rapid progress made in EV battery technology has played a huge role in the emergence of this global battery market. Electric vehicles are still in high demand due to increasing consumer interest in more sustainable and efficient transportation options. Manufacturers and researchers are constantly working to improve battery technology by solving problems related to energy density, charging time, cost, cleaner materials, and safety issues. The development of solid-state batteries is one such milestone that promises to revolutionize the automotive industry. Unlike traditional lithium-ion batteries that use a liquid or gel electrolyte, Solid-state batteries use a solid electrolyte, resulting in increased energy density, faster charging, and better safety. These improvements have the potential to significantly extend EV range and shorten charging times, addressing range anxiety concerns that have hindered widespread adoption. Solid Power Inc. (US) manufactures Solid-state batteries for electric vehicles using sulfide-based semiconductor cells.
Meanwhile, QuantumScape (US) is developing solid-state batteries for Volkswagen. These new batteries will probably be used in electric vehicles by 2026. Such development in battery technology will drive the battery market growth in the forecast period.
Restraint: Limited supply of Raw materials
The limited supply of raw materials such as lithium, cobalt, and nickel is a major restraining factor for the future of EV batteries market. These materials are critical for making batteries that have advanced specifications, but geographic, environmental, and political items typically limit their extraction and processing. Growing sales of EVs put a strain on these resources; this may lead to interruptions in supply chains or higher costs or even both. In addition, the sourcing concerns regarding the negative impacts on the environment caused during the mining process while also touching on issues related to rights abuses usually associated with some minerals such as cobalt. Hence, scarcity and price increases of these critical minerals may delay EV battery production growth, hampering technology advancement and restricting overall development in this sector, thereby investing in alternative materials recycling and sustainable mining approaches.
Opportunity: EV battery recycling provides opportunities to maintain the supply of critical materials
As the demand for electric vehicles grows, so does the need for these scarce and often geopolitically sensitive resources. By extracting these valuable components from batteries nearing the end of their beneficial lives, recycling gives a sustainable alternative to relying on risky mining practices and unstable global supply chains. This helps to maintain material sources and promotes a circular economy by reusing materials continuously, improving resource efficiency, and lowering the carbon impact of producing new batteries.
In addition, recycling approaches emerge as more effective and permit increasing costs of crucial material recuperation as technology advances. This lowers manufacturing charges and promotes the improvement of recent battery technologies. The European Union (EU) has some laws governing EV battery recycling. From 2030, batteries must contain a minimum recycled content of 12% for cobalt, 4% for lithium, 4% for nickel and 85% for lead. By 2035, these thresholds will increase to 20% cobalt, 10% lithium, 12% nickel and 85% lead.
Challenge: Performance declination of lithium-ion batteries over time
Performance degradation in lithium-ion batteries drastically influences the EV batteries market place by influencing patron self-assurance, car range, and ordinary batteries market dynamics. As batteries age, their capability diminishes due to reduced riding range and increased charging frequency, which could deter potential EV customers involved in long-term performance and resale price. This degradation also pressures producers to manufacture extra durable batteries with longer lifespans, doubtlessly increasing research and manufacturing costs. Additionally, the secondary market for degraded batteries, such as power storage or recycling, becomes extra vital, influencing supply chain dynamics and the overall economics of battery production and disposal. Consequently, managing and mitigating overall performance degradation is pivotal for the growth and sustainability of the EV market.
Future of Batteries Market Ecosystem
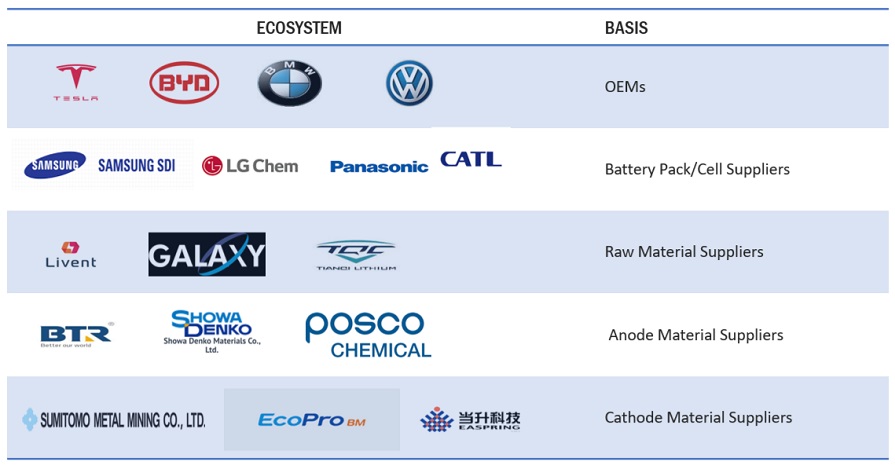
The ecosystem analysis highlights various players in the future of the EV battery market ecosystem, primarily represented by OEMs, battery pack/cell suppliers, raw material suppliers, etc. Prominent companies in this future of the EV battery market include CATL (China), LG Energy Solution Ltd. (South Korea), BYD Company Ltd. (China), Panasonic Holdings Corporation (Japan), and SK Innovation Co., Ltd. (South Korea) and among others.
Lithium-ion battery holds the largest share.
Lithium-ion batteries offer good energy density, longer cycles, and a relatively low self-discharge rate compared to other battery technologies. These characteristics make Li-ion batteries properly desirable for the needs of electric vehicles, where power storage, range, and performance are critical. Over the years, various variants of Li-ion chemistries have been developed, like Lithium Iron Phosphate (LFP) and Nickel Manganese Cobalt (NMC). The outcome was that each of these chemistries had a set of advantages; in general, LFP batteries exhibit a longer cycle life than NMC batteries, making them suitable for extensive and prolonged applications. While NMC batteries offer a higher energy density, allowing them to store more energy. Further, OEMs are developing batteries with advanced technology; for instance, in June 2023, Toyota announced that it aims to launch next-generation lithium-ion batteries in 2026, offering longer ranges and quicker charging. In May 2024, SAIC Motor announced that its all-solid-state battery will be mass-produced in 2026, with an energy density of more than 400Wh/kg.
The passenger car segment will continue dominating the future of EV batteries market during the forecast period.
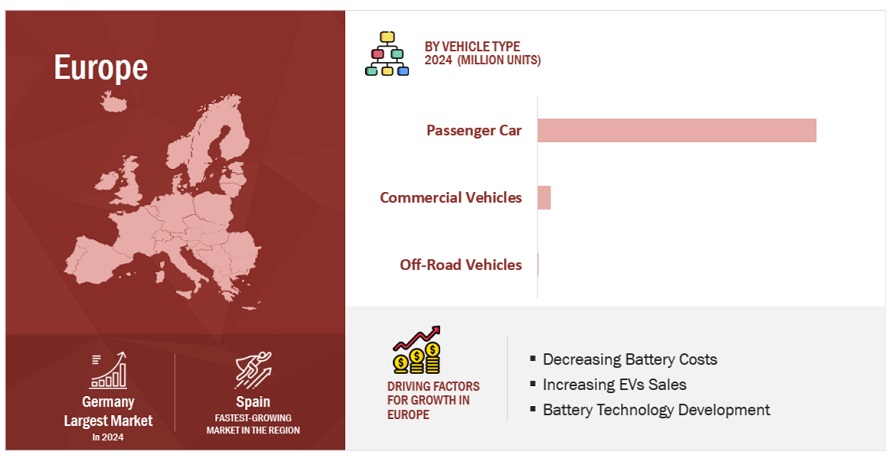
The global shift towards electric-powered mobility, pushed by environmental concerns and stringent emissions guidelines, has substantially boosted the demand for electric cars, driving the growth of the EV batteries market. Additionally, improvements in battery technology, consisting of developing high-power-density lithium-ion batteries, have made EVs extra realistic and less costly for the common purchaser. In addition, the availability of incentives and subsidies for EV purchases encourages the adoption of electric passenger vehicles. In addition, the significant charging infrastructure being advanced globally mainly helps passenger cars, making them more convenient for daily use. As a result, the passenger segment dominates the future of EV batteries marketplace, with their growing popularity expected to continue driving demand in the forecast period.
During the forecast period, Europe holds the 2nd largest share of the future of EV batteries market.
Various European countries have set a bold goal of reducing 80% of CO2 emissions by 2030-2035 and have created a roadmap. The governments of numerous European countries are also subsidizing EV infrastructure, thereby boosting EV sales and batteries. The increasingly more stringent guidelines related to environmental troubles are propelling key players to test and develop advanced automobiles, intending to further strengthen the market for advanced battery technologies.
European countries also invest heavily in charging infrastructure, easing range issues, and encouraging consumers to adopt electric vehicles. This infrastructure development enhances the future boom of the EV battery market. For instance, in March 2024, Northvolt AB (Sweden) started constructing a battery plant in northern Germany to supply electric cars, capping an intense lobbying effort under newly relaxed European Union state aid rules. Further, in September 2023, Gotion, Inc. (China) announced to build 20 GWh battery plant in Europe by 2026. In addition, Europe has a well-established automotive industry with corporations, including Volkswagen, BMW, and Renault, investing heavily in electric automobile generation.
Key Market Players
The future of EV batteries market is dominated by established players such as CATL (China), LG Energy Solution Ltd. (South Korea), BYD Company Ltd. (China), Panasonic Holdings Corporation (Japan), and SK Innovation Co., Ltd. (South Korea). These companies manufacture battery and develop new technologies. These companies have set up R&D facilities and offer best-in-class products to their customers.
Scope of the Report
|
Report Metric |
Details |
|
Market size available for years |
2019–2035 |
|
Base year considered |
2023 |
|
Forecast period |
2024-2035 |
|
Forecast units |
Volume (Thousand Units) |
|
Segments Covered |
Battery type, Battery Form, Vehicle type, battery packaging form and Region |
|
Geographies covered |
China, US, Europe, Asia Pacific (excl. China), and Rest of the World |
|
Companies Covered |
CATL (China), LG Energy Solution Ltd. (South Korea), BYD Company Ltd. (China), Panasonic Holdings Corporation (Japan), and SK Innovation Co., Ltd. (South Korea) |
This research report categorizes the future of EV batteries market based on Battery type, Battery Form, Vehicle type, battery packaging form and Region.
Based on Battery Type:
- Lithium-Ion
- Sodium-Ion
- Solid-State
- Lithium-Air
Based on Battery Form:
- Prismatic
- Pouch
- Cylindrical
Based on Vehicle Type:
- Passenger Cars
- Commerical Vehicles
- Off-Road Vehicles
Based on Packaging Form:
- Cell to Module
- Cell to Pack
- Cell to Chassis/Vehicle
- Module to Chassis
Based on the region:
- China
- US
-
Europe
- France
- Germany
- Spain
- Italy
- The UK
- Sweden
- Norway
- Denmark
-
Asia Pacific (excl. China)
- India
- Japan
- Thailand
- South Korea
-
Rest of the World
- UAE
- Egypt
- South Africa
Recent Developments
- In August 2024, A Memorandum of Understanding (MoU) was signed between Amara Raja Advanced Cell Technologies (ARACT), a wholly owned subsidiary of Amara Raja Energy & Mobility (ARE&M) (India), one of the top battery manufacturers in India, and Ather Energy (India). Under the terms of this partnership, Amara Raja and Ather will work together to develop and supply advanced chemical cells, such as lithium iron phosphate (LFP) and lithium-ion (Li-ion), locally produced at their future Gigafactory in Divitipally, Telangana.
- In June 2024, ExxonMobil (US) and SK On (South Korea), a leading global developer of electric vehicle (EV) batteries, inked a non-binding memorandum of understanding that paves the way for the business to obtain a multiyear offtake agreement of up to 100,000 metric tons of MobilTM Lithium from its first planned facility in Arkansas. SK On intends to use lithium in its American operations to produce EV batteries. This will help the development of an American electric vehicle supply chain and further ExxonMobil's objective, declared in late 2023, to supply lithium for around one million EV batteries annually by 2030.
- In March 2024, StoreDot, a developer of extreme fast charging (XFC) battery technology for EVs, announced a collaborative partnership with EVE Energy. The partnership gives StoreDot access to EVE Energy's extensive manufacturing footprint and the ability to mass produce its 100 in 5 extreme fast-charging battery cells.
- In February 2024, LG Energy Solution signed an offtake agreement with Wesfarmers Chemicals, Energy, and Fertilisers for lithium concentrate, advancing the companies' pre-existing partnership to deliver efficient and sustainable power solutions to the North American market.
- In January 2024, Jianghuai Automobile Group and CATL signed a strategic cooperation agreement in Ningde, Fujian Province. According to the agreement, both companies will actively cooperate in the supply of EV batteries, introduction of battery swapping technology, joint development and application of new technologies and products, market expansion at home and abroad, and carbon emission reduction across the industry chain, as well as work together to formulate an action plan and build a strategic alliance.
Frequently Asked Questions (FAQ):
What is the current size of the future of EV batteries market by volume?
The current size of the future of EV batteries market is estimated at 16 million units in 2024.
Who are the winners in the future of EV batteries market?
The EV batteries space is dominated by key players such as CATL (China), LG Energy Solution Ltd. (South Korea), BYD Company Ltd. (China), Panasonic Holdings Corporation (Japan), and SK Innovation Co., Ltd. (South Korea). These companies manufacture batteries and develop new technologies. These companies have set up R&D facilities and offer best-in-class products to their customers.
Which region will have the fastest-growing market for future of EV batteries market?
Europe will be the fastest-growing future of EV batteries market region as Europe is aiming for self-sufficiency in battery production to reduce reliance on Asian imports and address supply chain vulnerabilities. This involves building numerous gigafactories across the continent, creating jobs, strengthening the economy, and shortening supply chains.
What are the new market trends impacting the growth of the future of EV batteries market?
The key trends impacting the growth of the future of EV batteries market are transition to solid-state batteries, reduced cost per kilowatt-hour, increased energy density, and diversification of battery chemistries.
What countries are covered in Europe for the future of EV batteries market?
The countries covered in report for the future of EV batteries market are Germany, France, UK, Spain, Italy, Norway, Sweden and Denmark. .
To speak to our analyst for a discussion on the above findings, click Speak to Analyst

- 5.1 INTRODUCTION
-
5.2 EXISTING BATTERY PACKAGING FORMATSCELL-TO-MODULECELL-TO-PACK
-
5.3 FUTURE OF BATTERY PACKAGING FORMATSCELL-TO-CHASSISMODULE-TO-CHASSIS
- 5.4 PROS AND CONS OF BATTERY PACKAGING FORMATS
-
5.5 FORWARD AND BACKWARD INTEGRATION OF BATTERY MANUFACTURERSFORWARD INTEGRATION OF BATTERY MANUFACTURERSBACKWARD INTEGRATION OF BATTERY MANUFACTURERS
-
5.6 MNM INSIGHTS ON OEM MAPPING OF BATTERY PACKAGING FORMATSPASSENGER CARSCOMMERCIAL VEHICLESOFF-ROAD VEHICLES
- 6.1 INTRODUCTION
-
6.2 EXISTING BATTERY FORMSPRISMATICPOUCHCYLINDRICAL
- 6.3 PROS AND CONS OF BATTERY FORMS
-
6.4 MNM INSIGHTS ON OEM MAPPING OF BATTERY FORMSPASSENGER CARSCOMMERCIAL VEHICLES

- 7.1 INTRODUCTION
- 7.2 KEY PLAYER STRATEGIES/RIGHT TO WIN, 2020–2024
- 7.3 MARKET SHARE ANALYSIS, 2023
- 7.4 REVENUE ANALYSIS, 2019–2023
-
7.5 COMPANY VALUATION AND FINANCIAL METRICSCOMPANY VALUATIONFINANCIAL METRICS
- 7.6 BRAND/PRODUCT COMPARISON
-
7.7 COMPANY EVALUATION MATRIX: KEY PLAYERS, 2023STARSEMERGING LEADERSPERVASIVE PLAYERSPARTICIPANTSCOMPANY FOOTPRINT
-
7.8 COMPANY EVALUATION MATRIX: START-UPS/SMES, 2023PROGRESSIVE COMPANIESRESPONSIVE COMPANIESDYNAMIC COMPANIESSTARTING BLOCKSCOMPETITIVE BENCHMARKING
-
7.9 COMPETITIVE SCENARIOPRODUCT LAUNCHES/DEVELOPMENTSDEALSEXPANSIONOTHERS
-
8.1 KEY PLAYERSCONTEMPORARY AMPEREX TECHNOLOGY CO., LIMITED- Business overview- Products offered- Recent developments- MnM viewBYD COMPANY LTD.- Business overview- Products offered- Recent developments- MnM viewLG ENERGY SOLUTION- Business overview- Products offered- Recent developments- MnM viewPANASONIC HOLDINGS CORPORATION- Business overview- Products offered- Recent developments- MnM viewSK INNOVATION CO., LTD.- Business overview- Products offered- Recent developments- MnM viewCALB- Business overview- Products offered- Recent developmentsSAMSUNG SDI CO., LTD.- Business overview- Products offered- Recent developmentsGOTION, INC.- Business overview- Products offered- Recent developmentsEVE ENERGY CO., LTD.- Business overview- Products offered- Recent developmentsSUNWODA ELECTRONIC CO., LTD.- Business overview- Products offered- Recent developmentsFARASIS ENERGY (GANZHOU) CO., LTD.- Business overview- Products offered- Recent developments
- 9.1 KEY INDUSTRY INSIGHTS
- 9.2 DISCUSSION GUIDE
- 9.3 KNOWLEDGESTORE: MARKETSANDMARKETS’ SUBSCRIPTION PORTAL
-
9.4 CUSTOMIZATION OPTIONSADDITIONAL COMPANY PROFILESFUTURE OF EV BATTERIES MARKET, BY PROPULSION TYPE, AT COUNTRY LEVELFUTURE OF EV BATTERIES MARKET, BY PROPULSION TYPE, AT VEHICLE TYPE LEVEL
- 9.5 RELATED REPORTS
- 9.6 AUTHOR DETAILS
- TABLE 1 FUTURE OF EV BATTERIES MARKET DEFINITION, BY BATTERY TYPE
- TABLE 2 FUTURE OF EV BATTERIES MARKET DEFINITION, BY VEHICLE TYPE
- TABLE 3 FUTURE OF EV BATTERIES MARKET DEFINITION, BY BATTERY FORM
- TABLE 4 INCLUSIONS AND EXCLUSIONS
- TABLE 5 CURRENCY EXCHANGE RATES (PER USD)
- TABLE 6 ELECTRIFIED AUTOMOTIVE MARKET, BY REGION, 2019–2023 (THOUSAND UNITS)
- TABLE 7 ELECTRIFIED AUTOMOTIVE MARKET, BY REGION, 2024–2030 (THOUSAND UNITS)
- TABLE 8 ELECTRIFIED AUTOMOTIVE MARKET, BY REGION, 2031–2035 (THOUSAND UNITS)
- TABLE 9 ELECTRIC PASSENGER CARS MARKET, BY REGION, 2019–2023 (THOUSAND UNITS)
- TABLE 10 ELECTRIC PASSENGER CARS MARKET, BY REGION, 2024–2030 (THOUSAND UNITS)
- TABLE 11 ELECTRIC PASSENGER CARS MARKET, BY REGION, 2031–2035 (THOUSAND UNITS)
- TABLE 12 ELECTRIC COMMERCIAL VEHICLES MARKET, BY REGION, 2019–2023 (THOUSAND UNITS)
- TABLE 13 ELECTRIC COMMERCIAL VEHICLES MARKET, BY REGION, 2024–2030 (THOUSAND UNITS)
- TABLE 14 ELECTRIC COMMERCIAL VEHICLES MARKET, BY REGION, 2031–2035 (THOUSAND UNITS)
- TABLE 15 ELECTRIC OFF-ROAD VEHICLES MARKET, BY REGION, 2019–2023 (THOUSAND UNITS)
- TABLE 16 ELECTRIC OFF-ROAD VEHICLES MARKET, BY REGION, 2024–2030 (THOUSAND UNITS)
- TABLE 17 ELECTRIC OFF-ROAD VEHICLES MARKET, BY REGION, 2031–2035 (THOUSAND UNITS)
- TABLE 18 BATTERY DEMAND, BY VEHICLE TYPE, 2023–2035 (GWH)
- TABLE 19 BATTERY MANUFACTURING CAPACITY, BY COUNTRY, 2022
- TABLE 20 BATTERY MANUFACTURING CAPACITY, BY COUNTRY, 2027
- TABLE 21 NEXT-GENERATION BATTERY TECHNOLOGIES
- TABLE 22 ELECTROCHEMICAL REACTIONS OF LITHIUM IRON PHOSPHATE BATTERIES
- TABLE 23 RECENT DEVELOPMENTS IN LITHIUM IRON PHOSPHATE BATTERIES
- TABLE 24 ELECTROCHEMICAL REACTIONS OF NICKEL MANGANESE COBALT BATTERIES
- TABLE 25 RECENT DEVELOPMENTS IN NICKEL MANGANESE COBALT BATTERIES
- TABLE 26 RECENT DEVELOPMENTS IN LITHIUM MANGANESE IRON PHOSPHATE BATTERIES
- TABLE 27 COMPARISON BETWEEN LFP, LMFP, AND NMC BATTERIES
- TABLE 28 ELECTROCHEMICAL REACTIONS OF SODIUM-ION BATTERIES
- TABLE 29 RECENT DEVELOPMENTS IN SODIUM-ION BATTERIES
- TABLE 30 DIFFERENCE BETWEEN LITHIUM-ION AND SOLID-STATE BATTERIES
- TABLE 31 RECENT DEVELOPMENTS IN SOLID-STATE BATTERIES
- TABLE 32 COMPARISON BETWEEN DIFFERENT EV BATTERIES
- TABLE 33 UPCOMING OEM PASSENGER CAR LAUNCHES, BY BATTERY TYPE
- TABLE 34 UPCOMING OEM COMMERCIAL VEHICLE LAUNCHES, BY BATTERY TYPE
- TABLE 35 UPCOMING OEM OFF-ROAD VEHICLE LAUNCHES, BY BATTERY TYPE
- TABLE 36 BATTERY PRICING ANALYSIS, BY OEM (USD/KWH), 2022–2030
- TABLE 37 VEHICLE BATTERY COSTS, BY MODEL
- TABLE 38 LITHIUM-ION BATTERY PRICING, BY TYPE
- TABLE 39 PROS AND CONS OF BATTERY PACKAGING FORMATS
- TABLE 40 PASSENGER CAR BATTERY PACKAGING FORMATS, BY OEM
- TABLE 41 COMMERCIAL VEHICLE BATTERY PACKAGING FORMATS, BY OEM
- TABLE 42 OFF-ROAD VEHICLE BATTERY PACKAGING FORMATS, BY OEM
- TABLE 43 PROS AND CONS OF BATTERY FORMS
- TABLE 44 PASSENGER CAR BATTERY FORMS, BY OEM
- TABLE 45 COMMERCIAL VEHICLE BATTERY FORMS, BY OEM
- TABLE 46 KEY PLAYER STRATEGIES/RIGHT TO WIN, 2020–2024
- TABLE 47 DEGREE OF COMPETITION, 2023
- TABLE 48 PRODUCT FOOTPRINT, 2023
- TABLE 49 REGION FOOTPRINT, 2023
- TABLE 50 KEY START-UPS/SMES
- TABLE 51 COMPETITIVE BENCHMARKING OF KEY START-UPS/SMES
- TABLE 52 PRODUCT LAUNCHES/DEVELOPMENTS, 2020–2024
- TABLE 53 DEALS, 2020–2024
- TABLE 54 EXPANSIONS, 2020–2024
- TABLE 55 OTHERS, 2020–2024
- TABLE 56 CONTEMPORARY AMPEREX TECHNOLOGY CO., LIMITED: COMPANY OVERVIEW
- TABLE 57 CONTEMPORARY AMPEREX TECHNOLOGY CO., LIMITED: SUPPLY AGREEMENTS
- TABLE 58 CONTEMPORARY AMPEREX TECHNOLOGY CO., LIMITED: PRODUCTS OFFERED
- TABLE 59 CONTEMPORARY AMPEREX TECHNOLOGY CO., LIMITED: PRODUCT LAUNCHES/DEVELOPMENTS
- TABLE 60 CONTEMPORARY AMPEREX TECHNOLOGY CO., LIMITED: DEALS
- TABLE 61 CONTEMPORARY AMPEREX TECHNOLOGY CO., LIMITED: EXPANSIONS
- TABLE 62 CONTEMPORARY AMPEREX TECHNOLOGY CO., LIMITED: OTHERS
- TABLE 63 BYD COMPANY LTD.: COMPANY OVERVIEW
- TABLE 64 BYD COMPANY LTD.: PRODUCTS OFFERED
- TABLE 65 BYD COMPANY LTD.: PRODUCT LAUNCHES/DEVELOPMENTS
- TABLE 66 BYD COMPANY LTD.: DEALS
- TABLE 67 BYD COMPANY LTD.: EXPANSIONS
- TABLE 68 LG ENERGY SOLUTION: COMPANY OVERVIEW
- TABLE 69 LG ENERGY SOLUTION: R&D OVERVIEW
- TABLE 70 LG ENERGY SOLUTION: SUPPLY AGREEMENTS
- TABLE 71 LG ENERGY SOLUTION: PRODUCTS OFFERED
- TABLE 72 LG ENERGY SOLUTION: DEALS
- TABLE 73 LG ENERGY SOLUTION: OTHERS
- TABLE 74 PANASONIC HOLDINGS CORPORATION: COMPANY OVERVIEW
- TABLE 75 PANASONIC HOLDINGS CORPORATION: SUPPLY AGREEMENTS
- TABLE 76 PANASONIC HOLDINGS CORPORATION: PRODUCTS OFFERED
- TABLE 77 PANASONIC HOLDINGS CORPORATION: PRODUCT LAUNCHES/DEVELOPMENTS
- TABLE 78 PANASONIC HOLDINGS CORPORATION: DEALS
- TABLE 79 PANASONIC HOLDINGS CORPORATION: EXPANSIONS
- TABLE 80 PANASONIC HOLDINGS CORPORATION: OTHERS
- TABLE 81 SK INNOVATION CO., LTD.: COMPANY OVERVIEW
- TABLE 82 SK INNOVATION CO., LTD.: SUPPLY AGREEMENTS
- TABLE 83 SK INNOVATION CO., LTD.: PRODUCTS OFFERED
- TABLE 84 SK INNOVATION CO., LTD.: PRODUCT LAUNCHES/DEVELOPMENTS
- TABLE 85 SK INNOVATION CO., LTD.: DEALS
- TABLE 86 SK INNOVATION CO., LTD.: EXPANSIONS
- TABLE 87 SK INNOVATION CO., LTD.: OTHERS
- TABLE 88 CALB: COMPANY OVERVIEW
- TABLE 89 CALB: SUPPLY AGREEMENTS
- TABLE 90 CALB: PRODUCTS OFFERED
- TABLE 91 CALB: PRODUCT LAUNCHES/DEVELOPMENTS
- TABLE 92 CALB: DEALS
- TABLE 93 SAMSUNG SDI CO., LTD.: COMPANY OVERVIEW
- TABLE 94 SAMSUNG SDI CO., LTD.: SUPPLY AGREEMENTS
- TABLE 95 SAMSUNG SDI CO., LTD.: PRODUCTS OFFERED
- TABLE 96 SAMSUNG SDI CO., LTD.: PRODUCT LAUNCHES/DEVELOPMENTS
- TABLE 97 SAMSUNG SDI CO., LTD.: DEALS
- TABLE 98 SAMSUNG SDI CO., LTD.: EXPANSIONS
- TABLE 99 SAMSUNG SDI CO., LTD.: OTHERS
- TABLE 100 GOTION, INC.: COMPANY OVERVIEW
- TABLE 101 GOTION, INC.: PRODUCTS OFFERED
- TABLE 102 GOTION, INC.: PRODUCT LAUNCHES/DEVELOPMENTS
- TABLE 103 GOTION, INC.: DEALS
- TABLE 104 GOTION, INC.: EXPANSIONS
- TABLE 105 EVE ENERGY CO., LTD.: COMPANY OVERVIEW
- TABLE 106 EVE ENERGY CO., LTD.: SUPPLY AGREEMENTS
- TABLE 107 EVE ENERGY CO., LTD.: PRODUCTS OFFERED
- TABLE 108 EVE ENERGY CO., LTD.: DEALS
- TABLE 109 EVE ENERGY CO., LTD.: OTHERS
- TABLE 110 SUNWODA ELECTRONIC CO., LTD.: COMPANY OVERVIEW
- TABLE 111 SUNWODA ELECTRONIC CO., LTD.: SUPPLY AGREEMENTS
- TABLE 112 SUNWODA ELECTRONIC CO., LTD.: PRODUCTS OFFERED
- TABLE 113 SUNWODA ELECTRONIC CO., LTD.: DEALS
- TABLE 114 SUNWODA ELECTRONIC CO., LTD.: OTHERS
- TABLE 115 FARASIS ENERGY (GANZHOU) CO., LTD.: COMPANY OVERVIEW
- TABLE 116 FARASIS ENERGY (GANZHOU) CO., LTD.: PRODUCTS OFFERED
- TABLE 117 FARASIS ENERGY (GANZHOU) CO., LTD.: DEALS
- TABLE 118 FARASIS ENERGY (GANZHOU) CO., LTD.: EXPANSIONS
- FIGURE 1 FUTURE OF EV BATTERIES MARKET SEGMENTATION
- FIGURE 2 AUTOMAKER ELECTRIFICATION TARGET FOR ELECTRIC VEHICLES, 2023
- FIGURE 3 ELECTRIFIED AUTOMOTIVE MARKET, BY REGION, 2024–2035 (THOUSAND UNITS)
- FIGURE 4 BEST-SELLING PLUG-IN ELECTRIC VEHICLE MODELS GLOBALLY, 2023 (THOUSAND UNITS)
- FIGURE 5 EV BATTERY MARKET, BY REGION, 2024–2035 (USD BILLION)
- FIGURE 6 BATTERY MANUFACTURING CAPACITY, BY COUNTRY
- FIGURE 7 EVOLUTION OF BATTERY TECHNOLOGIES
- FIGURE 8 ROADMAP FOR BATTERY TECHNOLOGIES
- FIGURE 9 GLOBAL LITHIUM-ION BATTERY DEMAND, 2022–2030 (GWH)
- FIGURE 10 BENEFITS OF LITHIUM IRON PHOSPHATE BATTERIES FOR ELECTRIC PASSENGER CARS
- FIGURE 11 ANTICIPATED APPLICATIONS OF LITHIUM MANGANESE IRON PHOSPHATE BATTERIES AND PROJECTED SHIPMENT VOLUME IN CHINA
- FIGURE 12 VISUAL COMPARISON OF LITHIUM-ION BATTERIES
- FIGURE 13 SCHEMATIC OF LITHIUM-AIR BATTERY CHARGE AND DISCHARGE CYCLES
- FIGURE 14 PRICE OF SELECTED BATTERY MATERIALS, 2015–2023
- FIGURE 15 COST BREAKDOWN OF CELLS, BY MATERIAL, 2023
- FIGURE 16 VOLUME-WEIGHTED AVERAGE LITHIUM-ION BATTERY PACK AND CELL PRICE, 2019–2023
- FIGURE 17 AVERAGE SELLING PRICE OF EV BATTERIES, BY REGION, 2019–2023
- FIGURE 18 MULTISCALE HIERARCHICAL FRAMEWORK FOR THERMO-ELECTRIC-CHEMICAL CO-DESIGN OF BATTERIES AND ELECTRIC VEHICLES
- FIGURE 19 CELL-TO-PACK BATTERY MANUFACTURING PROCESS
- FIGURE 20 CELL-TO-PACK BATTERY MARKET, BY REGION, 2024–2030
- FIGURE 21 EV POWER BATTERY STRUCTURE DEVELOPMENT
- FIGURE 22 CELL FORMATS PRODUCED BY EV BATTERY MANUFACTURERS
- FIGURE 23 CELL FORMATS USED BY MAJOR OEMS
- FIGURE 24 TESLA CYLINDRICAL BATTERY SIZES
- FIGURE 25 FUTURE OF EV BATTERIES MARKET SHARE ANALYSIS OF KEY PLAYERS, 2023
- FIGURE 26 REVENUE ANALYSIS OF TOP FIVE PLAYERS, 2019–2023
- FIGURE 27 COMPANY VALUATION OF KEY PLAYERS, 2024
- FIGURE 28 FINANCIAL METRICS OF KEY PLAYERS, 2024
- FIGURE 29 BRAND/PRODUCT COMPARISON OF TOP FIVE PLAYERS
- FIGURE 30 COMPANY EVALUATION MATRIX (KEY PLAYERS), 2023
- FIGURE 31 COMPANY FOOTPRINT, 2023
- FIGURE 32 COMPANY EVALUATION MATRIX (START-UPS/SMES), 2023
- FIGURE 33 CONTEMPORARY AMPEREX TECHNOLOGY CO., LIMITED: COMPANY SNAPSHOT
- FIGURE 34 CONTEMPORARY AMPEREX TECHNOLOGY CO., LIMITED: TECHNOLOGY ROADMAP
- FIGURE 35 BYD COMPANY LTD.: COMPANY SNAPSHOT
- FIGURE 36 LG ENERGY SOLUTION: COMPANY SNAPSHOT
- FIGURE 37 BENEFITS OF LG ENERGY SOLUTION BATTERIES
- FIGURE 38 LG ENERGY SOLUTION: FUTURE TECHNOLOGY DEVELOPMENT
- FIGURE 39 LG ENERGY SOLUTION: NEXT-GENERATION BATTERIES
- FIGURE 40 PANASONIC HOLDINGS CORPORATION: COMPANY SNAPSHOT
- FIGURE 41 SK INNOVATION CO., LTD.: COMPANY SNAPSHOT
- FIGURE 42 SK INNOVATION CO., LTD.: GLOBAL BATTERY PRODUCTION
- FIGURE 43 CALB: COMPANY SNAPSHOT
- FIGURE 44 SAMSUNG SDI CO., LTD.: COMPANY SNAPSHOT
- FIGURE 45 SAMSUNG SDI CO., LTD.: GLOBAL FOOTPRINT
- FIGURE 46 GOTION, INC.: COMPANY SNAPSHOT
- FIGURE 47 EVE ENERGY CO., LTD.: COMPANY SNAPSHOT
- FIGURE 48 SUNWODA ELECTRONIC CO., LTD.: COMPANY SNAPSHOT
- FIGURE 49 FARASIS ENERGY (GANZHOU) CO., LTD.: COMPANY SNAPSHOT
This research study involved the extensive use of secondary sources, such as company annual reports/presentations, industry association publications, automotive magazine articles, directories, technical handbooks, the World Economic Outlook, trade websites, technical articles, and databases, to identify and collect information on the future of EV batteries market. In-depth interviews were conducted with various primary respondents, including key industry participants, subject-matter experts (SMEs), C-level executives of key market players (EV battery and EV battery component manufacturers), and industry consultants, among other experts, to obtain and verify critical qualitative and quantitative information and assess market prospects.
Secondary Research
In the secondary research process, various secondary sources were used to identify and collect information for this study. The secondary sources include annual reports, press releases, and investor presentations of companies; whitepapers, certified publications; articles from recognized authors, directories, and databases; and articles from recognized associations and government publishing sources. Secondary research has been used to obtain key information about the industry’s value chain, the overall pool of key players, market classification and segmentation according to industry trends to the bottom-most level, regional markets, and key developments from the market- and technology-oriented perspectives.
Primary Research
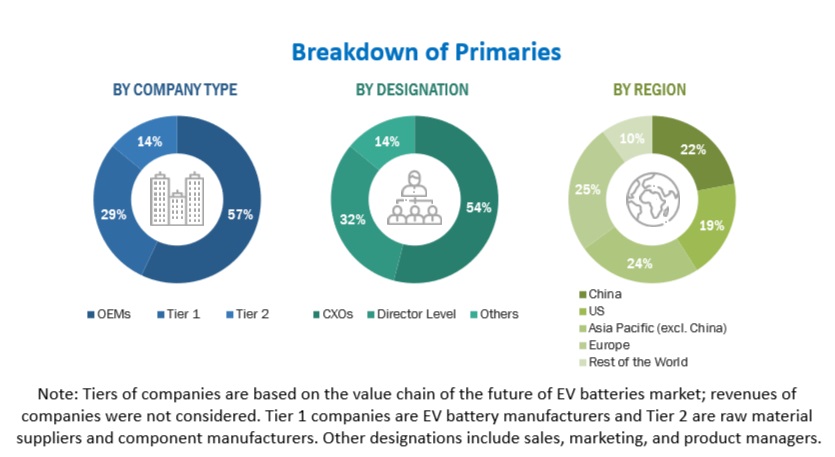
Extensive primary research was conducted after acquiring an understanding of the global future of EV batteries market scenarios through secondary research. Several primary interviews were conducted with market experts from both the demand (country-level government associations, trade associations, institutes, R&D centers, and OEMs/vehicle manufacturers) and supply (EV battery manufacturers, EV component manufacturers, and raw material suppliers) sides across four major regions, namely, China, US, Europe, Asia Pacific (excl. China), and Rest of the World. 23% of the experts involved in primary interviews were from the demand side, and 77% were from the supply side of the industry. Primary data was collected through questionnaires, emails, and telephonic interviews. Several primary interviews were conducted from various departments within organizations, such as sales, operations, administration, and so on, to provide a holistic viewpoint in the report.
After interacting with industry participants, some brief sessions were conducted with experienced independent consultants to reinforce the findings from the primary interviews. This, along with the in-house subject matter experts’ opinions, led to the findings delineated in the rest of this report.
To know about the assumptions considered for the study, download the pdf brochure
Market Size Estimation
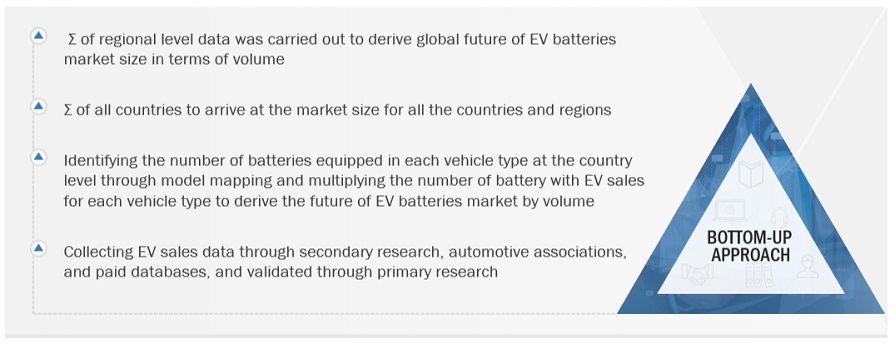
The bottom-up approach was used to estimate and validate the total future of EV batteries market size. This method was also used extensively to estimate the size of various subsegments in the market. The research methodology used to estimate the battery market size includes the following:
- The key players in the industry and markets have been identified through extensive secondary research
- The industry’s supply chain and market size, in terms of volume, have been determined through primary and secondary research processes.
- All percentage shares, splits, and breakdowns have been determined using secondary sources and verified through primary sources.
To know about the assumptions considered for the study, Request for Free Sample Report
Data Triangulation
After arriving at the overall market size—using the future of EV batteries market size estimation processes as explained above—the market was split into several segments and subsegments. To complete the overall market engineering process and arrive at the exact statistics of each market segment and subsegment, data triangulation and market breakdown procedures were employed, wherever applicable. The data was triangulated by studying various factors and trends from both the demand and supply sides.
Market Definition
According to the Batteries Directive 2006/66/EC, batteries are defined as any source of electrical energy generated by direct conversion of chemical energy and consisting of one or more primary battery cells (non-rechargeable) or one or more secondary battery cells (rechargeable). An EV battery is a rechargeable battery used to power BEVs), PHEVs, and HEVs. An EV battery usually comprises numerous small, individual cells arranged in series or parallel to achieve the desired voltage and capacity.
List of Key Stakeholders
- Automotive OEMs
- Automobile Manufacturers
- Battery-related Service Providers
- EV Battery Casing Manufacturers
- EV Component Manufacturers
- EV Battery Manufacturing Organizations
- EV Battery Cell Manufacturing Organizations
- EV Battery Pack Manufacturing Organizations
- EV Battery Raw Material Miners and Suppliers
- EV Battery Raw Material Refinery Companies
- EV Infrastructure Component Manufacturers
- EV Infrastructure Developers
- EV Manufacturers
- Government Bodies (who directly and indirectly provide incentives, aid, and orders to EV manufacturers)
- Electric Vehicle Manufacturers
- Regulatory Bodies
- Electric Vehicle Traders and Distributors
- EV Battery Component Traders, Distributors, and Suppliers
Report Objectives
- To define and describe the future of EV batteries market based on battery technology, battery packaging format, and battery form
- To analyze and forecast the electrified automotive market, in terms of volume (thousand units), based on vehicle type (passenger cars, commercial vehicles, and off-road vehicles) and region [China, US, Europe, Asia Pacific (excl. China), and Rest of the World]
- To analyze the current state and future of EV battery technology (lithium-ion, sodium-ion, solid-state, and lithium-air)
- To analyze the current state and future EV battery packaging format (cell-to-module, cell-to-pack, cell-to-chassis, and module-to-chassis)
- To analyze the current state and future EV battery form (prismatic, pouch, and cylindrical)
- To analyze the battery demand in terms of GWh for the projected period by vehicle type (passenger cars, commercial vehicles, and off-road vehicles)
- To forecast the size of market segments with respect to key regions, namely China, the US, Europe, Asia Pacific, excluding China, and the Rest of the World
- To strategically analyze segments with respect to individual growth trends, prospects, and contributions to the total market
- To analyze the opportunities offered by various segments of the market to its stakeholders
- To analyze and forecast trends and orientation for the market in the global industry
- To strategically profile key players and comprehensively analyze their market share and core competencies
- To track and analyze competitive developments, such as product launches/developments, deals, and others, in the market
AVAILABLE CUSTOMIZATIONS
With the given market data, MarketsandMarkets offers customizations in accordance with company-specific needs.
- Additional company profile
- Future of EV batteries market, by propulsion type at the country level
- Future of EV batteries market, by propulsion type at the vehicle type level


Growth opportunities and latent adjacency in Future of EV Batteries Market