Hexane Market

Hexane Market by Type (N-hexane, Isohexane, and Neohexane), Grade (Oil Extraction/Food, Pharmaceutical, and Industrial), Application (Oil Extraction, Pharmaceutical, Industrial Cleaning & Degreasing, Polymerization), and Region - Global Forecast to 2031




OVERVIEW
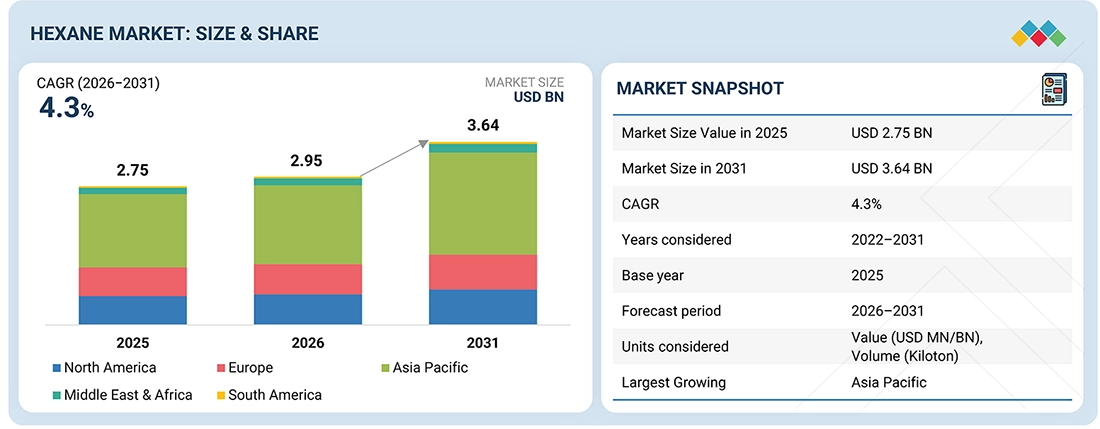
Source: Secondary Research, Interviews with Experts, MarketsandMarkets Analysis
The global hexane market is projected to grow from USD 2.95 billion in 2026 to USD 3.64 billion by 2031, at a CAGR of 4.3% during the forecast period. Hexane is a term used to describe a group of volatile solvent extracts of petroleum, which can be used for their high solvency properties as oil-separating agents or as cleansers for industrial machinery and equipment. Various forms of hexanes are available (such as n-Hexane, isohexane, and neohexane), which have different properties accordingly. The major category of demand for hexanes is the extraction of edible oils from natural sources, where large quantities need to be processed simultaneously at maximum speed. Demand is also driven by the arrival of higher-grade, higher-purity hexanes in the pharmaceutical market, as well as in industrial cleaning/degreasing for manufacturing and engineering markets. Investment in plastics and polymers production is also a source of stable growth.
KEY TAKEAWAYS
-
BY REGIONThe Asia Pacific region is expected to register the highest CAGR (5.3%) during the forecast period.
-
BY GRADEBy grade, the pharmaceutical grade segment is projected to grow at the highest CAGR (5.6%) during the forecast period.
-
BY APPLICATIONBy application, the polymerization segment is projected to register the highest CAGR (5.1%) during the forecast period.
-
BY TYPEBy type, the N-hexane segment is expected to dominate the market.
-
Competitive Landscape - Key PlayersChina Petrochemical Corporation (Sinopec), Shell plc., ExxonMobil Corporation, and Chevron Phillips Chemical Company were identified as leading players in the hexane market, given their strong market share and product portfolios.
-
Competitive Landscape - StartupsLiaoning Yufeng Chemical Co., Ltd., Arham Petrochem Private Limited, GFS Chemicals, Noah Chemicals, and Muby Chemicals, among others, have become leading startups or SMEs by identifying niche gaps early and delivering solutions that precisely match unmet customer needs. Their agility, faster decision-making, and continuous innovation allow them to outperform larger, less flexible competitors.
The hexane market comprises specialty solvents used to support efficient manufacturing and enhance performance across industrial applications. The market is segmented based on region, grade, application, and type. By region, Asia Pacific continues to lead demand, driven by industrialization in key sectors. By grade, industrial-grade supports consistent use for cost-effective processing. From an application view, polymerization aids material flexibility and efficiency in rubber and plastics. By type, n-hexane reflects preference for safer, high-performance options amid regulatory focus. End users in automotive, construction, and manufacturing rely on hexane as a critical component. Growth is driven by expanding activity, rising consumption, and formulation upgrades, positioning hexane as integral to industrial workflows.
TRENDS & DISRUPTIONS IMPACTING CUSTOMERS' CUSTOMERS
The impact on consumers' businesses arises from evolving customer trends or market disruptions. Megatrends such as sustainability and digital transformation, alongside disruptions such as AI, supply chain localization, and the energy transition, are significantly reshaping customer priorities and business models. Traditionally, revenue mixes were dominated by legacy products and processes focused on volume and cost. Today, customers are shifting toward high-margin, innovation-driven, and sustainable solutions to remain competitive and future-proof. This transition is prompting businesses to adapt quickly, invest in cleaner technologies, and enhance agility, with suppliers expected to deliver compliant, efficient, and tech-enabled offerings that align with evolving market demands.
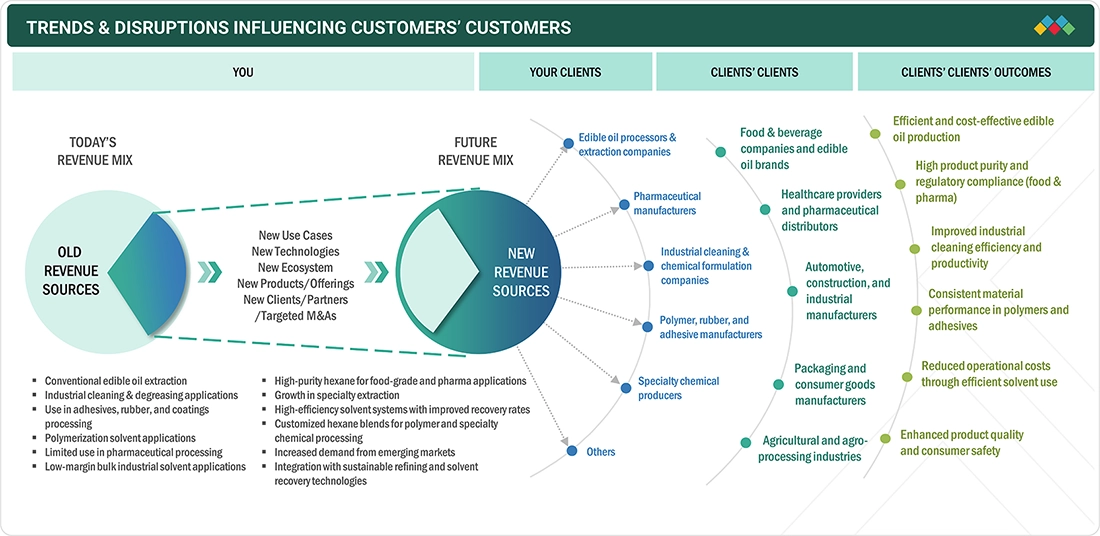
Source: Secondary Research, Interviews with Experts, MarketsandMarkets Analysis
MARKET DYNAMICS

Level
-
Strong growth momentum in Asia Pacific driven by expanding food processing, rapid urbanization, industrial development, and robust demand from edible oil sector

-
Rising utilization across pharmaceuticals, adhesives, and polymer processing applications


Level
-
Gradual transition toward environmentally friendly and green solvent alternatives


Level
-
Increase in demand for solvent in paints & coatings sector


Level
-
Concerns related to flammability and toxicity impacting handling and usage

-
Volatility in crude oil prices

Source: Secondary Research, Interviews with Experts, MarketsandMarkets Analysis
Driver: Strong growth momentum in Asia Pacific driven by expanding food processing, rapid urbanization, industrial development, and robust demand from edible oil sector
Hexane has become the solvent of choice in the extraction of edible oils from oilseeds such as soybean, sunflower, rapeseed, cottonseed and palm, owing to its ideal combination of high oil solubility, low boiling point and ease of recovery, thus making the process both economically viable and commercially feasible for large amounts of oil. It is very manageable in closed-loop systems and is easily recycled for continuous use without degradation. Its fate as a food extractant remains intact, as food-grade hexane would be used under regulated pressure and temperature conditions, with limits on residual solvent content. Asia Pacific accounts for a large share of the increased demand and growth for hexane due to the rapid increase in urbanization, increased food processing industries, and an expanding demand in edible oils in the region. Currently, the demand for vegetable oils is strong in China, India, and other countries because of demographics and altered eating habits. Also, the region is seeing an expansion in the pharmaceutical and industrial sectors, fueling increased consumption of hexane.
Restraint: Gradual transition toward environmentally friendly and green solvent alternatives
One of the major restraints to the growth of the hexane market is the increasing demand for environmentally friendly and sustainable solvents. As a VOC, hexane falls under the scope of rigorous environmental and occupational safety legislation in North America and Europe. Regulatory bodies such as the EPA (US) and REACH Europe are pressing for reduced emissions, cleaner technologies, and sustainable solvents. At the same time, the ever-increasing consumer concern about health and the environment is driving the increased use of bio-based, less-toxic, low-toxicity solvents across food, fragrance, and pharmaceutical applications. Also, alternative extraction methods such as cold-pressing and no-to-low solvent techniques are always being considered in high-value products. Though the efficiency of these techniques is not the same as that of hexane, it is increasing and would be a challenge to the growth of the hexane market.
Opportunity: Increase in demand for solvent in paints & coatings sector
The growing paints & coatings market is expected to create opportunities for market players. Hexane finds applications in paints and coatings manufacturing as a good solvent owing to its fast evaporation and close similarity to various resins and binders. With the surge in infrastructure development and construction worldwide, demand for paints and coatings is rising, driving the need for solvents. Industrial development and urbanization in developing nations are also driving increased demand for decorative and protective coatings across the automotive, construction, and heavy machinery sectors. This is expected to generate new growth opportunities for the market.
Challenge: Volatility in crude oil prices
Hexane is a product of petroleum refining, which means it is subject to fluctuations in the world‘s crude oil markets. This means the prices of the other inputs are subject to fluctuations in the crude oil market. This also distorts the supply and demand structure, leading to changes in crude oil prices. Since the demand and supply of crude oil depend on various factors, such as geopolitical relations, war, and biofuel demand, this volatility is further heightened. The whole world has witnessed fluctuations due to war, energy demand and production disruptions, which can cause unexpected price fluctuations in crude oil, leading to higher costs for end consumers.
HEXANE MARKET: COMMERCIAL USE CASES ACROSS INDUSTRIES
| COMPANY | USE CASE DESCRIPTION | BENEFITS |
|---|---|---|
 |
n-hexane is used for industrial applications due to its volatility and good solvency for edible oil extraction, solvents, adhesives, and rubber processing. | High extraction efficiency and yield improvement, fast evaporation reduces residue, cost-effective solvent for large-scale processing, consistent purity for industrial applications |
 |
High-purity AlphaPlus n-hexane is used in polymerization processes and specialty chemical synthesis, where controlled impurity levels are critical for catalyst performance. | Ultra-high purity ensures catalyst efficiency, enhances polymer quality and consistency, low sulfur/aromatic content reduces contamination risk; Suitable for high-performance industrial applications |
 |
n-Hexane is utilized in pharmaceutical extraction, fine chemicals, and precision cleaning applications, particularly where controlled evaporation and purity are required. | Reliable purity for regulated industries, effective solvent for delicate extraction processes, low residue post-evaporation, and supports compliance with pharma and specialty chemical standards |
 |
Laboratory-grade n-hexane is widely used in analytical laboratories for chromatography (HPLC/GC), sample preparation, and research applications requiring consistent solvent behavior. | High analytical accuracy and reproducibility, low impurity interference in testing, suitable for sensitive lab environments, consistent batch quality for research reliability |
 |
High-purity n-hexane is used in R&D, pharmaceuticals, and specialty chemical synthesis, including chromatographic separations and reaction media in controlled environments. | Meets stringent laboratory and regulatory standards, high chemical stability and inertness enable precise separation and synthesis, trusted quality for research and industrial validation |
Logos and trademarks shown above are the property of their respective owners. Their use here is for informational and illustrative purposes only.
MARKET ECOSYSTEM
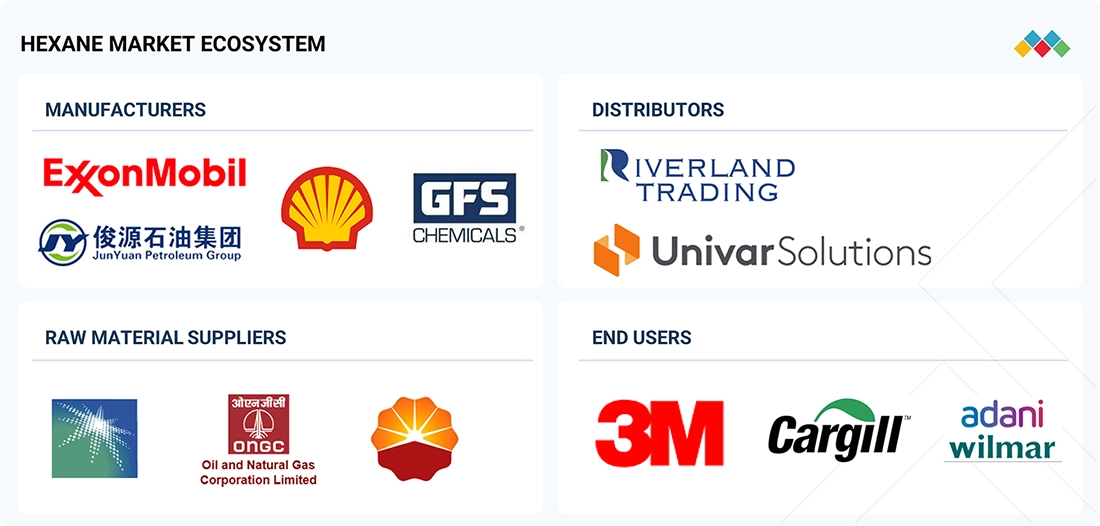
The hexane market ecosystem consists of raw material suppliers (e.g., Saudi Arabian Oil Co., ONGC), producers (e.g., ExxonMobil Corporation, GFS Chemicals), distributors (e.g., Iverland Trading, Univar Solutions), and end users (e.g., Cargill, Adani Wilmar). Hexane is used in various applications, such as oil extraction , pharmaceutical, and others.
Logos and trademarks shown above are the property of their respective owners. Their use here is for informational and illustrative purposes only.
MARKET SEGMENTS
Source: Secondary Research, Interviews with Experts, MarketsandMarkets Analysis
Hexane Market, By Grade
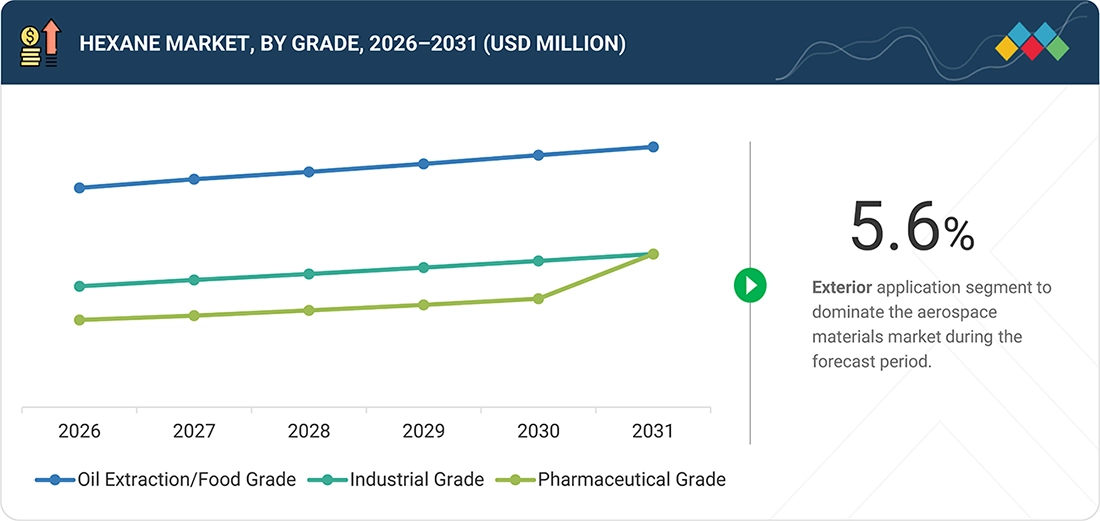
Pharmaceutical-grade hexane is projected to have the highest CAGR during the forecast period. This is mainly because pharmaceutical-grade hexane is increasingly used in high-purity and more regulated applications in the pharmaceutical and healthcare industries. Pharmaceutical-grade hexane has very high purity and low impurity content. Hence, it is used in the most sensitive applications. It can also be used in various processes of drug formulation, the extraction of active pharmaceutical ingredients (API), and purification. It is also valuable for its use in laboratory analysis and research applications, especially in chromatography and solvent extraction used for pharmaceutical testing and development. The pharmaceutical industry, driven by increasing demand for health care and the growing marketing of various generic drugs and specialties, is the major driving force for this segment. The growing emphasis on good manufacturing practices and regulatory compliance is influencing the switch from industrial-grade to pharmaceutical-grade solvents. The pharmaceutical-grade hexane market is also supported by the growing trends in drug development, biotechnology and life science research, where high-purity solvents are required, as well as by the increased demand from contract manufacturing organizations (CMOs) and research labs.
Hexane Market, By Application
The polymerization segment will have the highest CAGR in the hexane market, owing to the growing demand for plastics, synthetic rubbers, and high-performance polymers. Hexane is used as a process solvent and reaction medium for polymer production. The growth of the packaging, automotive, construction, and consumer goods industries significantly increases the demand for high-performance polymers. In terms of volume, bulk production of polymers requires higher, continuous consumption of hexane, whereas in value, emerging specialty polymers and heavy investment in material innovation are driving growth.
REGION
Asia Pacific to be fastest-growing region in global hexane market during forecast period
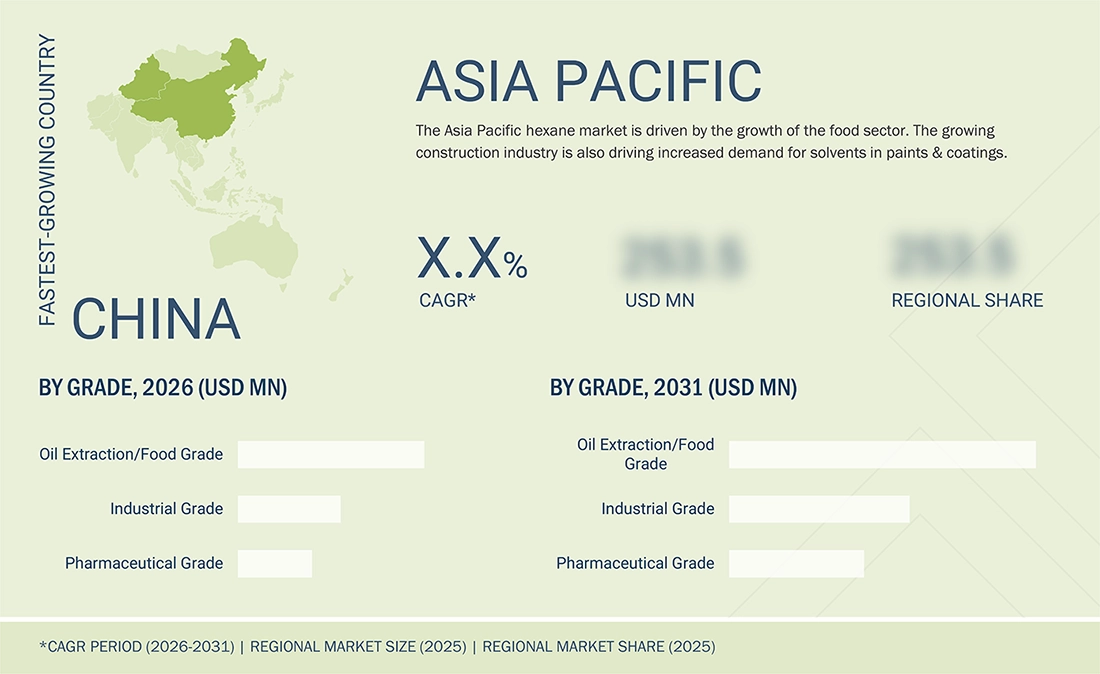
Asia Pacific is projected to have the highest CAGR in the hexane market, owing to the robust economic development in this region, coupled with rapid industrialization. The expanding end-use industries, such as chemically diversified and rapidly burgeoning sectors like edible oils, pharma and consumer goods, are also driving high-volume consumption of hexane in oil extraction and other industrial applications. This region has a very strong textile, automotive, and chemical manufacturing industry. Large production capacities, low cost, and increasing investments in industrial infrastructure are fueling the hexane market in the region.
HEXANE MARKET: COMPANY EVALUATION MATRIX
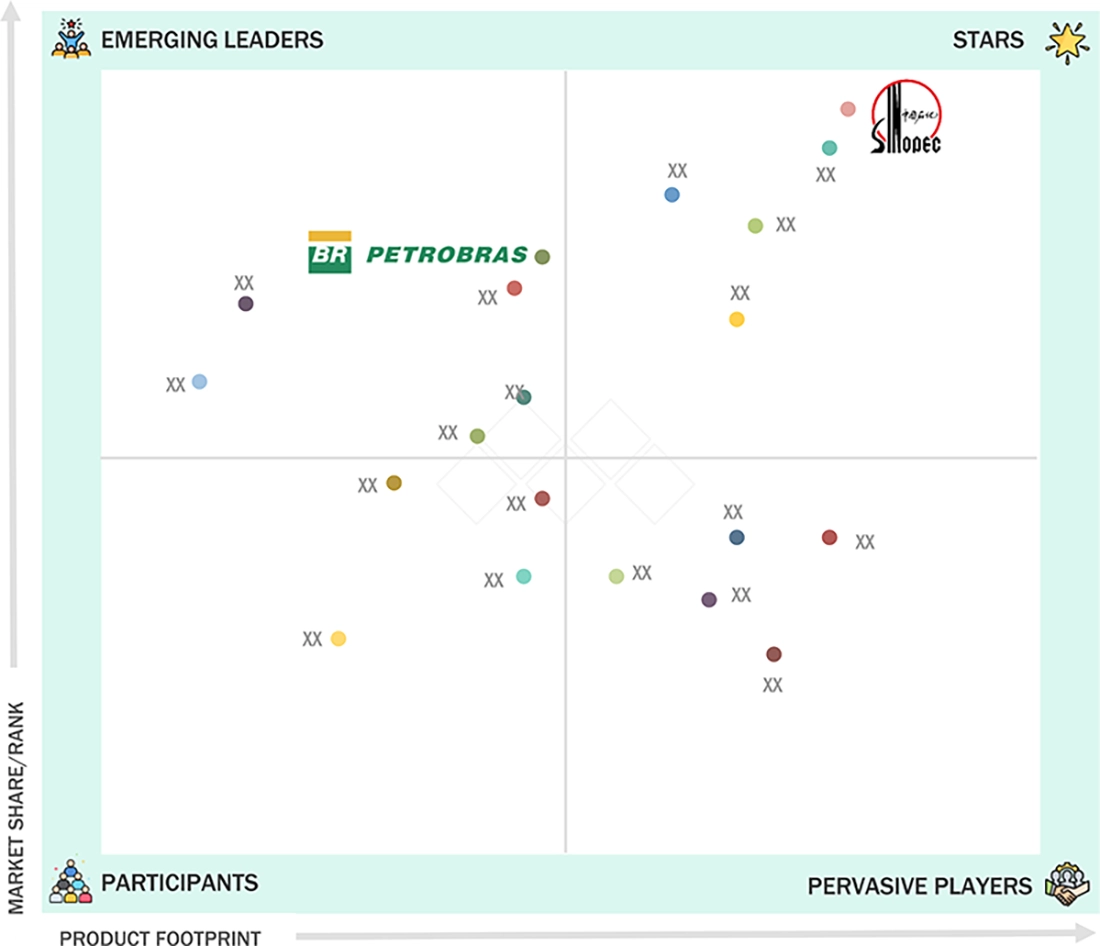
China Petrochemical Corporation (Sinopec) is a key player in the market. It has strong integration across the entire petrochemical value chain and has a large refining and chemical production capacity. In addition, its extensive supply chain network and million-ton crystallization manufacturing base effectively supply products to the demand centers of oil extraction, industrial cleaning, chemical processing, etc., further strengthening the competitiveness of China Petrochemical Corporation. To maintain high production efficiency, China Petrochemical Corporation continuously invests in advancing refining technology and optimizing the production process, such as refining depth and distillation processes, thereby evidently enhancing its competitive strength in the hexane market. In the hexane market, Petrobras is emerging as a leading player, with a noticeable emphasis on petrochemicals and diversification into higher-value chemicals. While capitalizing on its robust upstream crude oil offset and refining infrastructure in Brazil, Petrobras is well positioned to gain market share in solvent and specialty chemicals, including hexane. With better operational efficiency, greater downstream integration and increasing industrial demand from fields such as oil extraction, cleaning & degreasing, and polymerization, Petrobras is cementing its place in the upper reaches of the hexane supply chain. Its ongoing commitment to modernizing its chemical production is positioning it for a gradual foray into the competitive hexane sector. Technical developments and export growth will continue to nudge Petrobras toward a prominent position in the hexane market.
Source: Secondary Research, Interviews with Experts, MarketsandMarkets Analysis
KEY MARKET PLAYERS
- China Petrochemical Corporation (China)
- Shell plc. (London)
- Exxon Mobil Corporation (US)
- Chevron Phillips Chemical Company (US)
- Junyuan Petroleum Group (China)
- TotalEnergies (France)
- Phillips 66 Company ( US)
- Indian Oil Corporation Ltd. ( India)
- Petrobras ( Brazil)
- Hindustan Petroleum Corporation Limited (India)
- Bharat Petroleum Corporation Limited (India)
- Solstice Advanced Materials Inc. (US)
- Haltermann Carless Group (Germany)
- Sumitomo Chemical Co., Ltd. (Japan)
- Tokyo Chemical Industry Co., Ltd. (Japan)
MARKET SCOPE
| REPORT METRIC | DETAILS |
|---|---|
| Market Size in 2025 (Value) | USD 2.75 BN |
| Market Forecast in 2031 (Value) | USD 3.64 BN |
| CAGR (2026–2031) | 4.3% |
| Years Considered | 2022–2031 |
| Base Year | 2025 |
| Forecast Period | 2026–2031 |
| Units Considered | Value (USD Million), and Volume (Kiloton) |
| Report Coverage | Revenue forecast, competitive landscape, growth factors, and trends |
| Segments Covered | By Type: N-hexane, Isohexane, and Neohexane |
| Regions Covered | North America, Europe, Asia Pacific, Middle East & Africa, and South America |
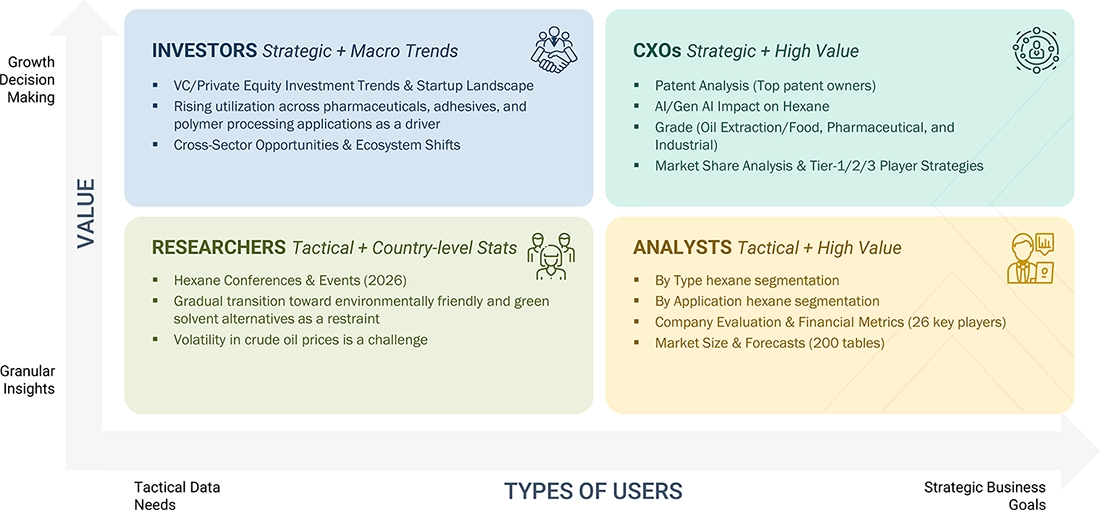
WHAT IS IN IT FOR YOU: HEXANE MARKET REPORT CONTENT GUIDE
DELIVERED CUSTOMIZATIONS
We have successfully delivered the following deep-dive customizations:
| CLIENT REQUEST | CUSTOMIZATION DELIVERED | VALUE ADDS |
|---|---|---|
| Food processing oil manufacturer asking for required grade of hexane to be used in production of edible oils for best extraction efficiency and maximum yield | Comparison of n-hexane to food grade hexane; benchmarking extraction yield; residue compliance analysis (FDA/EFSA standards) | Better extraction yield; less loss of solvent; better regulatory compliance; lowered production cost; improved formulation confidence; reduced compliance risk; optimized additive selection; faster product qualification |
| Pharmaceutical company assessing a high-quality solvent for API synthesis and formulation processes | Impurity profiling of pharmaceutical grade hexane; impurity benchmarking comparison; supplier on performance comparison; regulatory mapping comparison (ICH/USP guidelines) | Enhanced formulation safety; uniform API quality; minimized batch-to-batch differences; conformance to worldwide pharmacopeial/standards |
| A provider of industrial cleaning and maintenance services evaluating solvent performance for use as a degreasing agent | Comparative performance of hexane to other solvent systems (heptane, toluene); study of evaporating rate and cleaning effectiveness; cost-performance analysis | Improved cleaning efficacy; decreased operating time; minimized solvent consumption; cost reduction |
| Polymer and chemical manufacturer studying solvent function in polymerization processes | Decision analysis, including process equality determination, best solvent recovery analysis, best polymer yield increase optimization analysis, and safety and handling considerations | Better quality of polymer; increasing efficiency of process; reduction of production wastes; and more available operational safety |
| Trading and procurement company performing analysis of global supply and checking hexane supply chain and price fluctuations | Supply-demand mapping, regional pricing trend analyzing benchmark against main producers (refining capacity, export flow), risk analysis | Improved procurement strategy; easier to formulate; decrease in price volatility risk; enhances negotiating hold of suppliers; assured long-term sourcing |
RECENT DEVELOPMENTS
- June 2025 : Rompetrol’s Vega refineries increased their hexane production capacity to about 100,000 tons.
- August, 2025 : Rompetrol’s Vega and magtymbua refineries expanded their output production capacity of hexane to meet the higher demand.
- October, 2025 : Junyuan Petroleum launched 99.9% ultra-high-purity n-hexane using advanced separation technology.
Table of Contents
 Exclusive indicates content/data unique to MarketsandMarkets and not available with any competitors.
Methodology
The research methodology used to estimate the current size of the hexane market consisted of four major activities. Extensive secondary research was performed to acquire detailed information about the market, peer markets, and parent markets. These findings, assumptions, and metrics were verified through primary research with experts from both the demand and supply sides of the hexane value chain. Both top-down and bottom-up approaches were used to estimate the total market size. The estimation of market sizes for various segments and subsegments in the market was finalized using the market segmentation and data triangulation techniques.
Secondary Research
The research methodology for estimating and forecasting the hexane market begins with gathering data on key vendors' revenues by doing secondary research. The secondary research process involves consulting a range of secondary sources, including Hoover's, Bloomberg Businessweek, Factiva, the World Bank, and industry-specific journals. These secondary sources encompass annual reports, press releases, investor presentations, white papers, certified publications, articles from recognized authors, regulatory notifications, trade directories, and databases. Also, vendor offerings are taken into consideration to inform market segmentation.
Primary Research
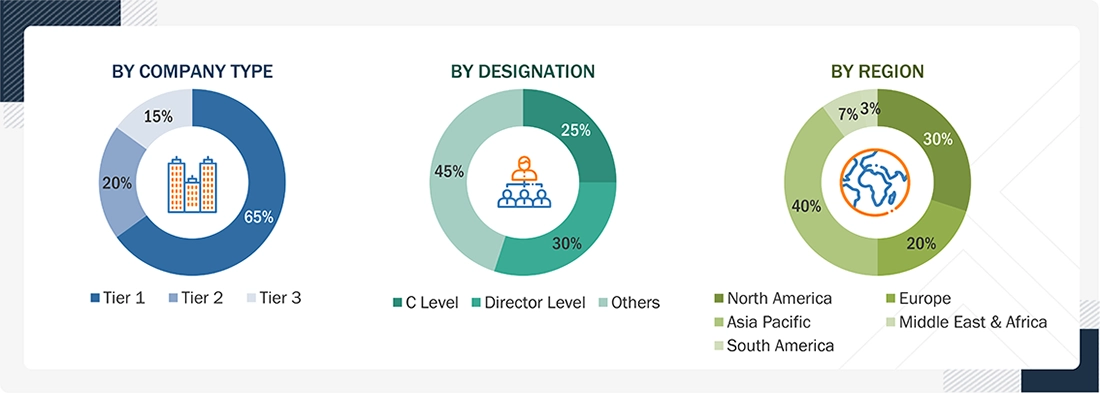
The hexane market comprises several stakeholders, including raw material suppliers, processors, end-product manufacturers, and regulatory organizations, throughout the supply chain. The demand side of this market is characterized by the development of various industries, such as oil extraction, pharmaceutical, industrial cleaning & degreasing, and polymerization, among others. The supply side is characterized by advancements in technology and a wide range of diverse applications. Various primary sources from both the supply and demand sides of the market were interviewed to obtain qualitative and quantitative information. The following is the breakdown of the primary respondents:
To know about the assumptions considered for the study, download the pdf brochure
Market Size Estimation
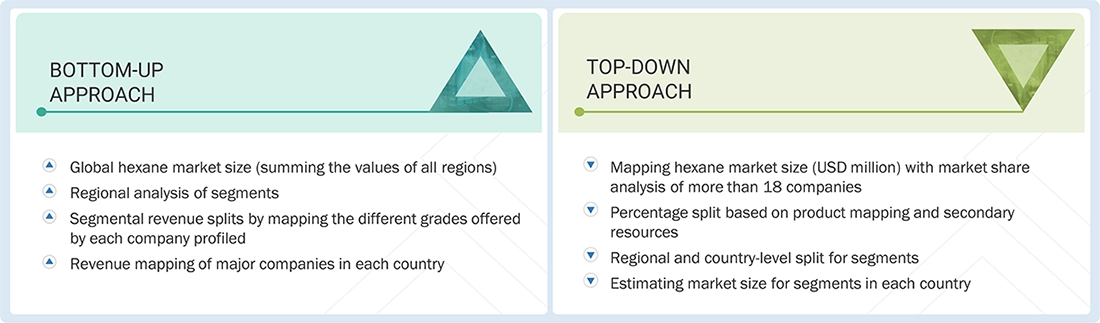
The top-down and bottom-up approaches have been employed to estimate and validate the total size of the hexane market. These approaches have also been used extensively to estimate the size of various dependent market subsegments. The research methodology used to estimate the market size included the following:
The following segments provide details about the overall market size estimation process employed in this study:
- Extensive primary and secondary research was done to identify the key players.
- The value chain and market size of the hexane market, in terms of value, were determined through primary and secondary research.
- All percentage shares, splits, and breakdowns were collected through secondary sources and verified through primary sources.
- All possible parameters that affect the market were covered in this research study and are viewed in extensive detail, verified through primary research, and analyzed to obtain the final quantitative and qualitative data.
- The study of reports, reviews, and newsletters of top market players, along with extensive interviews for opinions from key leaders, such as CEOs, directors, and marketing executives, is included in this research.
Hexane Market : Top-Down and Bottom-Up Approach
Data Triangulation
After estimating the overall market size using the above estimation, the market was split into various segments and subsegments. Data triangulation and market segmentation techniques, along with the market engineering process, were employed to obtain precise market analysis data for each segment and its subsegments.
Research Methodology: The research methodology used to estimate and forecast the global market size began by aggregating data and information from various levels, including country-level data.
Market Definition
Hexane is a petroleum-derived aliphatic hydrocarbon solvent, typically consisting of a mixture of C6 isomers, with n-hexane as the primary component. It is a colorless, volatile liquid with a low boiling point and high evaporation rate, making it highly effective as a non-polar solvent. Hexane is widely used in the extraction of vegetable oils from seeds and biomass, which represents its largest application globally. It is also utilized in adhesives, coatings, polymerization processes, and industrial cleaning and degreasing. In pharmaceutical manufacturing, hexane is used as a process solvent under strict regulatory controls due to its toxicity.
Key Stakeholders
- Hexane Manufacturers, Processors, and Refining Technology Providers
- End-Use/Application, including Oil Extraction, Pharmaceutical, Industrial Cleaning & Degreasing, Polymerization, and Other Applications
- Research Institutions, Standards Organizations, and Regulatory Agencies such as ASTM, EDQM, and Others
- NGOs, Governments, Investment Banks, Venture Capitalists, and Private Equity Firms
Report Objectives
- To define, describe, and forecast the market size of hexane, in terms of value and volume
- To provide detailed information regarding the key factors, such as drivers, restraints, opportunities, and industry-specific challenges, influencing the growth of the hexane market
- To analyze and forecast the size of various segments (grade and application) of the hexane market based on five major regions - North America, Europe, Asia Pacific, the Middle East & Africa, and South America, along with key countries in each of these regions
- To analyze recent developments and competitive strategies, including expansion, product launch, and others, to understand the market's competitive landscape
- To strategically profile the key players in the market and comprehensively analyze their core competencies
Available customizations:
With the given market data, MarketsandMarkets offers customizations according to the client-specific needs.
The following customization options are available for the report:
- Additional country-level analysis of the hexane market
- Profiling of additional market players (up to 5)
Product Analysis
- Product matrix, which provides a detailed comparison of each company's product portfolio.


Personalize This Research
- Triangulate with your Own Data
- Get Data as per your Format and Definition
- Gain a Deeper Dive on a Specific Application, Geography, Customer or Competitor
- Any level of Personalization
Let Us Help You
- What are the Known and Unknown Adjacencies Impacting the Hexane Market
- What will your New Revenue Sources be?
- Who will be your Top Customer; what will make them switch?
- Defend your Market Share or Win Competitors
- Get a Scorecard for Target Partners

Custom Market Research Services
We Will Customise The Research For You, In Case The Report Listed Above Does Not Meet With Your Requirements
Get 10% Free CustomisationTESTIMONIALS

We at Nissan Chemicals Corporation have been clients of MarketsandMarkets for more than a year now. We recently consulted MarketsandMarkets for a study, the team at MarketsandMarkets was extremely professional and organized. The business insights were very detailed and aligned well with our expectations that really helped us formulate the Business Plans and device new strategies for development themes. MarketsandMarkets offers a unique combination of expertise and dedicated engagement model. Their research findings have helped us in designing our Pricing Strategy which will make it easier for us to predict the future sales and profits for the next ten years. We look forward to working with MarketsandMarkets in the future.
VP of Strategy & New Business Development
Leading Specialty Chemical Company
The MarketsandMarkets Engagement Model, composed of both the Knowledge Store and advisory custom research, has greatly helped us in understanding our markets and making strategic decisions. The Knowledge Store is a fast way to allow everyone in our organization to understand more about most any market they are interested in. The ability to then get custom research done and get answers to specific strategic questions and market insight has been spectacular. The Markets and Markets team feel more like colleagues than vendors and their services have helped us change our culture where statements of things like growth opportunities and competitive position are always backed by industry research.

Rich Gibson,
Director, Corporate Strategy
Milliken & Company,
Leading Industrial Manufacturer of specialty chemical, floor covering, performance and protective textile materials, and healthcaremilliken.com
MarketsandMarkets is a trusted resource that helps us to better understand markets that are near-adjacencies-whether its technology, value chain or geography. Their Knowledge Store platform provides a dashboard of markets and their characteristics which is easy to use and saves us time.
Adam Shaw,
Market Development and Strategy Manager
AdvanSix Inc. USA,
An American Leader in Chemicalswww.advansix.com
The Knowledge Store from MarketsandMarkets is a valuable tool which has helped my team acquire greater insight in to the end markets that our business serves. This has enabled us to help our company build stronger strategies throughout our planning process.
TOSHIO KINOSHITA
Senior Chif Consultion Research & Consulting Division
Mitsubishi Chemical Research Corporation,
Leading Manufacturer of Chemical Productswww.mitsubishichem-res.co.jp/en/

We recently engaged with MarketsandMarkets for a study, the team not only clearly understood our business objectives but was also extremely professional in the way they handled the entire project. The study was efficiently conducted in a phase-wise manner, and the engagement model furnished us with high-quality business insights that far exceeded our expectations at each phase. We were especially happy that MarketsandMarkets could provide us with both, an English as well as a Japanese version of the study. A special thanks to the Analyst Team and Client Services Team, whose fluency in Japanese enhanced our comfort level, as we could converse with them in our preferred language.
Independent entrepreneurs
Arrow Precision
We approached MarketsandMarkets for study on Proppants Market, and their work exceeded our expectations. The study conducted was comprehensive and enabled us to view the market through the various dimensions. In addition, the team was extraordinarily responsive throughout the process and resolved our queries on time. I strongly recommend MarketsandMarkets and will certainly consider them for additional market assessments we will need in the future.
Global engineering company, Japan
Deputy Manager,
Strategic Planning OfficeThe high-quality insights shared by the MarketsandMarkets team helped us understand the pharmaceutical plant designers in a specific geography. It also captured the risks that we may likely face in communicating with our potential partners. The study would enable us identify partners, which would impact our future growth.
- Rest Of Europe Hexane Market
- Rest Of Asia Pacific Hexane Market
- GCC Countries Hexane Market
- –Rest Of GCC Countries Hexane Market
- –Saudi Arabia Hexane Market
- Brazil Hexane Market
- Rest Of South America Hexane Market
- China Hexane Market
- India Hexane Market
- Japan Hexane Market
- South Korea Hexane Market
- Canada Hexane Market
- Mexico Hexane Market
- US Hexane Market
- Germany Hexane Market
- UK Hexane Market
- France Hexane Market






Growth opportunities and latent adjacency in Hexane Market