High Dynamic Range Market by Product (Capturing Device (Smartphone, Camera), Display Device (Television, Blu-Ray Players, Set-Top Boxes, Projectors, Laptops & Tablets), Application & Geography - Forecast to 2036


High Dynamic Range Market Summary
The High Dynamic Range (HDR) Market is experiencing strong growth as demand for superior visual quality, enhanced brightness, and improved contrast in digital content continues to rise across consumer electronics, entertainment, gaming, and professional imaging sectors. In 2025, the market size is estimated to be in the range of USD 18.0–22.0 billion and is projected to reach approximately USD 55.0–65.0 billion by 2036, growing at a CAGR of around 10%–12% during the forecast period. The increasing penetration of ultra-high-definition (UHD) displays, rapid growth of streaming platforms, and expanding adoption of advanced imaging technologies are key drivers fueling market expansion.
The integration of artificial intelligence (AI), Internet of Things (IoT), and automation is transforming HDR technology into an intelligent ecosystem. AI-driven image processing enhances dynamic contrast and color accuracy in real time, while IoT-enabled smart devices allow seamless connectivity and synchronized viewing experiences. Automation in content production workflows is accelerating HDR adoption across broadcasting and media industries. As digital transformation continues to reshape content consumption and display technologies, HDR is becoming a standard feature in next-generation visual systems.
Key Market Trends & Insights
North America leads the High Dynamic Range Market, driven by high adoption of advanced consumer electronics, strong presence of content streaming platforms, and rapid innovation in display technologies. Asia Pacific is the fastest-growing region due to increasing demand for smartphones, televisions, and gaming devices, along with expanding manufacturing capabilities. Europe maintains steady growth supported by increasing adoption of UHD broadcasting and premium display solutions.
HDR-enabled televisions dominate the market due to widespread consumer demand for immersive viewing experiences. The growing popularity of HDR content across streaming platforms and gaming consoles is further driving adoption. Emerging trends include the development of HDR10+, Dolby Vision, and hybrid log-gamma (HLG) formats.
AI is playing a critical role in optimizing HDR content by enabling real-time image enhancement and upscaling. Automation in content production and editing workflows is improving efficiency and reducing costs. The integration of HDR with augmented reality (AR) and virtual reality (VR) technologies is opening new opportunities in immersive media experiences.
Market Size & Forecast
- Base year market size (2025): USD 18.0–22.0 billion
- Forecast value by 2036: USD 55.0–65.0 billion
- CAGR: 10%–12%
- Growth is driven by increasing demand for premium visual experiences, expansion of streaming services, and integration of AI and advanced display technologies
High Dynamic Range Market Top 10 key takeaway
- Growing demand for enhanced visual quality and immersive experiences
- Market expected to exceed USD 60 billion by 2036
- North America leads due to advanced technology adoption
- Asia Pacific is the fastest-growing region with high device demand
- HDR-enabled TVs dominate the product segment
- AI enhances image processing and content optimization
- Streaming platforms drive HDR content adoption
- Gaming industry fuels demand for HDR displays
- Integration with AR/VR creates new opportunities
- Automation improves content production efficiency
Product Insights
HDR-enabled televisions represent the leading product segment in the High Dynamic Range Market, driven by strong consumer demand for high-quality viewing experiences. The increasing affordability of HDR TVs and the availability of HDR content on streaming platforms have significantly boosted adoption. These televisions offer superior brightness, contrast, and color accuracy, making them a preferred choice for consumers.
Smartphones and tablets are also significant contributors to market growth, as manufacturers increasingly integrate HDR capabilities into mobile devices to enhance multimedia experiences. The growing popularity of mobile gaming and video streaming is further driving demand in this segment.
Emerging product categories include HDR-enabled cameras, monitors, and projectors, which are gaining traction in professional and commercial applications. AI integration is enabling advanced image processing features such as dynamic tone mapping, real-time enhancement, and adaptive brightness control, further improving user experience.
Technology / Component Insights (Rename based on keyword if needed)
The High Dynamic Range Market is driven by advanced display and imaging technologies, including OLED, QLED, and mini-LED displays. These technologies enable higher brightness levels, deeper blacks, and improved color accuracy, which are essential for HDR performance.
Artificial intelligence is playing a transformative role in HDR technology by enabling real-time image processing, upscaling, and optimization. AI algorithms analyze content and adjust brightness, contrast, and color dynamically to deliver optimal viewing experiences.
IoT integration allows HDR-enabled devices to connect seamlessly with other smart devices, enabling synchronized content delivery and enhanced user control. Cloud-based platforms are supporting content distribution and storage, ensuring accessibility and scalability.
Automation in content production workflows is enabling efficient HDR content creation, editing, and distribution. Future innovation trends include the development of next-generation display technologies, integration with AR/VR systems, and advancements in compression algorithms for efficient content delivery.
Application Insights
Consumer electronics represent the leading application segment in the High Dynamic Range Market, driven by the widespread adoption of HDR-enabled televisions, smartphones, and gaming devices. The demand for high-quality visual experiences is a key factor driving growth in this segment.
The media and entertainment industry is another major application area, where HDR is used in film production, broadcasting, and streaming services to deliver enhanced visual content. The increasing availability of HDR content on streaming platforms is significantly boosting adoption.
Gaming is emerging as a high-growth application segment, with HDR technology enhancing realism and immersion in gaming experiences. Professional applications, including photography, videography, and medical imaging, are also contributing to market growth. Future opportunities lie in AR/VR and metaverse applications, where HDR can enhance immersive experiences.
Regional Insights
North America leads the High Dynamic Range Market, supported by high consumer spending, advanced technological infrastructure, and strong presence of leading technology companies. The region is at the forefront of HDR innovation and content production.
Europe follows with steady growth, driven by increasing adoption of UHD broadcasting, premium consumer electronics, and regulatory support for advanced technologies. The region’s focus on quality and innovation is contributing to market expansion.
Asia Pacific is the fastest-growing region, fueled by rapid urbanization, increasing disposable incomes, and strong demand for consumer electronics. Countries such as China, Japan, and South Korea are major contributors to market growth.
- North America dominates due to advanced technology adoption
- Europe shows steady growth with UHD broadcasting adoption
- Asia Pacific is the fastest-growing region with high device demand
- Rising disposable income drives consumer electronics adoption
- Increasing HDR content availability boosts regional growth
Country-Specific Market Trends
In Asia Pacific, China leads the High Dynamic Range Market with a CAGR of approximately 12%–14%, driven by large-scale manufacturing and high demand for consumer electronics. Japan follows with a CAGR of around 10%–12%, focusing on advanced display technologies and innovation.
In North America, the United States dominates with a CAGR of 11%–13%, supported by strong demand for premium devices and content streaming services. Canada and Mexico are experiencing steady growth due to increasing adoption of HDR-enabled devices.
In Europe, Germany and France are key markets, with CAGR ranging between 9%–11%. These countries are leveraging strong consumer demand and technological advancements to drive market growth.
- China leads in manufacturing and consumer electronics demand
- Japan focuses on innovation in display technologies
- United States drives HDR content and device adoption
- Germany and France lead premium electronics adoption in Europe
- Government initiatives support digital transformation and innovation
Key High Dynamic Range Market Company Insights
The High Dynamic Range Market is highly competitive, with leading companies focusing on innovation, product differentiation, and strategic partnerships. Major players include Samsung Electronics, LG Electronics, Sony Corporation, Panasonic Corporation, Dolby Laboratories, Qualcomm Technologies, Apple Inc., and TCL Technology.
These companies are investing heavily in research and development to enhance HDR performance and integrate AI capabilities. Advanced display technologies, proprietary HDR formats, and smart platforms are key areas of focus.
Strategic collaborations with content providers and streaming platforms are driving market expansion. Companies are also focusing on improving affordability and accessibility of HDR-enabled devices to reach a wider consumer base.
- Strong focus on R&D and technological innovation
- AI integration enhances HDR performance
- Strategic partnerships drive market expansion
- Companies targeting consumer electronics and media sectors
- Development of advanced and cost-effective HDR solutions
Recent Developments
The High Dynamic Range Market has witnessed several notable developments in recent years. Companies have launched next-generation HDR displays with enhanced brightness and color accuracy, supported by AI-driven image processing technologies.
Additionally, partnerships between device manufacturers and streaming platforms are enabling the production and distribution of HDR content. Investments in AR/VR and immersive technologies are further driving innovation in the market.
Market Segmentation
The High Dynamic Range Market is segmented based on product, technology, application, and region. By product, the market includes televisions, smartphones, cameras, and monitors, with televisions dominating due to high consumer demand.
By technology, the market includes OLED, QLED, and other advanced display technologies that enable superior HDR performance. In terms of application, consumer electronics lead the market, followed by media and entertainment, gaming, and professional applications. Regionally, the market is divided into North America, Europe, Asia Pacific, and the Rest of the World, with Asia Pacific expected to witness the highest growth during the forecast period.
- Televisions dominate the product segment
- Advanced display technologies drive innovation
- Consumer electronics remain the largest application segment
- Gaming and media show strong growth potential
- Asia Pacific expected to lead future market expansion
Conclusion
The High Dynamic Range Market is poised for substantial growth through 2036, driven by increasing demand for high-quality visual experiences, advancements in AI and display technologies, and expansion of digital content platforms. The integration of AI, IoT, and automation is transforming HDR into a key component of next-generation visual systems.
As consumer expectations continue to evolve and immersive technologies gain traction, HDR will play a critical role in shaping the future of digital content and display technologies. Companies that invest in innovation and strategic partnerships will be well-positioned to capitalize on the opportunities in this dynamic market.
FAQs
1. What is the current size of the High Dynamic Range Market?
The market size is estimated to be between USD 18.0–22.0 billion in 2025.
2. What is the expected growth rate of the market?
The market is projected to grow at a CAGR of 10%–12% from 2025 to 2036.
3. What are the key drivers of market growth?
Key drivers include increasing demand for premium visual experiences, expansion of streaming services, and integration of AI technologies.
4. Which region leads the High Dynamic Range Market?
North America currently leads the market due to advanced technology adoption and strong consumer demand.
5. Who are the key players in the market?
Major companies include Samsung Electronics, LG Electronics, Sony Corporation, Panasonic Corporation, Dolby Laboratories, Qualcomm Technologies, Apple Inc., and TCL Technology
 Exclusive indicates content/data unique to MarketsandMarkets and not available with any competitors.
Table of Contents
1 Introduction (Page No. - 14)
1.1 Objectives of the Study
1.2 Market Definition
1.3 Study Scope
1.3.1 Markets Covered
1.3.2 Geographic Scope
1.3.3 Years Considered for the Study
1.4 Currency
1.5 Limitations
1.6 Stakeholders
2 Research Methodology (Page No. - 17)
2.1 Research Data
2.1.1 Secondary Data
2.1.1.1 Key Data From Secondary Sources
2.1.2 Primary Data
2.1.2.1 Key Data From Primary Sources
2.1.2.2 Key Industry Insights
2.2 Market Size Estimation
2.3 Market Breakdown and Data Triangulation
2.4 Assumptions
3 Executive Summary (Page No. - 24)
4 Premium Insights (Page No. - 29)
4.1 Attractive Opportunities in the High Dynamic Range Market
4.2 Market–Analysis of Application Areas
4.3 Market–Product Analysis
4.4 Market–Geographical Analysis
5 Market Overview (Page No. - 31)
5.2 Introduction
5.3 High Dynamic Range Imaging Process
5.4 Market Segmentation
5.4.1 Market, By Product
5.4.2 Market, By Application
5.4.3 Market, By Geography
5.5 Market Dynamics
5.5.1 Drivers
5.5.1.1 Growing Demand for Large Screen Displays With High Resolution
5.5.1.2 Economies of Scale in Manufacturing Results Into Less Expensive HDR Products
5.5.1.3 Enormous Potential for Digital Photography
5.5.2 Restraints
5.5.2.1 Broadcasting HDR Content Requires Considerably Higher Bandwidth Than Hd Content
5.5.2.2 Slow Adoption of HDR By the Traditional Imaging Applications
5.5.2.3 Computational Complexity and High Memory Capacity Requirements
5.5.3 Opportunities
5.5.3.1 HDR Pave the Path for A Vast Range of Applications
5.5.3.2 Increased Need for HDR Technology in the Consumer Industry
5.5.4 Challenges
5.5.4.1 Creating Awareness About the HDR Concept Among the Consumers
6 Industry Trends (Page No. - 39)
6.1 Introduction
6.2 Value Chain Analysis
6.3 Porter’s Five Forces Analysis
6.3.1 Threat of New Entrants
6.3.2 Threat of Substitutes
6.3.3 Bargaining Power of Suppliers
6.3.4 Bargaining Power of Buyers
6.3.5 Intensity of Competitive Rivalry
7 High Dynamic Range Market, By Product (Page No. - 45)
7.1 Introduction
7.2 Capturing Devices
7.2.1 Smartphones
7.2.2 Cameras
7.3 Display Devices
7.3.1 Televisions
7.3.2 Blu-Ray Players
7.3.3 Set-Top Boxes
7.3.4 Projectors
7.3.5 Laptops and Tablets
8 High Dynamic Range Market, By Application (Page No. - 63)
8.1 Introduction
8.1.1 Entertainment
8.1.2 Consumer
8.1.3 Security & Surveillance
8.1.4 Others
9 High Dynamic Range Market, By Geography (Page No. - 68)
9.1 Introduction
9.2 North America
9.2.1 U.S.
9.2.2 Canada
9.2.3 Mexico
9.3 Europe
9.3.1 U.K.
9.3.2 Germany
9.3.3 France
9.3.4 Rest of Europe
9.4 Asia-Pacific
9.4.1 China
9.4.2 Japan
9.4.3 South Korea
9.4.4 Others
9.5 Rest of the World (RoW)
9.5.1 Middle East and Africa
9.5.2 South America
10 Competitive Landscape (Page No. - 92)
10.1 Overview
10.2 Major Players in High Dynamic Range Market
10.3 Competitive Situations and Trends
10.3.1 New Product Launches and Developments
10.3.2 New Solutions/Technology Launches, 2013–2016
11 Company Profiles (Page No. - 96)
11.1 Introduction
(Overview, Financials, Products & Services, Strategy, and Developments)*
11.2 Apple, Inc.
11.3 Canon, Inc.
11.4 Nikon Corporation
11.5 Samsung Electronics Co., Ltd.
11.6 LG Display Co., Ltd.
11.7 Casio Computer Co., Ltd.
11.8 Olympus Corporation
11.9 Omnivision Technologies, Inc.
11.10 Pyxalis
11.11 Photonfocus
*Details on Overview, Financials, Product & Services, Strategy, and Developments Might Not Be Captured in Case of Unlisted Companies.
12 Appendix (Page No. - 116)
12.1 Insights of Industry Experts
12.2 Discussion Guide
12.3 Knowledge Store: Marketsandmarkets’ Subscription Portal
12.4 Introducing RT: Real-Time Market Intelligence
12.5 Available Customizations
12.6 Related Reports
List of Tables (78 Tables)
Table 1 Drivers
Table 2 Restraints
Table 3 Opportunities
Table 4 Challenges
Table 5 The Porter’s Five Forces Analysis: Bargaining Power of Suppliers Had the Highest Impact on the Overall Market in 2015
Table 6 High Dynamic Range Market, By Product, 2014–2022 (USD Million)
Table 7 Market Size, By Product, 2014–2022 (Million Units)
Table 8 Market, By Capturing Device, 2014–2022 (USD Million)
Table 9 Market Size, By Capturing Device, 2014–2022 (Million Units)
Table 10 Market for Capturing Devices, By Application, 2014–2022 (USD Million)
Table 11 Market for Capturing Devices, By Region, 2014–2022 (USD Million)
Table 12 Market Size for Capturing Devices, By Region, 2014–2022 (Million Units)
Table 13 Market for Smartphones, By Region, 2014–2022 (USD Million)
Table 14 Market Size for Smartphones, By Region, 2014–2022 (Million Units)
Table 15 Market for Cameras, By Region, 2014–2022 (USD Million)
Table 16 Market Size for Cameras, By Region, 2014–2022 (Million Units)
Table 17 Market, By Display Device, 2014–2022 (USD Million)
Table 18 Market Size, By Display Device, 2014–2022 (Thousand Units)
Table 19 Market Size for Display Devices, By Application, 2014–2022 (USD Million)
Table 20 Market for Display Devices, By Region, 2014–2022 (USD Million)
Table 21 High Dynamic Range Market Size for Display Devices, By Region, 2014–2022 (Thousand Units)
Table 22 Market for Televisions, By Region, 2014–2022 (USD Million)
Table 23 Market Size for Televisions, By Region, 2014–2022 (Million Units)
Table 24 High Dynamic Range Market for Blu-Ray Players, By Region, 2014–2022 (USD Million)
Table 25 Market Size for Blu-Ray Players, By Region, 2014–2022 (Thousand Units)
Table 26 High Dynamic Range Market for Set-Top Boxes, By Region, 2014–2022 (USD Million)
Table 27 Market for Set-Top Boxes, By Region, 2014–2022 (Million Units)
Table 28 Market for Projectors, By Region, 2014–2022 (USD Million)
Table 29 Market Size for Projectors, By Region, 2014–2022 (Thousand Units)
Table 30 Market for Laptops & Tablets, By Region, 2018–2022 (USD Million)
Table 31 Market for Laptops & Tablets, By Region, 2018–2022 (Thousand Units)
Table 32 High Dynamic Range Market Size, By Application, 2014–2022 (USD Million)
Table 33 HDR Market for Entertainment Application, By Product, 2014–2022 (USD Million)
Table 34 Market for Consumer Application, By Product, 2014–2022 (USD Million)
Table 35 High Dynamic Range Market for Security & Surveillance Application, By Product, 2014–2022 (USD Million)
Table 36 Market for Other Applications, By Product, 2014–2022 (USD Million)
Table 37 Market, By Region, 2014–2022 (USD Million)
Table 38 Market Size, By Region, 2014–2022 (Million Units)
Table 39 North America: High Dynamic Range Market, By Country, 2014–2022 (USD Million)
Table 40 Market in North America, By Product, 2014–2022 (USD Million)
Table 41 Market Size in North America, By Product, 2014–2022 (Million Units)
Table 42 Market in North America, By Capturing Device, 2014–2022 (USD Million)
Table 43 Market in North America, By Capturing Device, 2014–2022 (Million Units)
Table 44 Market in North America, By Display Device, 2014–2022 (USD Million)
Table 45 Market in North America, By Display Device, 2014–2022 (Thousand Units)
Table 46 Europe: Market, By Country, 2014–2022 (USD Million)
Table 47 Market in Europe, By Product, 2016–2022 (USD Million)
Table 48 Market in Europe, By Product, 2014–2022 (Million Units)
Table 49 Market in Europe, By Capturing Device, 2014–2022 (USD Million)
Table 50 Market in Europe, By Capturing Device, 2014–2022 (Million Units)
Table 51 High Dyanmic Range Market in Europe, By Display Device, 2014–2022 (USD Million)
Table 52 Market in Europe, By Display Device, 2014–2022 (Thousand Units)
Table 53 APAC: Market Size, By Country, 2014–2022 (USD Million)
Table 54 Market in APAC, By Product, 2014–2022 (USD Million)
Table 55 Marketin APAC, By Product, 2014–2022 (Million Units)
Table 56 Market in APAC, By Capturing Device, 2014–2022 (USD Million)
Table 57 Market Size in APAC, By Capturing Device, 2014–2022 (Million Units)
Table 58 Market in APAC, By Display Device, 2014–2022 (USD Million)
Table 59 Market in APAC, By Display Device, 2014–2022 (Thousand Units)
Table 60 RoW: Market, By Region, 2014–2022 (USD Million)
Table 61 Market in RoW, By Product, 2014–2022 (USD Million)
Table 62 Market in RoW, By Product, 2014–2022 (Million Units)
Table 63 Market in RoW, By Capturing Device, 2014–2022 (USD Million)
Table 64 Market in RoW, By Capturing Device, 2014–2022 (Million Units)
Table 65 Market in RoW, By Display Device, 2014–2022 (USD Million)
Table 66 Market in RoW, By Display Device, 2014–2022 (Thousand Units)
Table 67 New Product Launches, 2013–2016
Table 68 New Solution/Technology Launches , 2013–2016
Table 69 Apple, Inc.: Products Offered
Table 70 Canon, Inc.: Products Offered
Table 71 Nikon Corp.: Products Offered
Table 72 Samsung Electric Co., Ltd.: Products Offered
Table 73 LG Display Co., Ltd.:Products Offered
Table 74 Casio Computer Co., Ltd.: Products Offered
Table 75 Olympus Corp.: Products Offered
Table 76 Omnivision Technologies, Inc.:Products Offered
Table 77 Pyxalis: Products Offered
Table 78 Pyxalis: Products Offered
List of Figures (67 Figures)
Figure 1 High Dynamic Range Market: Research Design
Figure 2 Breakdown of Primaries
Figure 3 Research Methodology
Figure 4 Bottom-Up Approach
Figure 5 Top-Down Approach
Figure 6 Data Triangulation
Figure 7 Market Size: Value (USD Million) vs Volume (Million Units), 2015–2022
Figure 8 Market, Ranking Analysis of Application Areas, 2015
Figure 9 Capturing Devices Expected to Lead the Global High Dynamic Range Market During the Forecast Period
Figure 10 APAC Expected to Witness High Growth in the Market Based on Products Between 2015 and 2022
Figure 11 Global Market Share in 2015
Figure 12 Market Expected to Witness Significant Growth Opportunities Between 2015 and 2022
Figure 13 Entertainment Sector Expected to Lead the Global Market During the Forecast Period
Figure 14 Capturing Devices Expected to Hold the Largest Share of the Global Market During the Forecast Period
Figure 15 APAC Held the Largest Share of the Global Market in 2015
Figure 16 High Dynamic Range Imaging Process
Figure 17 Growing Demand for Large Screen Displays With High Resolution is Driving the Growth of the Market
Figure 18 Value Chain Analysis: Major Value is Added During the Technology Integration & Assembly Phases
Figure 19 Market: Porter’s Five Forces Analysis, 2015
Figure 20 Porters Five Force Analysis of HDR Market
Figure 21 Threat of New Entrants Had A Low Impact
Figure 22 Threat of New Substitutes Was Moderate for the Global HDR Market in 2015
Figure 23 Bargaining Power of Suppliers is High for the HDR Market
Figure 24 Bargaining Power of Buyers Was Medium for HDR Market
Figure 25 Intensity of Competitive Rivalry for the HDR Market Was High in 2015
Figure 26 Capturing Devices Expected to Hold the Largest Share of the Global HDR Market During the Forecast Period
Figure 27 High Dynamic Range Product & Application Mapping
Figure 28 Entertainment Sector Expected to Hold the Largest Market Size for Capturing Devices Between 2016 and 2022
Figure 29 APAC Held the Largest Market Size of the Global High Dynamic Range Market for Capturing Devices in 2015
Figure 30 Market for Display Devices Expected to Be Led By the Entertainment Application During the Forecast Period
Figure 31 APAC Expected to Hold the Largest Market Size in Terms of Value and Volume of the Global HDR Market for Display Devices in 2016
Figure 32 North America Expected to Dominate the HDR Market for Blu-Ray Players During the Forecast Period
Figure 33 Market Size for Laptops & Tablets, in Terms of Value and Volume (2018 vs 2022)
Figure 34 Global High Dynamic Range Market, By Application
Figure 35 Market, By Geography
Figure 36 South Korea to Witness the Highest Growth Rate Between 2016 and 2022
Figure 37 APAC Expected to Lead the Global Market, 2014–2022 (USD Million)
Figure 38 Snapshot of the North American High Dynamic Range Market: Presence of Numerous HDR Image Sensor & Smartphone Manufacturers in the U.S. Leads to Market Growth
Figure 39 Capturing Devices Expected to Hold the Largest Share of the North American Market, Market Size in Terms of Value vs Market Size in Terms of Volume
Figure 40 The Smartphone Segment Dominated the North American HDR Market for Capturing Devices in 2015
Figure 41 Snapshot of the European High Dynamic Range Market: Growth of the Region is Majorly Due to the Commercialized HDR Products
Figure 42 Capturing Devices Expected to Witness Rapid Growth in the European High Dynamic Range Market, 2016–2022, USD Million
Figure 43 The Smartphone Segment Led the European HDR Market for Capturing Devices in 2015
Figure 44 Snapshot of the Market in APAC: High Demand for HDR Products Because of the Majority of the Manufacturers Located in the Region
Figure 45 Capturing Devices Expected to Lead the HDR Market in APAC During the Forecast Period
Figure 46 Smartphone Segment Dominated the HDR Market for Capturing Devices in 2015 (USD Million)
Figure 47 APAC Market for Display Devices Expected to Be Led By Televisions Market in 2016
Figure 48 RoW: Market
Figure 49 Middle East and Africa Estimated to Be the Largest HDR Market in the RoW Region, 2015
Figure 50 Companies Adopted New Product Launches/Developments as the Key Growth Strategy Between 2013 and 2016
Figure 51 Major Companies in the High Dynamic Range Market, 2015
Figure 52 Market Evolution Framework – New Product Launches Fueled Growth and Innovation in the Market Between 2013 and 2016
Figure 53 Battle for Market Share: New Product Launches and Developments Was the Key Growth Strategies
Figure 54 Geographic Revenue Mix of the Market Players, 2014
Figure 55 Apple, Inc.: Company Snapshot
Figure 56 Apple, Inc.: SWOT Analysis
Figure 57 Canon, Inc.: Company Snapshot
Figure 58 Canon, Inc.: SWOT Analysis
Figure 59 Nikon Corporation: Company Snapshot
Figure 60 Nikon Corp.: SWOT Analysis
Figure 61 Samsung Electronics Co., Ltd.: Company Snapshot
Figure 62 Samsung Electronics Co., Ltd.: SWOT Analysis
Figure 63 LG Display Co., Ltd.: Company Snapshot
Figure 64 LG Display Co., Ltd.: SWOT Analysis
Figure 65 Casio Computer Co., Ltd.: Company Snapshot
Figure 66 Olympus Corp.: Company Snapshot
Figure 67 Omnivision Technologies, Inc.: Company Snapshot
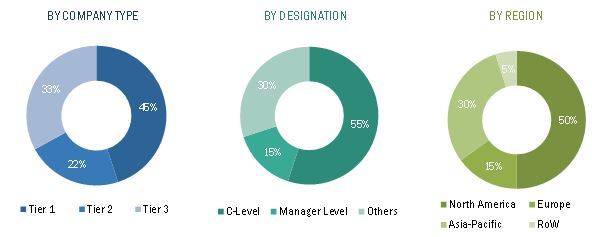
The research methodology used to estimate and forecast the high dynamic range market begins with gathering data on key vendor revenues through secondary research. The vendor offerings are also taken into consideration to determine the market segmentation. The bottom-up procedure has been employed to arrive at the overall size of the global high dynamic range market. After arriving at the overall market size, the total market has been split into several segments and sub-segments, which are then verified through primary research by conducting extensive interviews with key people such as CEOs, VPs, directors, and executives. This data triangulation and market breakdown procedures have been employed to complete the overall market engineering process and arrive at the exact statistics for all segments and sub-segments. The breakdown of profiles of primary is depicted in the below figure:
To know about the assumptions considered for the study, download the pdf brochure
The high dynamic range ecosystem includes high dynamic range manufacturers such as Samsung Electric Co., Ltd. (South Korea), LG Display Co., Ltd. (South Korea), Omnivision Technologies (U.S.), Apple, Inc. (U.S.), Canon, Inc. (Tokyo), Nikon Corp. (Tokyo), Olympus Corp. (Tokyo), Pyxalis (France), Photonfocus (Switzerland), Casio Computer Co., Ltd. (Tokyo) and various consulting firms that sell these high dynamic range solutions to end users to fulfil their business requirements and security needs.
Key Target Audience
- Raw material and manufacturing equipment suppliers
- High dynamic range technology providers
- HDR image sensor manufacturers
- Research institutes and organizations
- Associations and regulatory authorities related to plant maintenance
- Government bodies, venture capitalists, and private equity firms
Scope of the Report
The research report classifies the high dynamic ranges market into the following submarkets:
By Product:
- Capturing Devices
- Display Devices
By Application:
- Consumer
- Entertainment
- Security & Surveillance
- Others
By Geography:
- North America
- Europe
- APAC
- RoW
Available Customizations
With the given market data, MarketsandMarkets offers customizations according the company’s specific needs. The following customization options are available for the report:
Product Analysis
- Product matrix which gives a detailed comparison of the product portfolio of each company
Geographic Analysis
- Further breakdown of the high dynamic ranges market in North America
- Further breakdown of the high dynamic ranges market in Europe
- Further breakdown of the high dynamic ranges market in APAC
- Further breakdown of the high dynamic ranges market in RoW
Company Information
- Detailed analysis and profiling of additional market players


Growth opportunities and latent adjacency in High Dynamic Range Market