High-Performance Trucks Market by Type (Pickup, M&HDV), Power Output (250�400, 401�550, >550 HP), Application (Dumping, Distribution, Refrigeration, Container, Tanker, RMC), Fuel Type, Transmission Type, and Region - Global Forecast to 2025


The high-performance trucks market was 1.7 Million units in 2016 and is estimated to reach 2.5 Million units by 2025, at a CAGR of 4.06% during the forecast period. Increasing demand for special application trucks with high engine power requirement and increasing focus toward fuel economy standards have triggered the growth of the market. Also, increase in demand for long-haul trucks for efficient transportation of goods has also boosted the demand for high-performance trucks globally.
Years Considered for this report:
- 2015: Historical year
- 2016: Base Year
- 2017: Estimated Year
- 2019, 2022, 2025: Forecast Year
- Objectives of the Report
- To define, segment, and forecast the high-performance trucks market (2017–2030), in terms of volume (’000 units)
- To define, describe, and project the market, by power output at country level
- To define, describe, and project the market, by application, by vehicle type, and by fuel type in regions, namely, Asia Oceania, Europe, North America, and the Rest of the World (RoW)
- To define, describe, and project the market, by transmission type in terms of volume (‘000 units) and value (USD million)
- To provide a detailed analysis of various forces acting in the market (drivers, restraints, opportunities, and challenges)
- To analyze the competitive landscape which includes recent developments (new product developments, expansion, mergers & acquisitions, supply contracts/joint ventures) by the OEMs, software/solution providers, Tier-1 companies, and startups
The research methodology used in the report involves primary and secondary sources and follows a bottom-up approach for high-performance trucks market estimation. The study involves country-level model mapping of pickup trucks and medium-& heavy-duty trucks for their technical specifications and filtered the trucks with power output >250 hp. Further, the analysis of different applications considered for high-performance trucks (dumping, distribution, refrigeration, tanker, container, RMC, and special application). This analysis involves historical trends as well as existing penetrations by country as well as application. The analysis is projected based on various factors such as government regulations, key developments, public acceptance, and adoption rate by OEMs. The analysis has been discussed and validated by primary respondents, which include experts from the high-performance trucks OEMs, and Tier I suppliers. Secondary sources include associations such as Green Truck Association (GTA), International Council on Clean Transportation (ICCT), OEMs’ websites and annual reports, and paid databases and directories such as Factiva and Bloomberg.
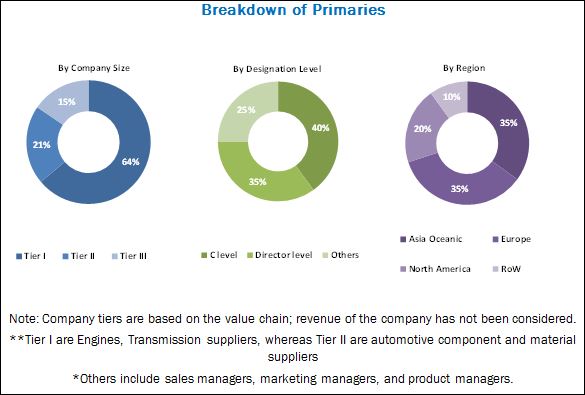
The figure given below illustrates the break-up of the profile of industry experts who participated in primary discussions.
To know about the assumptions considered for the study, download the pdf brochure
The ecosystem of the high-performance trucks market consists Tier I suppliers such as ZF (Germany), Cummins (US), and Eaton (Ireland). These systems and components are supplied to OEMs of medium- & heavy-duty trucks such as Daimler (Germany), Volvo (Sweden), and MAN (Germany). It also includes OEMs of pickup trucks such as Ford (US), GMC (US), and others.
Target Audience
- Medium- and heavy-duty truck OEMs
- Pickup truck OEMs
- Engine suppliers
- Transmission system suppliers
- Alternate fuel technology suppliers
- Industry associations and experts
- Government’s national and regional environmental regulatory agencies or organizations
- The automobile industry and related end-user industries
Scope of the Report
Market, By Transmission Type
Market, By Power Output
Market, By Application
Market, By Vehicle Type
Truck Platooning Market for Artificial Intelligence, By Fuel Type
Market, By Region & Country
-
- Automatic Transmission
- Semi-automatic Transmission
- Manual Transmission
- 250–450 hp
- 401–550 hp
- > 550 hp
- Distribution
- Container
- Dumping
- Refrigeration
- Tanker
- RMC
- Special Application
- Medium- & Heavy-Duty Trucks
- Pickup Trucks
- Diesel
- CNG
- LNG
- Asia Oceania (China, Japan, South Korea, India, and Others)
- Europe (Germany, France, Spain, UK, and Others)
- North America (US, Mexico, and Canada)
- Rest of the World (Brazil, Russia, and Others)
Available Customizations
Market, By Transmission Type (at Country Level)
Market, By Fuel Type (at Country Level)
Market, By Fuel Type (at Country Level)
-
- Automatic Transmission
- Semi-automatic Transmission
- Manual Transmission
- Diesel
- CNG
- LNG
- Medium- & Heavy-Duty Trucks
- Pickup Trucks
(Countries include China, Japan, South Korea, India, Germany, France, UK, Spain, US, Mexico, Canada, Brazil, and Russia)
The high-performance trucks market is projected to grow at a CAGR of 4.06% from 2017 to 2025, and the market size is expected to grow from 1.8 Million units in 2017 to 2.5 Million units by 2025. The increasing demand for enhanced power output engines for carrying heavy loads, owing to the increase in applications requiring high torque/power output is estimated to drive the demand for high-performance trucks. Also, significant investments in road infrastructure and increase in stringency in emission & fuel efficiency regulations are driving the advancements in market, globally.
A semi-automatic transmission is estimated to be the fastest growing segment of the high-performance trucks market, by transmission type. Owing to benefits such as comfort as good as that of automatic transmission system, and fuel efficiency equivalent to manual transmission, at a cost lower than automatic transmission system, the semi-automatic transmission systems are now being preferred in cost-sensitive economies such as Asia Oceania, where the initial cost of the vehicle is a prime factor during the purchasing process.
Pickup trucks are projected to be the fastest and largest growing segment of the high-performance trucks market, by vehicle type, where North America is the leading region. OEMs such as General Motors and Ford, which have a strong presence in the US, are developing light-duty trucks with features such as high-performance, enhanced driver experience, and fuel efficiency. Regulatory bodies in developed and developing nations are emphasizing safety and disaster management by allocating large portions of their budgets. This is also expected to lead to the increased demand for high-performance pickup trucks for safety purposes such as fire and rescue application.
The LNG trucks segment is projected to be the next emerging segment for the high-performance trucks market, in terms of fuel type. The increase in demand can be attributed to factors such as an increase in stringency in emission norms and abundant availability of LNG. The governments of European countries and the US are focusing on the deployment of more alternative fueling stations and promoting the use of alternative commercial vehicles. For instance, the US government has launched J.B. Hunt LNG Truck Project by deploying 262 heavy-duty LNG trucks in Southern California.
In terms of applications, the dumping trucks are estimated to the largest segment for high-performance trucks. Significant investments in infrastructural activities are creating the requirement for dumping with higher power output engines. The governments in developed and developing economies across the world are investing significantly in improving and upgrading their road network facilities which require dumping trucks for carrying the load. For instance, the US government has announced an investment of USD 1 trillion in infrastructure facilities in 2017. Hence, the demand for dumping trucks is increasing globally.
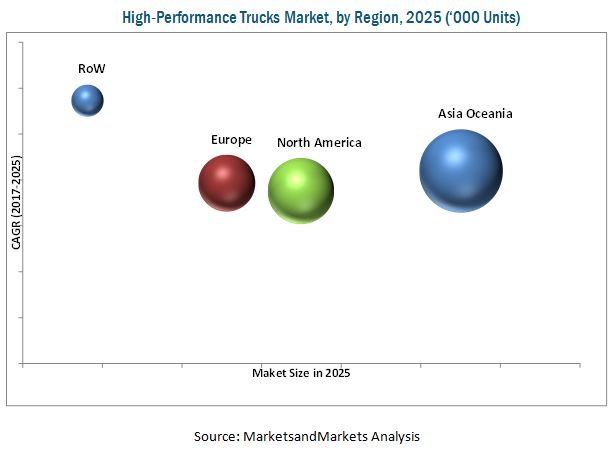
Asia Oceania is estimated to be the largest high-performance trucks market for high-performance trucks, in terms of volume. Trucks are the major contributor to the transportation sector of Asia Oceania. The regulatory developments such as emission norms revisions, axle loading, and a consumer shift toward premium trucks are expected to drive the growth of the transportation industry in the region. Hence, the market is expected to see substantial growth. Also, the infrastructural opportunities for the upcoming Olympic events arranged in South Korea-2018, Japan-2020, and China-2022 would accelerate the market for high-performance dumping trucks to cater the extreme duty application in this region. RoW is estimated to be the fastest growing market for high-performance trucks, in terms of volume. OEMs such as Navistar, Volvo, Daimler, PACCAR, and GAZ Group are expanding into untapped markets in this region, owing to the potential of the Brazilian and Russian markets, and the attractive export opportunities for established markets. The world’s largest beef industry also plays an important role to boost the demand for refrigeration trucks in this region. All these factors have played a vital role to trigger the growth of the market.
The key factors restraining the growth of the high-performance trucks market are the shifting focus toward electric trucks and government incentives to promote electric vehicles. With decreased limits of tail-pipe emissions and increasing fuel-efficiency limits in regulations, the OEMs are focusing on developing electric trucks, which would result in increased electric truck production. Similarly, governments are encouraging the use of electric trucks and investing in building infrastructure for electric trucks. For instance, in 2016, the UK government has announced schemes worth USD 4.52 million for boosting the sale of electric truck and vans in the UK. A few global players dominate the market. Some of the key manufacturers operating in the market are Volvo (Sweden), Daimler (Germany), Scania (Sweden), MAN (Germany), and Allison (US).
To speak to our analyst for a discussion on the above findings, click Speak to Analyst
 Exclusive indicates content/data unique to MarketsandMarkets and not available with any competitors.
Table of Contents
1 Introduction (Page No. - 16)
1.1 Objectives of the Study
1.2 High-Performance Trucks Market Definition
1.3 Market Scope
1.3.1 Years Considered in the Study
1.4 Currency
1.5 Package Size
1.6 Limitations
1.7 Stakeholders
2 Research Methodology (Page No. - 20)
2.1 Research Data
2.2 Secondary Data
2.2.1 Key Secondary Sources
2.2.2 Data From Secondary Sources
2.3 Primary Data
2.3.1 Sampling Techniques & Data Collection Methods
2.3.2 Primary Participants
2.4 Factor Analysis
2.4.1 Introduction
2.4.2 Demand-Side Analysis
2.4.2.1 Infrastructure Readiness for CNG Or LNG Heavy-Duty Trucks
2.4.3 Supply-Side Analysis
2.4.3.1 Engine Downsizing and Demand for Semi-Automatic & Automatic Transmission
2.5 High-Performance Trucks Market Size Estimation
2.5.1 Bottom-Up Approach
2.5.2 Top-Down Approach
2.5.3 Market Breakdown and Data Triangulation
2.6 Assumptions
3 Executive Summary (Page No. - 32)
4 Premium Insights (Page No. - 39)
4.1 Attractive Opportunities in the High-Performance Trucks Market
4.2 Market, By Vehicle Type
4.3 Market, By Power Output
4.4 Market, By Fuel Type
4.5 Market, By Transmission Type
4.6 Market, By Application
4.7 Market, By Region
5 Market Overview (Page No. - 43)
5.1 Introduction
5.1.1 Drivers
5.1.1.1 Stringent Emission Norms
5.1.1.2 Increase in the Supply of Temperature-Sensitive Material Leading to the Demand for Refrigerated High-Performance Trucks
5.1.1.2.1 Growth of Organized Retail Industry
5.1.1.2.2 Increased Demand for Frozen Perishable Commodities
5.1.1.3 Significant Infrastructure Growth
5.1.2 Restraints
5.1.2.1 Electric High-Performance Trucks
5.1.3 Opportunities
5.1.3.1 Alternative Fuel High-Performance Trucks
5.1.3.2 High-Performance Trucks for Special Applications
5.1.3.2.1 Fire Trucks
5.1.3.2.2 Dumping and Container Trucks
5.1.3.2.3 Tanker Trucks
5.1.4 Challenges
5.1.4.1 Shortage of Truck Drivers
5.1.4.1.1 Demographics
5.1.4.1.2 Lifestyle of Truck Drivers
5.1.4.2 Intense Competition in the Truck Industry
6 Impact Analysis (Page No. - 55)
6.1 Impact on Oems and Tier-I Suppliers
6.1.1 Technology Upgradation
6.1.2 Increasing Cost of Technology
6.1.3 Regional Technology Adoption Challenges
6.1.4 Design Complexity
6.1.5 Demand for Alternative Fuel-Powered Vehicles
6.2 Emission Regulations Analysis
6.2.1 European Emission Standards
6.2.2 North American Emission Standards
6.2.2.1 US
6.2.2.2 California
6.2.3 Asia Oceania Emission Standards
6.2.3.1 China
6.2.3.2 India
6.2.3.3 South Korea
6.2.4 RoW Emission Standards
6.2.4.1 Brazil
6.2.4.2 South Africa
7 High-Performance Trucks Market, By Vehicle Type (Page No. - 65)
[Note: The Chapter is Further Segmented By Region (Asia Oceania. Europe, North America, and RoW)]
7.1 Introduction
7.2 Medium- & Heavy-Duty Trucks
7.3 Pickup Trucks
8 High-Performance Trucks Market, By Power Output (Page No. - 70)
[Note: The Chapter is Further Segmented By Region (Asia Oceania. Europe, North America, and RoW)]
8.1 Introduction
8.2 250–400 HP
8.3 401–550 HP
8.4 >550 HP
9 High-Performance Trucks Market, By Application (Page No. - 76)
[Note: The Chapter is Further Segmented By Region (Asia Oceania. Europe, North America, and RoW)]
9.1 Introduction
9.2 Refrigeration
9.3 Dumping
9.4 Special Application
9.5 Tanker
9.6 RMC
9.7 Container
9.8 Distribution
10 High-Performance Trucks Market, By Fuel Type (Page No. - 86)
[Note: The Chapter is Further Segmented By Region (Asia Oceania. Europe, North America, and RoW)]
10.1 Introduction
10.2 Diesel
10.3 CNG
10.4 LNG
11 High-Performance Trucks Market, By Transmission Type (Page No. - 93)
(Note The Chapter is Further Segmented By Region (Asia Oceania. Europe, North America, and RoW))
11.1 Introduction
11.2 Automatic Transmission
11.3 Semi-Automatic Transmission
11.4 Manual Transmission
12 High-Performance Trucks Market, By Region (Page No. - 100)
[Note: The Chapter is Further Segmented By Power Output (250-400 HP, 401-550 HP, >550 HP) and Region (Asia Oceania. Europe, North America, and RoW)]
12.1 Introduction
12.2 Asia Oceania
12.2.1 By Transmission Type
12.2.2 By Power Output
12.2.3 By Country
12.2.3.1 China
12.2.3.2 India
12.2.3.3 Japan
12.2.3.4 South Korea
12.2.3.5 Rest of Asia Oceania
12.3 Europe
12.3.1 By Transmission Type
12.3.2 By Power Output
12.3.3 By Country
12.3.3.1 France
12.3.3.2 Germany
12.3.3.3 Spain
12.3.3.4 UK
12.3.3.5 Rest of Europe
12.4 North America
12.4.1 By Transmission Type
12.4.2 By Power Output
12.4.3 By Country
12.4.3.1 Canada
12.4.3.2 Mexico
12.4.3.3 US
12.5 Rest of the World (RoW)
12.5.1 By Transmission Type
12.5.2 By Power Output
12.5.3 By Country
12.5.3.1 Brazil
12.5.3.2 Russia
12.5.3.3 Rest of the World (RoW) Others
13 Competitive Landscape (Page No. - 123)
13.1 Introduction
13.2 High-Performance Trucks: Market Share Analysis
13.3 Competitive Situation & Trends
13.3.1 Supply Contracts/Partnerships/Joint Ventures
13.3.2 New Product Developments
13.3.3 Expansions
13.3.4 Mergers & Acquisitions
14 Company Profiles (Page No. - 129)
(Overview, Products Offered, Developments, 2014-2017, SWOT Analysis, MnM View)*
14.1 Medium- & Heavy-Duty Commercial Vehicle Manufacturers
14.1.1 Volvo
14.1.2 Daimler
14.1.3 Scania
14.1.4 PACCAR
14.1.5 MAN
14.2 Light Commercial Vehicle Manufacturers
14.2.1 Toyota
14.2.2 Ford
14.2.3 General Motors
14.2.4 FCA
14.2.5 Nissan
14.3 Tier-1 Suppliers
14.3.1 Allison Transmission
14.3.2 ZF
14.3.3 Cummins
14.3.4 Eaton
14.3.5 Product Offering
14.3.6 American Axle
*Details on Overview, Products Offered, Developments, 2014-2017, SWOT Analysis, MnM View Might Not Be Captured in Case of Unlisted Companies.
15 Appendix (Page No. - 172)
15.1 Insights of Industry Experts
15.2 Discussion Guide: High-Performance Trucks Market
15.3 Knowledge Store: Marketsandmarkets’ Subscription Portal
15.4 Introducing RT: Real Time Market Intelligence
15.5 Available Customizations
15.5.1 Market, By Transmission Type (At Country Level)
15.5.1.1 Automatic
15.5.1.2 Semi-Automatic
15.5.1.3 Manual
15.5.2 Market, By Fuel Type (At Country Level)
15.5.2.1 Diesel
15.5.2.2 CNG
15.5.2.3 LNG
15.5.3 Market, By Vehicle Type (At Country Level)
15.5.3.1 Heavy-Duty Trucks
15.5.3.2 Pickup Trucks
15.6 Related Reports
15.7 Author Details
List of Tables (74 Tables)
Table 1 Currency Exchange Rates (W.R.T. USD)
Table 2 Heavy-Duty Vehicle Emission Regulation Scenario for Europe
Table 3 Heavy-Duty Vehicles: Euro Vi Standards
Table 4 European Union On-Road Technology Pathway for Heavy-Duty Diesel Vehicles, 1990-2020
Table 5 US: Engines, Tractors, Trailers, & Vocational Vehicles Phase 2 Requirements
Table 6 US On-Road Technology Pathway for Heavy-Duty Diesel Vehicles, 1998-2021
Table 7 Heavy-Duty Engines, G/BHP·HR: Clean Fuel Fleet Program
Table 8 China: Heavy Duty Engines Emission Standards (G/KWH)
Table 9 India: Heavy-Duty Vehicles Emission Standards
Table 10 High-Performance Trucks Market Size, By Vehicle Type, 2015–2025 (‘000 Units)
Table 11 Medium & Heavy-Duty Trucks: Market Size, By Region, 2015–2025 (’000 Units)
Table 12 Pickup Trucks: Market Size, By Region, 2015–2025 (’000 Units)
Table 13 Market, By Power Output, 2015–2025 (’000 Units)
Table 14 250–400 HP: Market Size, By Region, 2015–2025 (’000 Units)
Table 15 401–550 HP: Market Size, By Region, 2015–2025 (’000 Units)
Table 16 >550 HP: Market Size, By Region, 2015–2025 (’000 Units)
Table 17 Market Size, By Application, 2015–2025 (’000 Units)
Table 18 High-Performance Refrigeration Trucks Market Size, By Region, 2015–2025 (’000 Units)
Table 19 High-Performance Dumping Trucks Market Size, By Region, 2015–2025 (’000 Units)
Table 20 High-Performance Special Application Trucks Market Size, By Region, 2015–2025 (’000 Units)
Table 21 High-Performance Tanker Trucks Market Size, By Region, 2015–2025 (’000 Units)
Table 22 High-Performance RMC Trucks Market Size, By Region, 2015–2025 (’000 Units)
Table 23 High-Performance Container Trucks Market Size, By Region, 2015–2025 (’000 Units)
Table 24 High-Performance Distribution Trucks Market Size, By Region, 2015–2025 (’000 Units)
Table 25 Market, By Fuel Type, 2015–2025 (‘000 Units)
Table 26 Diesel: Market, By Region, 2015–2025 (‘000 Units)
Table 27 CNG: Market, By Region, 2015–2025 (‘000 Units)
Table 28 LNG: Market, By Region, 2015–2025 (‘000 Units)
Table 29 Market Size, By Transmission Type, 2015–2025 (’000 Units)
Table 30 Market Size, By Transmission Type, 2015–2025 (USD Million)
Table 31 Automatic Transmission: Market Size, By Region, 2015–2025 (’000 Units)
Table 32 Automatic Transmission: Market Size, By Region, 2015–2025 (USD Million)
Table 33 Semi-Automatic TransmisHigh-Performance Trucks sion: Market Size, By Region, 2015–2025 (’000 Units)
Table 34 Semi-Automatic Transmission: Market Size, By Region, 2015–2025 (USD Million)
Table 35 Manual Transmission: High-Performance Trucks Market Size, By Region, 2015–2025 (’000 Units)
Table 36 Manual Transmission: Market Size, By Region, 2015–2025 (USD Million)
Table 37 Market, By Region, 2015–2025 (000’ Units)
Table 38 Market, By Power Output, 2015–2025 (000’ Units)
Table 39 Asia Oceania: Market, By Country, 2015–2025 (‘000 Units)
Table 40 Asia Oceania: Market Size, By Transmission Type, 2015–2025 (’000 Units)
Table 41 Asia Oceania: Market Size, By Transmission Type, 2015–2025 (USD Million)
Table 42 Asia Oceania: Market, By Power Output, 2015–2025 (‘000 Units)
Table 43 China: Market, By Power Output, 2015–2025 (‘000 Units)
Table 44 India: Market, By Power Output, 2015–2025 (‘000 Units)
Table 45 Japan: Market, By Power Output, 2015–2025 (‘000 Units)
Table 46 South Korea: Market, By Power Output, 2015–2025 (‘000 Units)
Table 47 Rest of Asia Oceania: Market, By Power Output, 2015–2025 (‘000 Units)
Table 48 Europe: Market, By Country, 2015–2025 (‘000 Units)
Table 49 Europe: Market Size, By Transmission Type, 2015–2025 (’000 Units)
Table 50 Europe: Market Size, By Transmission Type, 2015–2025 (USD Million)
Table 51 Europe: Market, By Power Output, 2015–2025 (‘000 Units)
Table 52 France: HighMarket, By Power Output, 2015–2025 (‘000 Units)
Table 53 Germany: Market, By Power Output, 2015–2025 (‘000 Units)
Table 54 Spain: Market, By Power Output, 2015–2025 (‘000 Units)
Table 55 UK: Market, By Power Output, 2015–2025 (‘000 Units)
Table 56 Rest of Europe: Market, By Power Output, 2015–2025 (‘000 Units)
Table 57 North America: Market, By Country, 2015–2025 (‘000 Units)
Table 58 North America: Market Size, By Transmission Type, 2015–2025 (’000 Units)
Table 59 North America: Market Size, By Transmission Type, 2015–2025 (USD Million)
Table 60 North America: Market, By Power Output, 2015–2025 ('000 Units)
Table 61 Canada: Trucks Market, By Power Output, 2015–2025 (‘000 Units)
Table 62 Mexico: Market, By Power Output, 2015–2025 (‘000 Units)
Table 63 US: Market, By Power Output, 2015–2025 (‘000 Units)
Table 64 RoW: Market, By Country, 2015–2025 ('000 Units)
Table 65 RoW: Market Size, By Transmission Type, 2015–2025 (’000 Units)
Table 66 RoW: Market Size, By Transmission Type, 2015–2025 (USD Million)
Table 67 RoW: Market, By Power Output, 2015–2025 (‘000 Units)
Table 68 Brazil: Market, By Power Output, 2015–2025 (‘000 Units)
Table 69 Russia: Market, By Power Output, 2015–2025 (‘000 Units)
Table 70 RoW Others: Market, By Power Output, 2015–2025 (‘000 Units)
Table 71 Supply Contracts/Partnerships/Joint Ventures, 2014–2017
Table 72 New Product Developments, 2017
Table 73 Expansions, 2016–2017
Table 74 Mergers & Acquisitions, 2015–2017
List of Figures (61 Figures)
Figure 1 High-Performance Trucks Market Segments of High-Performance Trucks
Figure 2 Market: Research Design
Figure 3 Research Methodology Model
Figure 4 Breakdown of Primary Interviews: By Company Type, Designation, & Region
Figure 5 Europe: County Wise Penetration of CNG vs LNG Service Stations, 2017
Figure 6 Market: Bottom-Up Approach
Figure 7 Market: Top-Down Approach
Figure 8 Data Triangulation
Figure 9 250–400 HP Power Output Segment is Estimated to Dominate the Market During the Forecast Period (‘000 Units)
Figure 10 Automatic Transmission Estimated to Be the Largest Segment of Market During the Forecast Period (USD Billion)
Figure 11 High-Performance Pickup Trucks Estimated to Have the Largest Market During the Forecast Period (‘000 Units)
Figure 12 Diesel Fueled Market is Estimated to Dominate the Global Market During the Forecast Period (‘000 Units)
Figure 13 Asia Oceania Holds the Largest Market Share in the Market During the Forecast Period (‘000 Units)
Figure 14 Distribution Application is Estimated to Be the Largest Market in the Market During the Forecast Period (‘000 Units)
Figure 15 Increasing Demand for High Power Output Applications to Drive the Market During the Forecast Period
Figure 16 Pickup Trucks to Be the Fastest Growing Segment During the Forecast Period (Million Units)
Figure 17 Medium- & Heavy-Duty Trucks With 250hp–400hp Power Output to Hold the Largest Market Share By 2025 (‘000 Units)
Figure 18 Diesel High-Performance Trucks to Be the Largest Market During the Forecast Period (‘000 Units)
Figure 19 Semi-Automatic Transmission to Be the Fastest Growing Market During the Forecast Period (USD Billion)
Figure 20 Distribution Application to Dominate the Market During the Forecast Period (‘000 Units)
Figure 21 Asia Oceania to Lead the Market During the Forecast Period (Million Units)
Figure 22 High-Performance Trucks: Market Dynamics
Figure 23 On-Road Heavy-Duty Vehicle Emission Regulation Scenario for Key Countries, 2014-2030
Figure 24 Growing Retail Sales Worldwide Creating Demand for Refrigerated Trucks, 2015-2020
Figure 25 Road Infrastructure Investment for Key Countries, 2010-2015
Figure 26 Global Electric Truck Production, 2015–2022
Figure 27 Total Number of LPG Filling Stations in Europe, 2008-2015
Figure 28 Increasing Driver Shortage in the US, 2014-2024
Figure 29 Market: Impact Analysis
Figure 30 Market, By Vehicle Type, 2017 vs 2025 (’000 Units)
Figure 31 Market, By Power Output, 2017 vs 2025 (‘000 Units)
Figure 32 Market, By Application, 2017 vs 2025 (’000 Units)
Figure 33 Market, By Fuel Type, 2017 vs 2025 (‘000 Units)
Figure 34 Market, By Transmission Type, 2017 vs 2025 (’000 Units)
Figure 35 Market, By Region, 2017 vs 2025 (’000 Units)
Figure 36 Asia Oceania: Market Snapshot
Figure 37 North America: Market Snapshot
Figure 38 Key Development By Leading Players in the Market, 2014-2017
Figure 39 Market Share Analysis: High-Performance Trucks Manufacturers, 2016
Figure 40 Volvo: Company Snapshot (2016)
Figure 41 Volvo: SWOT Analysis
Figure 42 Daimler: Company Snapshot (2016)
Figure 43 Daimler: SWOT Analysis
Figure 44 Scania: Company Snapshot (2016)
Figure 45 PACCAR: Company Snapshot (2016)
Figure 46 MAN: Company Snapshot (2016)
Figure 47 MAN: SWOT Analysis
Figure 48 Toyota: Company Snapshot (2016)
Figure 49 Toyota: SWOT Analysis
Figure 50 Ford: Company Snapshot (2016)
Figure 51 Ford: SWOT Analysis
Figure 52 General Motors: Company Snapshot (2016)
Figure 53 FCA: Company Snapshot (2016)
Figure 54 Nissan: Company Snapshot (2016)
Figure 55 Allison Transmission: Company Snapshot (2016)
Figure 56 ZF: Company Snapshot (2016)
Figure 57 ZF: SWOT Analysis
Figure 58 Cummins: Company Snapshot (2016)
Figure 59 Cummins: SWOT Analysis
Figure 60 Eaton: Company Snapshot (2016)
Figure 61 American Axle: Company Snapshot (2016)


Growth opportunities and latent adjacency in High-Performance Trucks Market