High Pressure Pumps Market by Type (Dynamic and Positive Displacement), Pressure (30 Bar–100 Bar, 101–500 Bar, And Above 500 Bar), End-User (Oil & Gas, Power Generation, Chemical & Pharmaceuticals, and Manufacturing Industries) - Global Forecast to 2021


[132 Pages Report] The global high pressure pumps market was valued at USD 2.26 Billion in 2015, and is expected to grow at a CAGR of 3.2% from 2016 to 2021. Increasing manufacturing and infrastructural activities in Southeast Asia, investments in sectors other than oil & gas in the Middle East & North Africa (MENA), and the growing green chemical industry in the U.S. are the major factors driving the high pressure pump market.
The years considered for the study are as follows:
- Base Year – 2015
- Estimated Year – 2016
- Projected Year – 2021
- Forecast Period – 2016 to 2021
2015 has been considered as the base year for company profiles. Whenever information was unavailable for the base year, the prior year has been considered.
Objectives of the Study
- To define, describe, and forecast the global market by type, pressure, end-user, and region
- To provide detailed information regarding the major factors influencing the growth of the market (drivers, restraints, opportunities, and industry-specific challenges)
- To strategically analyze the market with respect to individual growth trends, future prospects, and contribution of each segment to the market
- To strategically profile key players and comprehensively analyze their market shares and core competencies
- To analyze competitive developments such as contracts & agreements, expansions, new product developments, and mergers & acquisitions in the market
Research Methodology
This research study involved the use of extensive secondary sources, directories, and databases such as Hoovers, Bloomberg Businessweek, Factiva, and OneSource to identify and collect information useful for a technical, market-oriented, and commercial study of the global market. Primary sources are mainly industry experts from core and related industries, preferred suppliers, manufacturers, distributors, service providers, technology developers, standard and certification organizations of companies, and organizations related to all the segments of this industry’s value chain. The points given below explain the research methodology.
- Study of annual revenue and market developments of major players providing high pressure pumps
- Analysis of major applications of and demand for high pressure pumps from end-users
- Assessment of future trends and growth of end-users
- Assessment of the market with respect to the type of high pressure pumps used for different applications
- Analysis of market trends in various regions/countries by studying the application of high pressure pumps in the oil & gas, power generation, water and wastewater treatment, and manufacturing industry
- Study of contracts and developments related to high pressure pumps by key players across different regions
- Finalization of overall market sizes by triangulating the supply-side data, which includes product developments, supply chain, and annual revenues of companies manufacturing high pressure pumps across the globe
After arriving at the overall market size, the total market has been split into several segments and subsegments. The figure given below illustrates the breakdown of primaries conducted during the research study on the basis of company type, designation, and region.
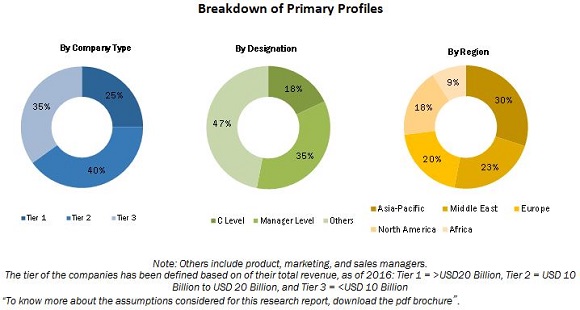
To know about the assumptions considered for the study, download the pdf brochure
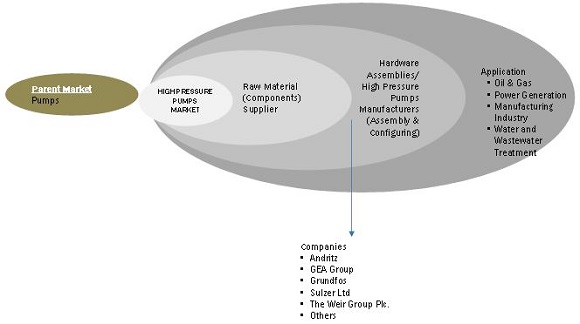
Market Ecosystem:
The ecosystem of the global high pressure pump market starts with the manufacturing of basic components, such as copper and aluminum. The manufactured parts are then assembled by the OEM to form high pressure pumps, which are then tested. This stage is followed by the distribution stage, following which, the product is provided to the end-users.
Target Audience:
The target audience of this report includes:
- High Pressure Pumps Manufacturing Companies
- State and National Regulatory Authorities
- Water Industry Forum
- Process and Manufacturing Plants
- Power Distribution Utilities
- Government and Industry Associations
- State- or Government-Owned Corporations
- Investment and Consulting Firms
Scope of the Report:
- By Type
- Dynamic
- Positive Displacement
- By Pressure
- 30 Bar–100 Bar
- 101 Bar–500 Bar
- Above 500 Bar
- By End-User
- Oil & Gas
- Power Generation
- Manufacturing Industries
- Chemical & Pharmaceuticals
- Others
- By Region
- North America
- Asia-Pacific
- Middle East
- South America
- Africa
- Europe
Available Customizations:
With the given market data, MarketsandMarkets offers customizations as per the client’s specific needs. The following customization options are available for this report:
Regional Analysis
Further breakdown of region/country-specific analysis
Company Information
Detailed analysis and profiling of additional market players (Up to 5)
The global high pressure pumps market is projected to grow at a CAGR of 3.2% from 2016 to 2021, to reach a market size of USD 2.76 Billion by 2021. This growth is attributed to the development of the manufacturing sector in South Asian countries and investments in sectors other than oil & gas in the Middle East and North Africa (MENA) region.
The report segments the market on the basis of type into positive displacement and dynamics. The dynamic segment is projected to dominate the high pressure pumps market.
The market has been segmented based on pressure ranging from 30 bar–100 bar, 101 bar–500 bar, and above 500 bar. The segment ranging from 30 bar–100 bar accounted for the largest market share in 2015. These high pressure pumps are being increasingly adopted due to their wide application in various industries for cleaning purposes.
The report segments the high pressure pump market based on end-user into oil & gas, power generation, chemical & pharmaceuticals, manufacturing industries, and others. The manufacturing industries segment is expected to grow at the fastest rate during the forecast period. Manufacturing industries include textile, food processing, and automotive. The growth of these sectors, particularly food processing and automotive, will likely drive the manufacturing industry segment. This segment is expected to create new revenue pockets for the high pressure pumps market during the forecast period.
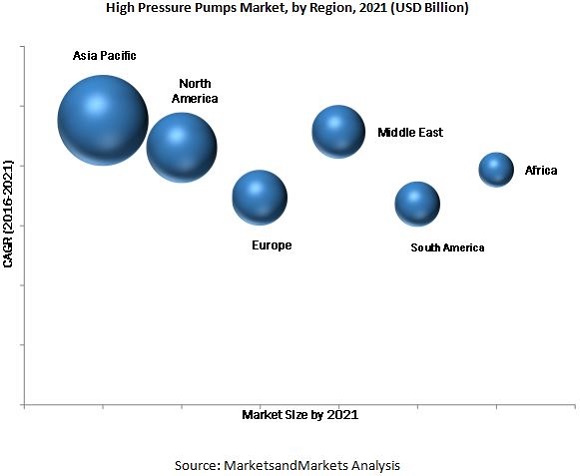
In this report, the market has been analyzed with respect to six regions, namely, North America, Europe, Asia-Pacific, South America, the Middle East, and Africa. Asia-Pacific is expected to dominate the global high pressure pumps market during the forecast period, owing to the extensive use of these devices in manufacturing industries such as steel and automotive, among others.
The Asia-Pacific market is projected to grow at the highest CAGR from 2016 to 2021. The region is the largest market for the construction sector. The growth of the manufacturing sector, especially in Southeast Asian countries, coupled with an increase in power generation capacity in India, is expected to drive the high pressure pumps market in the region.
Increasing fragmentation in the manufacturing of high pressure pumps could be a restraint of the market, leading to declining profits. Additionally, high pressure pumps form a crucial part of the oil & gas sector; its slowdown has hindered the growth of the market.
Leading players in the high pressure pumps market include Andritz (Austria), GEA Group (Germany), Grundfos (Denmark), Sulzer Ltd. (Switzerland), and The Weir Group Plc. (U.K.). Contracts & agreements was the strategy most commonly adopted by the top players, constituting 33% of the total developments from 2013 to 2016. It was followed by expansion, new product development, and mergers & acquisitions.
To speak to our analyst for a discussion on the above findings, click Speak to Analyst
 Exclusive indicates content/data unique to MarketsandMarkets and not available with any competitors.
Table of Contents
1 Introduction (Page No. - 13)
1.1 Objectives of the Study
1.2 Market Definition
1.3 Market Scope
1.3.1 Markets Covered
1.3.2 Years Considered for the Study
1.3.3 Currency
1.4 Limitation
1.5 Stakeholders
2 Research Methodology (Page No. - 16)
2.1 Research Data
2.2 Secondary Data
2.2.1 Key Data From Secondary Sources
2.3 Primary Data
2.3.1 Key Data From Primary Sources
2.3.2 Key Industry Insights
2.4 Breakdown of Primaries
2.5 Market Size Estimation
2.5.1 Bottom-Up Approach
2.5.2 Top-Down Approach
2.6 Data Triangulation
2.7 Research Assumptions
2.7.1 Assumptions
3 Executive Summary (Page No. - 24)
3.1 Introduction
3.1.1 Historical Backdrop
3.2 Current Scenario
3.3 Future Outlook
3.4 Conclusion
4 Premium Insights (Page No. - 29)
4.1 High Pressure Pumps Market, By Type
4.2 Asia-Pacific Held the Largest Share in the Market in 2015
4.3 Asia-Pacific: the Fastest Growing Market for High Pressure Pumps From 2016 to 2021
4.4 High Pressure Pump Market, By End-User
5 Market Overview (Page No. - 33)
5.1 Introduction
5.2 High Pressure Pumps: Market Segmentation
5.2.1 By Type
5.2.2 By Pressure
5.2.3 By End-User
5.2.4 By Region
5.3 Market Dynamics
5.3.1 Drivers
5.3.1.1 Investments in Sectors Other Than Oil & Gas in the Middle East
5.3.1.2 Growth of Manufacturing Sector in South Asia
5.3.2 Restraints
5.3.2.1 Slowdown in Oil & Gas Industry
5.3.2.2 Slowing Industrial Growth in China
5.3.3 Opportunities
5.3.3.1 Carbon Capture and Sequestration
5.3.3.2 Wastewater Treatment Industry
5.3.4 Challenges
5.3.4.1 Growing Gray Market
6 High Pressure Pumps Market, By Type (Page No. - 43)
6.1 Introduction
6.2 Dynamic High Pressure Pump
6.3 Positive Displacement High Pressure Pump
7 High Pressure Pumps Market, By Pressure (Page No. - 47)
7.1 Introduction
8 High Pressure Pumps Market, By End-User Industry (Page No. - 49)
8.1 Introduction
8.2 Power Generation
8.3 Manufacturing Industries
8.4 Chemical & Pharmaceuticals
8.5 Oil & Gas
8.6 Others
9 High Pressure Pumps Market, By Region (Page No. - 56)
9.1 Introduction
9.2 North America
9.2.1 U.S.
9.2.2 Canada
9.2.3 Mexico
9.3 Europe
9.3.1 U.K.
9.3.2 Germany
9.3.3 Italy
9.3.4 Russia
9.3.5 Rest of Europe
9.4 Asia-Pacific
9.4.1 China
9.4.2 India
9.4.3 Australia
9.4.4 Japan
9.4.5 South Korea
9.4.6 Rest of Asia-Pacific
9.5 South America
9.5.1 Brazil
9.5.2 Argentina
9.5.3 Venezuela
9.5.4 Rest of South America
9.6 Middle East
9.6.1 Saudi Arabia
9.6.2 UAE
9.6.3 Iran
9.6.4 Qatar
9.6.5 Rest of the Middle East
9.7 Africa
9.7.1 South Africa
9.7.2 Nigeria
9.7.3 Egypt
9.7.4 Rest of Africa
10 Competitive Landscape (Page No. - 88)
10.1 Overview
10.2 Competitive Situation & Trends
10.3 Contracts & Agreements
10.4 Expansions
10.5 New Product Developments
10.6 Mergers & Acquisitions
11 Company Profile (Page No. - 95)
(Overview, Products & Services, Strategies & Insights, Developments and MnM View)*
11.1 Introduction
11.2 Andritz
11.3 GEA Group
11.4 Grundfos
11.5 Sulzer Ltd.
11.6 The Weir Group PLC.
11.7 Danfoss Group
11.8 CAT Pumps
11.9 Comet S.P.A
11.10 Maximator GmbH
11.11 Teledyne Isco
11.12 Zhejiang Danau Industries Co., Ltd.
11.13 Udor S.P.A
*Details on Overview, Products & Services, Strategies & Insights, Developments and MnM View Might Not Be Captured in Case of Unlisted Companies.
12 Appendix (Page No. - 123)
12.1 Insights of Industry Experts
12.2 Discussion Guide
12.3 Knowledge Store: Marketsandmarkets’ Subscription Portal
12.4 Introducing RT: Real-Time Market Intelligence
12.5 Available Customizations
12.6 Related Reports
12.7 Author Details
List of Tables (64 Tables)
Table 1 High Pressure Pumps Market Size, By Type, 2014–2021 (USD Million)
Table 2 Dynamic: Market Size, By Region, 2014–2021 (USD Million)
Table 3 Positive Displacement: Market Size, By Region, 2014–2021 (USD Million)
Table 4 High Pressure Pumps Market Size, By Pressure, 2014–2021 (USD Million)
Table 5 High Pressure Pumps Market Size, By End-User Industry, 2014–2021 (USD Million)
Table 6 Power Generation: Market Size, By Region, 2014–2021 (USD Million)
Table 7 Manufacturing: Market Size, By Region, 2014–2021 (USD Million)
Table 8 Top 5 Markets in Manufacturing Industry, 2014–2021 (USD Million)
Table 9 Chemical & Pharmaceuticals: Market Size, By Region, 2014–2021 (USD Million)
Table 10 Oil & Gas: Market Size, By Region, 2014–2021 (USD Million)
Table 11 Top 5 Markets in Oil & Gas Industry, 2014–2021 (USD Million)
Table 12 Others: Market Size, By Region, 2014–2021 (USD Million)
Table 13 High Pressure Pumps Market Size, By Region, 2014–2021 (USD Million)
Table 14 Top 5 Fastest Growing Markets in High Pressure Pumps, 2014–2021 (USD Million)
Table 15 Top 5 Largest Markets in High Pressure Pumps, 2014–2021 (USD Million)
Table 16 North America: Market Size, By Country, 2014–2021 (USD Million)
Table 17 North America: By Market Size, By End-User, 2014–2021 (USD Million)
Table 18 North America: By Market Size, By Type, 2014–2021 (USD Million)
Table 19 U.S.: By Market Size, By End-User, 2014–2021 (USD Million)
Table 20 Canada: By Market Size, By End-User, 2014–2021 (USD Million)
Table 21 Mexico: By Market Size, By End-User, 2014–2021 (USD Million)
Table 22 Europe: By Market Size, By Country, 2014–2021 (USD Million)
Table 23 Europe: By Market Size, By End-User, 2014–2021 (USD Million)
Table 24 Europe: By Market Size, By Type, 2014–2021 (USD Million)
Table 25 U.K.: By Market Size, By End-User, 2014–2021 (USD Million)
Table 26 Germany: By Market Size, By End-User, 2014–2021 (USD Million)
Table 27 Italy: By Market Size, By End-User, 2014–2021 (USD Million)
Table 28 Russia: By Market Size, By End-User, 2014–2021 (USD Million)
Table 29 Rest of Europe: By Market Size, By End-User, 2014–2021 (USD Million)
Table 30 Asia-Pacific: By Market Size, By Country, 2014–2021 (USD Million)
Table 31 Asia-Pacific: By Market Size, By End-User, 2014–2021 (USD Million)
Table 32 Asia-Pacific: By Market Size, By Type, 2014–2021 (USD Million)
Table 33 China: By Market Size, By End-User, 2014–2021 (USD Million)
Table 34 India: By Market Size, By End-User, 2014–2021 (USD Million)
Table 35 Australia: By Market Size, By End-User, 2014–2021 (USD Million)
Table 36 Japan: By Market Size, By End-User, 2014–2021 (USD Million)
Table 37 South Korea: By Market Size, By End-User, 2014–2021 (USD Million)
Table 38 Rest of Asia-Pacific: By Market Size, By Power Rating, 2014–2021 (USD Million)
Table 39 South America: By Market Size, By Country, 2014–2021 (USD Million)
Table 40 South America: By Market Size, By End-User, 2014–2021 (USD Million)
Table 41 South America: By Market Size, By Type, 2014–2021 (USD Million)
Table 42 Brazil: By Market Size, By End-User, 2014–2021 (USD Million)
Table 43 Argentina: By Market Size, By End-User, 2014–2021 (USD Million)
Table 44 Venezuela: By Market Size, By End-User, 2014–2021 (USD Million)
Table 45 Rest of South America: By Market Size, By End-User, 2014–2021 (USD Million)
Table 46 Middle East: By Market Size, By Country, 2014–2021 (USD Million)
Table 47 Middle East: By Market Size, By End-User, 2014–2021 (USD Million)
Table 48 Middle East: By Market Size, By Type, 2014–2021 (USD Million)
Table 49 Saudi Arabia: By Market Size, By End-User, 2014–2021 (USD Million)
Table 50 UAE: By Market Size, By End-User, 2014–2021 (USD Million)
Table 51 Iran: By Market Size, By End-User, 2014–2021 (USD Million)
Table 52 Qatar: By Market Size, By End-User, 2014–2021 (USD Million)
Table 53 Rest of the Middle East: By Market Size, By End-User, 2014–2021 (USD Million)
Table 54 Africa: By Market Size, By Country, 2014–2021 (USD Million)
Table 55 Africa: By Market Size, By End-User, 2014–2021 (USD Million)
Table 56 Africa: By Market Size, By Type, 2014–2021 (USD Million)
Table 57 South Africa: By Market Size, By End-User, 2014–2021 (USD Million)
Table 58 Nigeria: By Market Size, By End-User, 2014–2021 (USD Million)
Table 59 Egypt: By Market Size, By End-User, 2014–2021 (USD Million)
Table 60 Rest of Africa: By Market Size, By End-User , 2014–2021 (USD Million)
Table 61 Contracts & Agreements, 2016
Table 62 Expansions, 2013–2016
Table 63 New Product Developments, 2012–2016
Table 64 Mergers & Acquisitions, 2015-2016
List of Figures (50 Figures)
Figure 1 High Pressure Pump Market Segmentation
Figure 2 High Pressure Pump Market: Research Design
Figure 3 Breakdown of Primary Interviews: By Company Type, Designation, & Region
Figure 4 Market Size Estimation Methodology: Bottom-Up Approach
Figure 5 Market Size Estimation Methodology: Top-Down Approach
Figure 6 High Pressure Pumps: Data Triangulationdata
Figure 7 Asia-Pacific Accounted for the Largest Share (By Value) in the Market in 2015
Figure 8 High Pressure Pumps Market Size, By Type, 2016 & 2021 (USD Billion)
Figure 9 Asia-Pacific is Expected to Dominate the High Pressure Pump Market, From 2016 to 2021
Figure 10 Manufacturing Industries: Market Size, By End-User Industry, 2016–2021
Figure 11 Top Market Developments (2014–2015)
Figure 12 Attractive Market Opportunities
Figure 13 Positive Displacement Market Segment is Expected to Grow at the Highest CAGR From 2016 to 2021
Figure 14 Asia-Pacific Accounted for the Largest Share in the Market, 2015
Figure 15 Asia-Pacific is Expected to Grow at Highest CAGR From 2016 to 2021
Figure 16 Manufacturing Industries is Expected to Account for the Largest Share in the High Pressure Pump Market, 2016-2021
Figure 17 High Pressure Pumps By Market Segmentation, By Type, Pressure, End-User, & Region
Figure 18 High Pressure Pump Market: By Type
Figure 19 High Pressure Pump Market: By Pressure
Figure 20 High Pressure Pump Market: By End-User
Figure 21 High Pressure Pump Market: By Region
Figure 22 Market Dynamics: High Pressure Pump Market
Figure 23 Oil & Non-Oil Fiscal Revenue (% of Total Government Revenue), 2015
Figure 24 Average Real GDP Growth, Change From Previous Years
Figure 25 CAPEX of Major Oil & Gas Companies
Figure 26 China: Annual Growth Rate of GDP
Figure 27 Emission Targets in Key Countries By 2020
Figure 28 Dynamic High Pressure Pumps are Expected to Dominate the Market With the Maximum Market Share During the Forecast Period
Figure 29 High Pressure Pumps Market Size, By Pressure, 2016 & 2021
Figure 30 Manufacturing Industries Segment Accounted for the Largest Market Share in 2015
Figure 31 Regional Snapshot: Growing Markets are Emerging as New Hotspots
Figure 32 High Pressure Pumps Market Size, By Region, 2016–2021 (USD Million)
Figure 33 Regional Snapshot: North America
Figure 34 Regional Snapshot: Asia-Pacific
Figure 35 Companies Adopted Contracts & Agreements as the Key Growth Strategy, 2012-2016
Figure 36 Market Share Analysis, By Revenue, 2015
Figure 37 Market Evaluation Framework, 2012–2016
Figure 38 Battle for Market Share: New Product Launch Was the Key Strategy, 2012–2016
Figure 39 Regional Revenue Mix of the Top 5 Market Players
Figure 40 Andritz: Company Snapshot
Figure 41 Andritz: SWOT Analysis
Figure 42 GEA Group: Company Snapshot
Figure 43 GEA Group: SWOT Analysis
Figure 44 Grundfos: Company Snapshot
Figure 45 Grundfos: SWOT Analysis
Figure 46 Sulzer Ltd.: Company Snapshot
Figure 47 Sulzer Ltd.: SWOT Analysis
Figure 48 The Weir Group PLC.: Company Snapshot
Figure 49 The Weir Group PLC.: SWOT Analysis
Figure 50 Danfoss Group: Company Snapshot


Growth opportunities and latent adjacency in High Pressure Pumps Market