High Purity Alumina Market by Purity Level (4N, 5N, 6N), by Application (Light Emitting Diode, Semiconductor, Phosphor, Sapphire, Others), by Region (Asia Pacific, North America, Europe, Rest of the World) - Global Forecast to 2020


[138 Pages Report] The global high purity alumina (HPA) market was valued at USD 1.73 Billion in 2014, and is projected to reach USD 5.09 Billion by 2020, at a CAGR of 20.1% between 2015 and 2020. The global HPA market has been categorized on the basis of purity level, application, and region. In terms of value, the 4N segment led the global HPA market in 2014. Furthermore, various applications included in the study are LED, semiconductor, phosphor, sapphire, and others. The LED application accounted for the largest share of the global high purity alumina market in 2014. This large share is mainly attributed to the increasing demand of HPA in LEDs for various applications, such as home lighting, televisions, hybrid cars, and electric vehicles. On the basis of region, the high purity alumina market has been classified into Asia-Pacific, North America, Europe, and RoW. Among all regions, Asia-Pacific led the global high purity alumina market in 2014, owing to the increasing demand of HPA in the electronics sector in this region.
The research methodology used to estimate and forecast the global HPA market begins with capturing data on key vendor revenues through secondary research. The vendor offerings are also taken into consideration to determine the market segmentation. The bottom-up procedure was employed to arrive at the overall market size of the global HPA market. After arriving at the overall market size, the total market was split into several segments and subsegments, which were later verified through primary research by conducting extensive interviews with key personnel, such as CEOs, VPs, directors, and executives. This data triangulation and market breakdown procedures were employed to complete the overall market engineering process and arrive at the exact statistics for all segments and subsegments of the market. The breakdown of profiles of primaries is depicted in the figure below.
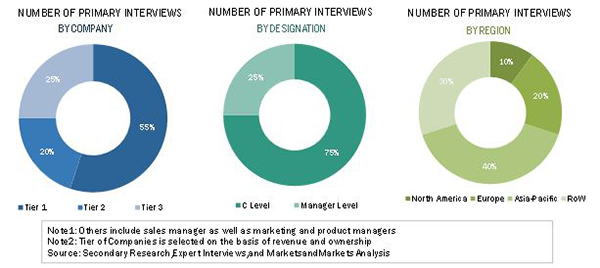
To know about the assumptions considered for the study, download the pdf brochure
The high purity alumina market has a diversified ecosystem of upstream players, including raw material suppliers, along with downstream stakeholders, vendors, end users, and government organizations. Key players in this market include Altech Chemicals Limited (Australia), Alcoa Inc. (U.S.), Orbite Technologies Inc. (Canada), RUSAL (Russia), and Sumitomo Chemical Co., Ltd. (Japan), among others. The government and research organizations, raw material suppliers and distributors, construction companies, and industry associations are considered as critical stakeholders in this study.
Target Audience
- High Purity Alumina (HPA) Producers
- HPA Traders, Distributors, and Suppliers
- End-User Industries
- Associations and Industry Bodies
This study answers several questions for the stakeholders, primarily which market segments to focus in the next two to five years for prioritizing the efforts and investments�.
Scope of the report: This research report categorizes the global HPA market on the basis of purity level, application, and region. It forecasts market volume and value as well as analyzes key trends in each of the submarkets mentioned below.
On the basis of Purity Level, the global HPA market has been segmented into:
- 4N
- 5N
- 6N
On the basis of Application, the global HPA market has been segmented into:
- LED
- Semiconductor
- Phosphor
- Sapphire
- Others
On the basis of Region, the global HPA market has been segmented into:
- North America
- Asia-Pacific
- Europe
- RoW
The following customization options are available for the report:
- Further country-wise breakdown of the global HPA market
- Company information
- Detailed analysis and profiling of additional market players (Up to three)
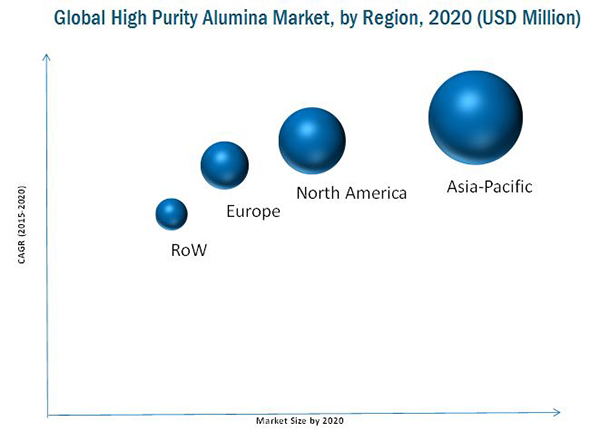
The global high purity alumina (HPA) market was valued at USD 1.73 Billion in 2014, and is projected to reach USD 5.09 Billion by 2020, at a CAGR of 20.1% from 2015 to 2020. Increase in demand of HPA in varied applications, such as LED, semiconductor, phosphor, and sapphire, among others is fueling the growth of this market.
Among all applications, the LED segment led the high purity alumina market in 2014. More than half of the production of high purity alumina is used in lighting, automobile headlights, and mobile phones backlights, among others.
The shift from traditional incandescent light bulbs to energy-efficient and sustainable LED lighting systems has helped in increasing the overall demand for LEDs. The growing usage of LED lighting by both developed and emerging countries is projected to drive the demand for LED application segment in the high purity alumina market.
On the basis of purity level, the high purity alumina market is segmented into 4N, 5N, and 6N. 4N high purity alumina serves to be the main source material used in the development of scratch-resistant artificial sapphire glass. They are also utilized in smartphones and portable tablet devices.
The price of HPA depends on its impurity profile (that is, the content of silica and iron), product type (powder, block, cake, seed, pellets, ball, and ingot), and product characteristics (particle size and density). HPA prices are expected to decrease owing to its increased supply from small producers in China.
Asia-Pacific held the largest share in the global high purity alumina market in 2014. The high purity alumina market in the Asia-Pacific region is projected to grow at the highest CAGR during the forecast period. China dominates the HPA market in the Asia-Pacific region, owing to technological advancements made in the electronics sector in this country.
Expansions, new product/technology launches, joint ventures, agreements, and acquisitions are some of the most essential strategies adopted by key market players to achieve growth in the global high purity alumina market. Companies such as Altech Chemicals Limited (Australia), Alcoa Inc. (New York), Orbite Technologies Inc. (Canada), Sumitomo Chemical Co., Ltd. (Japan), and Bukowski (France) are actively present in the high purity alumina market.
To speak to our analyst for a discussion on the above findings, click Speak to Analyst
 Exclusive indicates content/data unique to MarketsandMarkets and not available with any competitors.
Table of Contents
1 Introduction (Page No. - 15)
1.1 Objectives of the Study
1.2 Market Definition
1.3 Scope of the Study
1.3.1 Regional Scope
1.3.2 Markets Covered
1.3.3 Years Considered in the Report
1.3.4 Currency
1.3.5 Package Size
1.3.6 Stakeholders
2 Research Methodology (Page No. - 18)
2.1 Research Data
2.1.1 Secondary Sources
2.1.1.1 Key Data From Secondary Sources
2.1.2 Primary Sources
2.1.2.1 Key Data From Primary Sources
2.1.2.2 Key Industry Insights
2.2 Market Size Estimation
2.3 Market Breakdown & Data Triangulation
2.4 Market Share Estimation
2.4.1 Assumptions
2.4.2 Limitations
3 Executive Summary (Page No. - 26)
4 Premium Insights (Page No. - 30)
4.1 Attractive Opportunities in the High Purity Alumina Market
4.2 Global High Purity Alumina Market
4.3 Market Scenario in Asia-Pacific
4.4 Market Attractiveness, By Purity Level (2020)
4.5 Life Cycle Analysis, By Region
4.6 Parent Market Data
4.7 World Alumina Market Production Data (Metric Tons) (2015)
5 Market Overview (Page No. - 37)
5.1 Introduction
5.1.1 Drivers
5.1.1.1 Increase in Demand of High Purity Alumina From the LED Industry
5.1.1.2 Increase in Demand of High Purity Alumina From the Asia-Pacific Region
5.1.1.3 No Substitutes Available
5.1.2 Restraints
5.1.2.1 High Cost of Production
5.1.3 Opportunities
5.1.3.1 Increasing Applicability of High Purity Alumina in the Sapphire Market
5.1.3.2 Increasing Demand of High Purity Alumina in the Electronics and Automotive Industries
5.1.4 Challenges
5.1.4.1 Government Regulations on Emissions
6 Industry Trends (Page No. - 42)
6.1 Introduction
6.2 Value Chain Analysis
6.3 Raw Material Suppliers
6.4 High Purity Alumina Manufacturers
6.5 High Purity Alumina Distributors
6.6 End Users
6.7 Porter�s Five Forces Analysis
6.7.1 Threat of New Entrants
6.7.2 Threat of Substitutes
6.7.3 Bargaining Power of Suppliers
6.7.4 Bargaining Power of Buyers
6.7.5 Intensity of Competitive Rivalry
7 High Purity Alumina Market, By Purity Level (Page No. - 46)
7.1 Introduction
7.2 4N Purity Level
7.3 5N Purity Level
7.4 6N Purity Level
8 High Purity Alumina Market, By Application (Page No. - 52)
8.1 Introduction
8.1.1 LED
8.1.2 Semiconductor
8.1.3 Phosphor
8.1.4 Sapphire
8.1.5 Others
9 Regional Analysis (Page No. - 59)
9.1 Introduction
9.2 Asia-Pacific
9.2.1 China
9.2.2 Japan
9.2.3 India
9.2.4 South Korea
9.2.5 Rest of Asia-Pacific
9.3 North America
9.3.1 U.S.
9.3.2 Canada
9.3.3 Mexico
9.4 Europe
9.4.1 Germany
9.4.2 France
9.4.3 U.K.
9.4.4 Italy
9.4.5 Rest of Europe
9.5 RoW
10 Competitive Landscape (Page No. - 96)
10.1 Overview
10.2 Expansions and Agreements: the Most Popular Growth Strategies
10.3 Maximum Developments in 2012
10.4 Competitive Situations and Trends
10.4.1 Expansions
10.4.2 Agreements
10.4.3 Joint Ventures/Collaborations
10.4.4 Divestments
10.4.5 Mergers & Acquisitions
10.4.6 New Technology Developments
11 Company Profiles (Page No. - 103)
(Overview, Financial*, Products & Services, Strategy, and Developments)
11.1 Introduction
11.2 Altech Chemicals Ltd.
11.3 Alcoa Inc.
11.4 Orbite Technologies
11.5 Sumitomo Chemical Co., Ltd.
11.6 Baikowski Pure Solutions
11.7 Nippon Light Metal Company Ltd.
11.8 Rusal
11.9 Sasol
11.10 Xuancheng Jingrui New Material Co., Ltd.
11.11 Dalian Hiland Photoelectric Material Co., Ltd.
*Details Might Not Be Captured in Case of Unlisted Companies
12 Appendix (Page No. - 126)
12.1 Discussion Guide
12.2 Patents
12.2.1 U.S. Patents
12.2.2 China Patents
12.2.3 Europe Patents
12.2.4 International Patents
12.2.5 Germany Patents
12.2.6 Canada Patents
12.3 Knowledge Store: Marketsandmarkets� Subscription Portal
12.4 Introducing RT: Real-Time Market Intelligence
12.5 Available Customizations
12.6 Related Reports
List of Tables (108 Tables)
Table 1 Market for 4N Purity Level is Projected to Witness High Growth
Table 2 World Bauxite Mine Production and Reserves, 2014 (Thousand Metric Tons)
Table 3 Impact of High Purity Alumina Market Drivers (2015�2020)
Table 4 Impact of Market Restraints (2015-2020)
Table 5 Impact of Market Opportunities (2015-2020)
Table 6 Impact of Market Challenges (2015-2020)
Table 7 High Purity Alumina Market, By Purity Level, 2013�2020 (USD Million)
Table 8 Market, By Purity Level, 2013�2020 (Tons)
Table 9 4N Purity Level Market, By Region, 2013�2020 (USD Million)
Table 10 4N Purity Level Market, By Region, 2013�2020 (Tons)
Table 11 5N Purity Level Market, By Region, 2013�2020 (USD Million)
Table 12 5N Purity Level Market, By Region, 2013�2020 (Tons)
Table 13 6N Purity Level Market, By Region, 2013�2020 (USD Million)
Table 14 6N Purity Level Market, By Region, 2013�2020 (Tons)
Table 15 Market, By Application, 2013�2020 (USD Million)
Table 16 Market, By Application, 2013�2020 (Tons)
Table 17 Market in LED, By Region, 2013�2020 (USD Million)
Table 18 Market in LED, By Region, 2013�2020 (Tons)
Table 19 Market in Semiconductor, By Region, 2013�2020 (USD Million)
Table 20 Market in Semiconductor, By Region, 2013�2020 (Tons)
Table 21 Market in Phosphor, By Region, 2013�2020 (USD Million)
Table 22 Market in Phosphor, By Region, 2013�2020 (Tons)
Table 23 Market in Sapphire, By Region, 2013�2020 (USD Million)
Table 24 Market in Sapphire, By Region, 2013�2020 (Tons)
Table 25 Market in Others, By Region, 2013�2020 (USD Million)
Table 26 Market in Others, By Region, 2013�2020 (Tons)
Table 27 Market, By Region, 2013�2020 (USD Million)
Table 28 Market, By Region, 2013�2020 (Tons)
Table 29 Asia-Pacific High Purity Alumina Market, By Purity Level, 2013�2020 (USD Million)
Table 30 Asia-Pacific Market, By Purity Level, 2013�2020 (Tons)
Table 31 Asia-Pacific Market, By Country, 2013�2020 (USD Million)
Table 32 Asia-Pacific Market, By Country, 2013�2020 (Tons)
Table 33 Asia-Pacific Market, By Application, 2013�2020 (USD Million)
Table 34 Asia-Pacific Market, By Application, 2013�2020 (Tons)
Table 35 China Market, By Purity Level, 2013�2020 (USD Million)
Table 36 China Market, By Purity Level, 2013�2020 (Tons)
Table 37 China Market, By Application, 2013�2020 (USD Million)
Table 38 China Market, By Application, 2013�2020 (Tons)
Table 39 Japan Market, By Purity Level, 2013�2020 (USD Million)
Table 40 Japan Market, By Purity Level, 2013�2020 (Tons)
Table 41 Japan Market, By Application, 2013�2020 (USD Million)
Table 42 Japan Market, By Application, 2013�2020 (Tons)
Table 43 India Market, By Purity Level, 2013�2020 (USD Million)
Table 44 India Market, By Purity Level, 2013�2020 (Tons)
Table 45 India Market, By Application, 2013�2020 (USD Million)
Table 46 India Market, By Application, 2013�2020 (Tons)
Table 47 South Korea Market, By Purity Level, 2013�2020 (USD Million)
Table 48 South Korea Market, By Purity Level, 2013�2020 (Tons)
Table 49 South Korea Market, By Application, 2013�2020 (USD Million)
Table 50 South Korea Market, By Application, 2013�2020 (Tons)
Table 51 Rest of Asia-Pacific High Purity Alumina Market, By Purity Level, 2013�2020 (USD Million)
Table 52 Rest of Asia-Pacific Market, By Purity Level, 2013�2020 (Tons)
Table 53 Rest of Asia-Pacific Market, By Application, 2013�2020 (USD Million)
Table 54 Rest of Asia-Pacific Market, By Application, 2013�2020 (Tons)
Table 55 North America High Purity Alumina Market, By Purity Level, 2013�2020 (USD Million)
Table 56 North America Market, By Purity Level, 2013�2020 (Tons)
Table 57 North America Market, By Country, 2013�2020 (USD Million)
Table 58 North America Market, By Country, 2013�2020 (Tons)
Table 59 North America Market, By Application, 2013�2020 (USD Million)
Table 60 North America Market, By Application, 2013�2020 (Tons)
Table 61 U.S. Market, By Purity Level, 2013�2020 (USD Million)
Table 62 U.S. Market, By Purity Level, 2013�2020 (Tons)
Table 63 U.S. Market, By Application, 2013�2020 (USD Million)
Table 64 U.S. Market, By Application, 2013�2020 (Tons)
Table 65 Canada Market, By Purity Level, 2013�2020 (USD Million)
Table 66 Canada Market, By Purity Level, 2013�2020 (Tons)
Table 67 Canada Market, By Application, 2013�2020 (USD Million)
Table 68 Canada Market, By Application, 2013�2020 (Tons)
Table 69 Mexico Market, By Purity Level, 2013�2020 (USD Million)
Table 70 Mexico Market, By Purity Level, 2013�2020 (Tons)
Table 71 Mexico Market, By Application, 2013�2020 (USD Million)
Table 72 Mexico Market, By Application, 2013�2020 (Tons)
Table 73 Europe High Purity Alumina Market, By Purity Level, 2013�2020 (USD Million)
Table 74 Europe Market, By Purity Level, 2013�2020 (Tons)
Table 75 Europe Market, By Country, 2013�2020 (USD Million)
Table 76 Europe Market, By Country, 2013�2020 (Tons)
Table 77 Europe Market, By Application, 2013�2020 (USD Million)
Table 78 Europe Market, By Application, 2013�2020 (Tons)
Table 79 Germany Market, By Purity Level, 2013�2020 (USD Million)
Table 80 Germany Market, By Purity Level, 2013�2020 (Tons)
Table 81 Germany Market, By Application, 2013�2020 (USD Million)
Table 82 Germany Market, By Application, 2013�2020 (Tons)
Table 83 France Market, By Purity Level, 2013�2020 (USD Million)
Table 84 France Market, By Purity Level, 2013�2020 (Tons)
Table 85 France Market, By Application, 2013�2020 (USD Million)
Table 86 France Market, By Application, 2013�2020 (Tons)
Table 87 U.K. Market, By Purity Level, 2013�2020 (USD Million)
Table 88 U.K. Market, By Purity Level, 2013�2020 (Tons)
Table 89 U.K. Market, By Application, 2013�2020 (USD Million)
Table 90 U.K. Market, By Application, 2013�2020 (Tons)
Table 91 Italy Market, By Purity Level, 2013�2020 (USD Million)
Table 92 Italy Market, By Purity Level, 2013�2020 (Tons)
Table 93 Italy Market, By Application, 2013�2020 (USD Million)
Table 94 Italy Market, By Application, 2013�2020 (Tons)
Table 95 Rest of Europe High Purity Alumina Market, By Purity Level, 2013�2020 (USD Million)
Table 96 Rest of Europe Market, By Purity Level, 2013�2020 (Tons)
Table 97 Rest of Europe Market, By Application, 2013�2020 (USD Million)
Table 98 Rest of Europe Market, By Application, 2013�2020 (Tons)
Table 99 RoW High Purity Alumina Market, By Purity Level, 2013�2020 (USD Million)
Table 100 RoW Market, By Purity Level, 2013�2020 (Tons)
Table 101 RoW Market, By Application, 2013�2020 (USD Million)
Table 102 RoW Market, By Application, 2013�2020 (Tons)
Table 103 Expansions, 2010�2016
Table 104 Agreements, 2010�2015
Table 105 Joint Ventures/Collaborations, 2012-2015
Table 106 Divestments, 2009�2014
Table 107 Mergers & Acquisitions, 2009�2014
Table 108 New Technology Developments, 2009�2014
List of Figures (42 Figures)
Figure 1 High Purity Alumina: Market Segmentation
Figure 2 High Purity Alumina: Market Research Design
Figure 3 Breakdown of Primary Interviews
Figure 4 Bottom-Up Approach
Figure 5 Top-Down Approach
Figure 6 High Purity Alumina: Market Data Triangulation
Figure 7 The LED Application Segment is Expected to Register the Highest Market Growth in the High Purity Alumina (Tons)
Figure 8 The High Purity Alumina Market for 4N Purity Level is Expected to Register the Highest Growth
Figure 9 Asia-Pacific Accounts for the Largest Market Share in the High Purity Alumina
Figure 10 The High Purity Alumina Market is Projected to Grow at A High CAGR During the Forecast Period
Figure 11 The Asia-Pacific Market is Projected to Register the Highest Growth Between 2015 and 2020
Figure 12 China is the Largest Market for HPA in APAC Region
Figure 13 The 4N Purity Level Segment is Expected to Witness High Growth Between 2015 and 2020
Figure 14 Asia-Pacific & North America are the Potential High Growth Markets for High Purity Alumina
Figure 15 Global Overview of Alumina Production
Figure 16 Drivers, Restraints, Opportunities & Challenges in the High Purity Alumina Market
Figure 17 High Purity Alumina Industry: Value Chain Analysis
Figure 18 4N Purity Level Segment Leads the Market of High Purity Alumina, 2015 & 2020
Figure 19 LED Application Segment to Lead the Global Market of High Purity Alumina During the Forecast Period
Figure 20 Regional Snapshot: China is Emerging as A New Hotspot in the Global High Purity Alumina Market
Figure 21 Markets in the Asia-Pacific and North America Regions are Expected to Witness High Growth During Forecast Period
Figure 22 Asia-Pacific Market: Snapshot
Figure 23 North America Market: Snapshot
Figure 24 Europe Market: Snapshot
Figure 25 Companies Adopted Expansions as the Key Growth Strategy, 2010�2015
Figure 26 Major Growth Strategies in the Market, 2010�2015
Figure 27 Developments in the Global Market, 2009�2015
Figure 28 Regional Revenue Mix of Market Players
Figure 29 Altech Chemicals Ltd.: Company Snapshot
Figure 30 Alcoa Inc.: Company Snapshot
Figure 31 Alcoa Inc.: SWOT Analysis
Figure 32 Orbite Technologies.: Company Snapshot
Figure 33 Orbite Technologies Inc.: SWOT Analysis
Figure 34 Sumitomo Chemical Co., Ltd.: Company Snapshot
Figure 35 Sumitomo Chemical Co., Ltd.: SWOT Analysis
Figure 36 Nippon Light Metal Company Ltd.: Company Snapshot
Figure 37 Nippon Light Metal Company Ltd.: SWOT Analysis
Figure 38 Rusal: Company Snapshot
Figure 39 Rusal: SWOT Analysis
Figure 40 Sasol Company: Company Snapshot
Figure 41 Marketsandmarkets Knowledge Store Snapshot
Figure 42 Marketsandmarkets Knowledge Store: Chemicals & Material Industry Snapshot


Growth opportunities and latent adjacency in High Purity Alumina Market